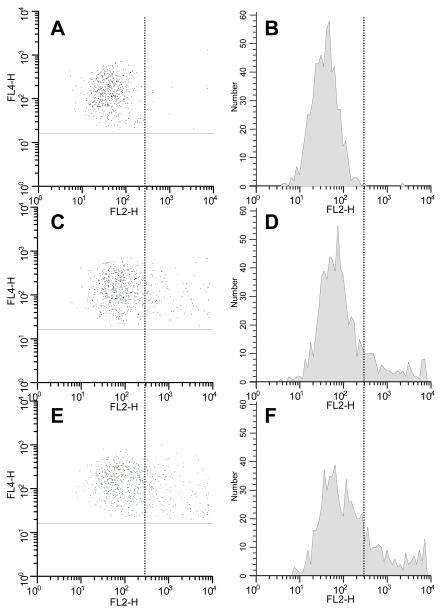
Figure 1.
Flow cytometry results from a single subject. A: Scatter plot for CD14+ gated cells (vertical axis) versus PE- conjugated isotype control (horizontal axis); B: Histogram of the PE fluorescence data of panel A; C: Scatter plot for CD14+ gated cells versus PE-conjugated anti-RANK under control conditions without FSH; D: Histogram of the PE fluorescence data of panel C; E and F: same as panels C and D, except cells were cultured with 50 mIU/ml FSH. The vertical line indicates the demarcation between nonspecific and specific staining (at an RFI of 300 for this subject).

