Figure 3.

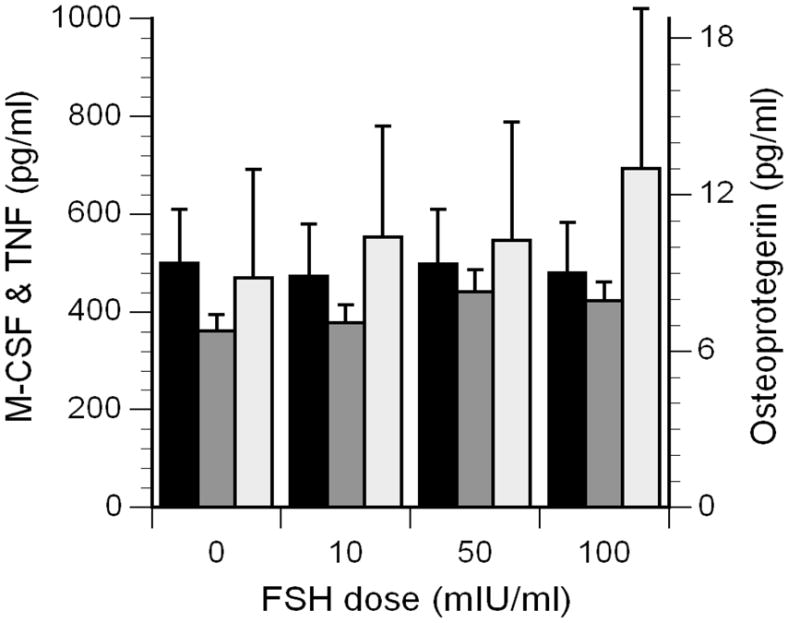
Concentrations of M-CSF (black bars, scale on left), OPG (dark gray bars, scale on right), and TNFα (light gray bars, scale on left) in the supernatants of mononuclear cells cultured with FSH.

Concentrations of M-CSF (black bars, scale on left), OPG (dark gray bars, scale on right), and TNFα (light gray bars, scale on left) in the supernatants of mononuclear cells cultured with FSH.