

Abstract
Characterization of molecular dynamics on living cell membranes at the nanoscale is fundamental to unravel the mechanisms of membrane organization and compartmentalization. Here we demonstrate the feasibility of fluorescence correlation spectroscopy (FCS) based on the nanometric illumination of near-field scanning optical microscopy (NSOM) probes on intact living cells. NSOM-FCS applied to fluorescent lipid analogs allowed us to reveal details of the diffusion hidden by larger illumination areas. Moreover, the technique offers the unique advantages of evanescent axial illumination and straightforward implementation of multiple color excitation. As such, NSOM-FCS represents a powerful tool to study a variety of dynamic processes occurring at the nanometer scale on cell membranes.
Measurement of lateral diffusion of lipids in living cell membranes provides valuable information to unravel the connection between membrane organization and cellular mechanisms such as signaling, trafficking, and adhesion (1,2). Unfortunately, because membrane lipids undergo very rapid diffusion, it is challenging to follow their motion in a cargo-free state using camera-based single particle tracking approaches (3). Moreover, the diffusion of some membrane components, e.g., sphingolipids and glycosylphosphatidyl inositol-anchored proteins, is affected by the formation of cholesterol-enriched nanodomains (2). Although fluorescence recovery after photobleaching (4) and confocal fluorescence correlation spectroscopy (FCS) (5) provide the time resolution needed to resolve fast dynamics, their large illumination areas hide diffusion heterogeneities taking place at the nanometric scale.
Owing to the high temporal resolution, easy data collection, and analysis of FCS (5,6), latest technological efforts aimed to resolve nanoscale dynamics have been mainly directed toward FCS using subdiffraction illumination schemes (7–11). Among the proposed strategies, near-field optical approaches, based on metallic nanoapertures, have demonstrated the feasibility of FCS measurements with subdiffraction illumination areas on living cells (8) and have provided the first evidence of nanometric heterogeneities of the membrane (9,10).
Recently, a thorough characterization of nanoscale lipid diffusion has been carried out by means of FCS based on stimulated emission depletion (STED) fluorescence illumination (11). The highly reduced lateral size of the STED illumination allowed us to reveal transient confinement of sphingolipids and glycosylphosphatidyl inositol-anchored proteins in cholesterol-mediated molecular complexes of diameter < 20 nm. Nevertheless, the high energy density of the STED depletion beam (10–100 MW/cm2) raised concerns about fluorophore photobleaching and cell phototoxicity. More recently, complementary techniques have been applied to validate these STED-FCS results (12).
In this framework, an alternative and powerful approach to study nanoscale molecular dynamics of cell membranes is given by the use of near-field optical scanning microscopy (NSOM) probes. In fact, NSOM probes ensure nanoscale illumination areas with power densities comparable to confocal FCS. Additionally, the evanescent axial excitation limits the fluorescent background arising from cytosolic components. Finally, NSOM probes have the potential for a straightforward implementation of multiple color excitation, with full overlap of the illumination regions. The advantages of NSOM-FCS have been successfully demonstrated for molecules diffusing in solution (13), in supported (14) and in unsupported functional membranes (15). Yet, performing NSOM-FCS on intact living cell membranes has remained challenging. The main reasons for it are the fluidity and thermal flickering of cell membranes, which prevent keeping the probe in close proximity of the cell in a noninvasive way.
Here we demonstrate for the first time, to our knowledge, that by means of an accurate control of probe positioning, NSOM-FCS is indeed feasible on intact living cell membranes. Our results unambiguously show that probe-sample interactions do not alter membrane diffusion. Furthermore, NSOM-FCS experiments on fluorescent lipid analogs reveal diffusion heterogeneities associated with membrane compartmentalization at the nanoscale.
A schematic of the probe-sample arrangement is shown in Fig. 1 A. Subwavelength circular aperture probes of different sizes were fabricated according to Veerman et al. (16). Excitation was provided by He-Ne laser (λ = 633 nm) coupled to the back end of the NSOM fiber. The NSOM probe was attached to an oscillating quartz tuning fork and inserted into a diving bell to allow operation under liquid conditions (17). A shear force feedback was used to keep the probe in close proximity to the sample. In the case of living cells, the feedback follows membrane fluctuations, keeping the membrane within the evanescent field and allowing stable recording of fluorescence traces for up to 30 s (see Supporting Material). Typical Q factors in liquid at ∼300–600 guaranteed the maximum probe-membrane interaction to be <500 pN (16). Optical inspection of the cell after probe contact, as well as NSOM- and confocal FCS curves recorded at the same cell position, ensured that the interaction with the probe did not alter membrane morphology neither lipid diffusion. Power densities at the end of the probes were <50 kW/cm2. The fluorescence signal was collected by a 100×-1.36 NA objective, suitably filtered, and detected by an avalanche photodiode. A photon-counting unit was used to record photon arrival time traces (see insets of Fig. 2) that were successively processed by a software correlator (18). Comparative FCS experiments were also carried out in the same setup using confocal excitation with powers ∼10 μW.
Figure 1.
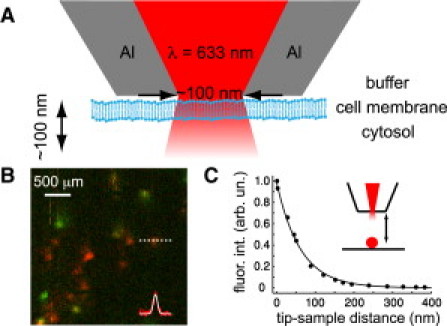
(A) Schematic of the NSOM-FCS experiment. (B) Image of single molecules embedded in a polymer film obtained by a 120-nm aperture probe. (Red and green) Orthogonal polarization detection. Gaussian fitting of the line profile provides full width at half-maximum of 125 ± 9 nm. (C) Fluorescence intensity of a 100-nm bead in air as a function of the sample-probe distance. Aperture probe diameter was 120 nm.
Figure 2.
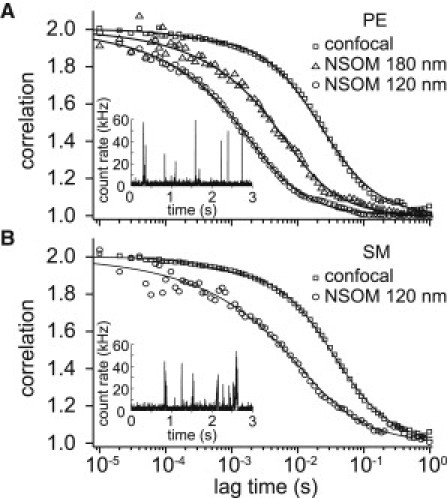
Normalized correlation curves for confocal (squares) and NSOM illumination (triangles, circles) obtained for phosphoethanolamine (A, PE) and sphingomyelin (B, SM). (Lines over data) Curve-fitting as explained in the text. (Insets) Fluorescence traces obtained in NSOM-FCS mode (120 nm aperture).
To validate our approach, we first imaged individual fluorophores embedded in a thin polymer film. The size of the fluorescence spots (Fig. 1 B) was consistent with the probe aperture diameter measured by scanning electron microscopy, reflecting close proximity of the tip to the sample. Calibration of the field intensity in the axial direction was performed by measuring the fluorescence on a 100-nm bead as a function of the sample-probe distance (Fig. 1 C). For a 120-nm aperture probe, the fluorescence intensity decays at its 1/e value at a distance of 62 ± 4 nm, indicating truly near-field excitation. NSOM- and confocal- FCS experiments were carried out on Chinese hamster ovary cells at 25°C. As a proof of principle we measured the diffusion of two fluorescent lipid analogs, the phosphoglycero-lipid n-(Atto647N)-1,2-dipalmitoyl-sn-glycero-3 phosphoethanolamine and the sphingolipid n-(Atto647N)-sphingosylphosphocholine (PE and SM; Atto-Tec, Siegen-Weidenau, Germany), incorporated in the membrane as described in the Supporting Material.
Resulting FCS curves, obtained by averaging correlations from 30 traces (>5 s) collected at random locations on different cells (6,11), are shown in Fig. 2. Confocal FCS curves were fitted by a free diffusion model plus a kinetic term (correlation time τK = 200–300 μs and population T = 4–5% for both PE and SM) associated with characteristic dark states of the dye (11). Fitting of the NSOM-FCS curves was performed according to the function given in Vobornik et al. (14), generalized to take into account anomalous diffusion,
where erf(x) represents the error function, τ the lag time, τD the average time spent by the fluorescent lipid in the excitation area, and α the anomalous diffusion exponent. Diffusion coefficients were calculated as D = A/(4τD), where A is the effective illumination area. In the confocal case, A = d2/(2ln2) for a Gaussian profile with full width at half-maximum d = 250 nm. For NSOM-FCS, A = πr2/4, where r is the radius of the aperture of the NSOM probe (60 nm and 90 nm) (14).
Correlation curves of PE, both with NSOM- and confocal FCS, were consistent with a free diffusion model (α = 1, Fig. 2 A). At the subdiffraction excitation areas provided by the NSOM probes, the diffusion time strongly shifts toward shorter timescales as the illumination area decreases (τD = 23 ± 3 ms for confocal, τD = 3.8 ± 0.4 ms for r = 90 nm, and τD = 1.2 ± 0.2 ms for r = 60 nm NSOM probes). The diffusion coefficient was obtained from the linear fit of the diffusion time versus the effective area, providing D = 0.49 ± 0.04 μm2 s−1. This linearity and the consistency of the diffusion coefficient with previously published values (11,12) ensure the robustness and the reproducibility of the NSOM-based approach.
Notably, the correlation curves obtained for SM (Fig. 2 B) show a different behavior. Whereas at the large area of confocal FCS the correlation is consistent with free diffusion (τD = 35 ± 2 ms), at the nanometric area of the NSOM probe, the correlation time shows a smaller reduction (τD = 5.7 ± 0.8 ms) compared to the one-order-of-magnitude change observed for PE. The slower diffusion of SM can be also inferred from the comparison of fluorescence bursts observed for the two lipids at the smallest illumination area (insets of Fig. 2). Moreover, the NSOM correlation curve also displays a slower decay typical of confined diffusion (α = 0.79 ± 0.07). The anomalous behavior of SM is entirely consistent with a cholesterol-induced confinement of sphingolipids (2,10–12). Because this trapping occurs in nanometric membrane domains, its effect on the diffusion dynamics can only be revealed by the high spatial resolution provided by the NSOM probe illumination (9,10).
In summary, we have demonstrated the feasibility of NSOM-FCS to measure the diffusion of lipids in the plasma membrane of living cells at the nanometer scale. Comparison of NSOM- and confocal FCS curves demonstrate that the effective reduction of the illumination area below the diffraction limit allows the identification of diffusing features associated with nanoscale membrane compartmentalization. NSOM-FCS on living cells opens the possibility to study nanoscale molecular diffusion not only on the membrane, but also in the membrane-proximal cytosolic region. By the implementation of dual color excitation, we expect this technique to become a new valuable tool to characterize the details of many biological processes in which molecular diffusion plays a relevant role. Although standard probes have limited throughput, novel geometries based on antennas (19–21) should, in principle, burst and confine the electric field below 30 nm, having excellent perspectives on future FCS applications.
Acknowledgments
We thank the staff of the Plataforma de Nanotecnología of the Barcelona Science Park for technical assistance and Dr. F. Ferri (Universitá dell'Insubria, Como) for the gift of a software correlator.
This work was supported by the EC-RTN IMMUNANOMAP and the EC-NEST-BIO-LIGHT-TOUCH (to M.F.G.-P., C.M., and T.S.v.Z.), the Spanish Ministry of Science and Technology (grant No. MAT2007-66629-C02-01), and the Generalitat de Catalunya (grant No. 2009 SGR 597 to M.F.G.-P.).
Supporting Material
References and Footnotes
- 1.Simons K., Vaz W.L.C. Model systems, lipid rafts, and cell membranes. Annu. Rev. Biophys. Biomol. Struct. 2004;33:269–295. doi: 10.1146/annurev.biophys.32.110601.141803. [DOI] [PubMed] [Google Scholar]
- 2.Lingwood D., Simons K. Lipid rafts as a membrane-organizing principle. Science. 2010;327:46–50. doi: 10.1126/science.1174621. [DOI] [PubMed] [Google Scholar]
- 3.Fujiwara T., Ritchie K., Kusumi A. Phospholipids undergo hop diffusion in compartmentalized cell membrane. J. Cell Biol. 2002;157:1071–1081. doi: 10.1083/jcb.200202050. [DOI] [PMC free article] [PubMed] [Google Scholar]
- 4.Meder D., Joao Moreno M., Simons K. Phase coexistence and connectivity in the apical membrane of polarized epithelial cells. Proc. Natl. Acad. Sci. USA. 2006;103:329–334. doi: 10.1073/pnas.0509885103. [DOI] [PMC free article] [PubMed] [Google Scholar]
- 5.Schwille P., Korlach J., Webb W.W. Fluorescence correlation spectroscopy with single-molecule sensitivity on cell and model membranes. Cytometry. 1999;36:176–182. doi: 10.1002/(sici)1097-0320(19990701)36:3<176::aid-cyto5>3.0.co;2-f. [DOI] [PubMed] [Google Scholar]
- 6.Kim S.A., Heinze K.G., Schwille P. Fluorescence correlation spectroscopy in living cells. Nat. Methods. 2007;4:963–973. doi: 10.1038/nmeth1104. [DOI] [PubMed] [Google Scholar]
- 7.Samiee K.T., Moran-Mirabal J.M., Craighead H.G. Zero mode waveguides for single-molecule spectroscopy on lipid membranes. Biophys. J. 2006;90:3288–3299. doi: 10.1529/biophysj.105.072819. [DOI] [PMC free article] [PubMed] [Google Scholar]
- 8.Edel J.B., Wu M., Craighead H.G. High spatial resolution observation of single-molecule dynamics in living cell membranes. Biophys. J. 2005;88:L43–L45. doi: 10.1529/biophysj.105.061937. [DOI] [PMC free article] [PubMed] [Google Scholar]
- 9.Wawrezinieck L., Rigneault H., Lenne P.F. Fluorescence correlation spectroscopy diffusion laws to probe the submicron cell membrane organization. Biophys. J. 2005;89:4029–4042. doi: 10.1529/biophysj.105.067959. [DOI] [PMC free article] [PubMed] [Google Scholar]
- 10.Wenger J., Conchonaud F., Lenne P.F. Diffusion analysis within single nanometric apertures reveals the ultrafine cell membrane organization. Biophys. J. 2007;92:913–919. doi: 10.1529/biophysj.106.096586. [DOI] [PMC free article] [PubMed] [Google Scholar]
- 11.Eggeling C., Ringemann C., Hell S.W. Direct observation of the nanoscale dynamics of membrane lipids in a living cell. Nature. 2009;457:1159–1162. doi: 10.1038/nature07596. [DOI] [PubMed] [Google Scholar]
- 12.Sahl S.J., Leutenegger M., Eggeling C. Fast molecular tracking maps nanoscale dynamics of plasma membrane lipids. Proc. Natl. Acad. Sci. USA. 2010;15:6829–6834. doi: 10.1073/pnas.0912894107. [DOI] [PMC free article] [PubMed] [Google Scholar]
- 13.Leutenegger M., Gösch M., Lasser T. Confining the sampling volume for Fluorescence Correlation Spectroscopy using a sub-wavelength sized aperture. Opt. Express. 2006;14:956–969. doi: 10.1364/opex.14.000956. [DOI] [PubMed] [Google Scholar]
- 14.Vobornik D., Banks D.S., Johnston L.J. Fluorescence correlation spectroscopy with sub-diffraction-limited resolution using near-field optical probes. Appl. Phys. Lett. 2008;93:163904. [Google Scholar]
- 15.Herrmann M., Neuberth N., Naber A. Near-field optical study of protein transport kinetics at a single nuclear pore. Nano Lett. 2009;9:3330–3336. doi: 10.1021/nl901598z. [DOI] [PubMed] [Google Scholar]
- 16.Veerman J.A., Otter A.M., van Hulst N.F. High definition aperture probes for near-field optical microscopy fabricated by focused ion beam milling. Appl. Phys. Lett. 1998;72:3115–3117. [Google Scholar]
- 17.Koopman M., de Bakker B.I., van Hulst N.F. Shear force imaging of soft samples in liquid using a diving bell concept. Appl. Phys. Lett. 2003;83:5083–5085. [Google Scholar]
- 18.Magatti D., Ferri F. Fast multi-tau real-time software correlator for dynamic light scattering. Appl. Opt. 2001;40:4011–4021. doi: 10.1364/ao.40.004011. [DOI] [PubMed] [Google Scholar]
- 19.Garcia-Parajo M.F. Optical antennas focus in on biology. Nat. Photonics. 2008;2:201–203. [Google Scholar]
- 20.Höppener C., Novotny L. Antenna-based optical imaging of single Ca2+ transmembrane proteins in liquid. Nano Lett. 2008;9:3330–3336. doi: 10.1021/nl073057t. [DOI] [PubMed] [Google Scholar]
- 21.van Zanten T.S., Lopez-Bosque M.J., Garcia-Parajo M.F. Imaging individual proteins and nanodomains on intact cell membranes with a probe-based optical antenna. Small. 2010;6:270–275. doi: 10.1002/smll.200901204. [DOI] [PubMed] [Google Scholar]
Associated Data
This section collects any data citations, data availability statements, or supplementary materials included in this article.