

Abstract
Most membrane proteins contain a transmembrane (TM) domain made up of a bundle of lipid-bilayer-spanning α-helices. TM α-helices are generally composed of a core of largely hydrophobic amino acids, with basic and aromatic amino acids at each end of the helix forming interactions with the lipid headgroups and water. In contrast, the S4 helix of ion channel voltage sensor (VS) domains contains four or five basic (largely arginine) side chains along its length and yet adopts a TM orientation as part of an independently stable VS domain. Multiscale molecular dynamics simulations are used to explore how a charged TM S4 α-helix may be stabilized in a lipid bilayer, which is of relevance in the context of mechanisms of translocon-mediated insertion of S4. Free-energy profiles for insertion of the S4 helix into a phospholipid bilayer suggest that it is thermodynamically favorable for S4 to insert from water to the center of the membrane, where the helix adopts a TM orientation. This is consistent with crystal structures of Kv channels, biophysical studies of isolated VS domains in lipid bilayers, and studies of translocon-mediated S4 helix insertion. Decomposition of the free-energy profiles reveals the underlying physical basis for TM stability, whereby the preference of the hydrophobic residues of S4 to enter the bilayer dominates over the free-energy penalty for inserting charged residues, accompanied by local distortion of the bilayer and penetration of waters. We show that the unique combination of charged and hydrophobic residues in S4 allows it to insert stably into the membrane.
Introduction
Membrane proteins account for nearly a quarter of all genes (1) and are major targets for several classes of drugs (2). However, much remains to be understood concerning their structure and stability. Most membrane proteins have transmembrane (TM) domains made up of bundles of hydrophobic α-helices. Indeed, the overall hydrophobicity of an α-helix in a membrane protein determines whether or not it inserts into the lipid bilayer. A survey of integral membrane proteins suggests that most TM helices have hydrophobic cores with aromatic and/or positively charged residues located toward the bilayer/solvent interface where they act as anchors by interacting with water and the lipid headgroups (3). It is interesting to note that some membrane proteins have one or more positively charged residues (especially arginine (Arg)) apparently buried within the hydrophobic membrane core. This is the case in the voltage-sensor (VS) domain (4) of voltage-activated potassium channels. This and other related examples require a closer examination of the nature of interaction of basically charged residues with lipid bilayers.
The voltage-activated potassium (Kv) channel is the best understood member of the family of VS domain proteins (5). The S4 helix of the VS domain contains an array of basic residues, typically around four to five Args, in an otherwise hydrophobic α-helix. Crystal structures of Kv channels suggest that the S4 helix adopts a TM orientation (6,7). This TM orientation of S4 is at odds with the energetic penalty for exposure of charges to the hydrophobic environment of the bilayer core (8). Thus, S4 provides a specific test case for how a charge-containing TM helix may be stabilized within a lipid bilayer.
Recent studies of translocon-mediated insertion suggest that the S4 helix of Kv channels may insert into a membrane with a small free-energy barrier, ∼+0.5 kcal/mol (9). Molecular dynamics (MD) simulations of S4 inserted across a lipid bilayer suggest that local deformation of the membrane results in an extensive network of hydrogen bonds (H-bonds) between the basic residues of S4, and lipid headgroups and bilayer-penetrating water molecules (10). However, based on simulation studies of simpler model systems, it has been shown that inserting charged residues into a membrane would incur a significant free-energy barrier (11,12). For example, MD simulations predict a free-energy barrier of ∼15–17 kcal/mol for inserting a single protonated Arg side chain into lipid bilayers (12,13). Of course, the situation may be more complicated for TM helices such as S4, which contain multiple Arg side chains due to nonadditive effects (13). Thus, the physical basis for the apparent TM stability of S4 remains unclear.
We have investigated the interaction of S4 with the membrane via MD simulations. To achieve this, we used a serial multiscale approach (14), combining extended (microseconds) coarse-grained (CG) (15–21) simulations with atomistic (AT) MD simulations to efficiently explore S4/bilayer/water configurations. This enables us to estimate a 1D free energy/potential of mean force (PMF) profile to ascertain the thermodynamics of S4/bilayer interactions. Adopting a multiscale approach was crucial, as accurate estimation of free energies presents sampling and convergence challenges. CG simulations provided an initial view of how S4 interacted with the membrane, which was subsequently refined with AT simulations. We have successfully applied this serial multiscale approach to improve the free-energy estimate of a peptide toxin binding to lipid bilayers (22). In comparison to other related MD simulations of S4/membrane (10) and voltage sensor/membrane (4,23,24) interactions, the simulations presented here are over more extensive timescales (microseconds versus nanoseconds), are based on two levels of representation (CG and AT), and moreover, they address S4 stability in a membrane via the evaluation of free energies. Our data suggest that it is thermodynamically favorable for S4, with its charges, to adopt a TM orientation. We analyze the underlying forces governing the free-energy profile and propose that the S4 helix possesses a combination of charged and hydrophobic residues that allows it to insert stably in the membrane.
Theory and Methods
Umbrella sampling MD simulations to derive CG and AT PMF profiles
For each CG PMF profile (for the Kv1.2 and KvAP S4 helices, separately, in each case with a palmitoyloleoyl phosphatidylcholine (POPC) bilayer containing 256 lipids), we used 130 independent simulations (windows) along z, spaced 1 Å apart, to sample from the extracellular solvent, across the POPC bilayer, and into the intercellular (IC) solvent (z = −65 to 65 Å; the bilayer center is at z ∼ 0 Å). At both limits, S4 was beyond the interaction cutoff with the bilayer. For each window, a simulation of duration 80 ns was employed. An identical initial orientation of S4 with respect to the bilayer was used in all CG simulations. The helix was able to locate its optimal orientation over the time course of all CG simulations. As a further test, we repeated the CG PMF simulations but with S4 in a different initial orientation to reveal negligible differences in the free energies (Supporting Material). We discarded the first 40 ns of each window as equilibration; thus, each CG profile utilized distributions from 40 to 80 ns.
To generate the starting configurations for the AT PMF windows (Kv1.2 S4 helix with a POPC bilayer), we clustered the trajectory of the corresponding CG window on the basis of S4 orientation (from 40 to 80 ns) and selected the median coordinates, which represent the system with the most frequently observed orientation of S4. We then converted membrane and solvent to an AT representation. To convert the CG lipid to an AT model, energy-minimized AT lipid fragments were aligned to the CG particles, with the missing atoms between each particle extracted and appended to the CG lipids. The AT lipids were then energy-minimized to remove any clashes that resulted from the conversion. We performed a least-squares fit of the crystal structure of the Kv1.2 S4 helix to the median CG helix coordinates. Thus, any membrane deformation and penetration of waters into the membrane were preserved in the CG-to-AT conversion, permitting shorter AT equilibration times. We used 130 AT windows along z, spaced 1 Å apart (z = −65 to 65 Å). For each window, a simulation of duration 10 ns was employed. The first 5 ns of each window was discarded as equilibration; thus, the AT profile utilized distributions from 5 to 10 ns. We achieved good sampling in both CG and AT simulations and obtained Boltzmann-like distributions from all umbrella sampling windows.
We obtained coordinates of the S4 helices from the Protein Data Bank (KvAP, PDB code 1ORS (25), and Kv1.2, PDB code 2A79 (6)). Both S4 helices were of 23 residues, spanning residues 112 to 134 in KvAP (sequence GLGLFRLVRLLRFLRILLIISRG, where hydrophobic residues are in italic and basic residues in bold), and 289 to 311 in Kv1.2 (sequence SLAILRVIRLVRVFRIFKLSRHS). Modeler 8v1 (26,27) was used to model side chains not resolved in the crystal structure of Kv1.2 S4. The CG force field used (15), derived from one originally developed for semiquantitative lipid simulations (16), is based on a 4:1 mapping of heavy atoms, in a similar spirit to other recent CG models (17–20). This force field has been parameterized to reproduce transfer free energies from water across a lipid bilayer (15). Thus, each amino acid was represented with one CG backbone particle and between one and two CG side-chain particle(s) depending on residue size. Secondary structure was maintained via the application of harmonic potentials (force constant 2.4 kcal mol−1 Å−2) between the CG backbone particles on the basis of H-bonding along the helix backbone, as observed in the crystal structures. We tested the sensitivity of the free energies to the treatment of secondary structure in the CG simulations (which is difficult because of the inherent simplification) by reestimating the CG PMF profile of Kv1.2 S4 with an alternative treatment of secondary structure (an elastic network model (ENM); see the Supporting Material) to reveal minor differences in free energies. AT simulations utilized the GROMOS96 force field (28) and Berger parameters for POPC lipids (29,30). CG and AT membranes consisted of 256 lipids. We used a harmonic biasing potential in the umbrella sampling simulations (force constant 2.4 kcal mol−1 Å−2), and an implementation of the weighted histogram analysis method (WHAM) (31) to unbias the distributions (Alan Grossfield (University of Rochester Medical Center); membrane.urmc.rochester.edu/Software/WHAM/WHAM.html), with a tolerance of 0.0001. The basic residues of S4 were kept protonated (i.e., charged) in all simulations. The simulations utilized a TM potential of 0 V (i.e., no TM potential was applied).
Simulation protocol
MD simulations were performed with Gromacs 3.3.3. Each AT system was solvated with SPC waters. Cl− counterions were added to keep each CG and AT system electrically neutral. Each simulation was temperature coupled with a Berendsen thermostat (32) to a reference temperature of 310 K, with a coupling constant τT of 1.0 and 0.1 ps for CG and AT, respectively. Semi-isotropic pressure coupling with a Berendsen barostat (32) in x and y (membrane normal along z) at 1 bar with a coupling constant τP of 1.0 ps, and a compressibility value of 5.0 × 10⁻⁶ and 4.6 × 10⁻⁵ bar−1 for CG and AT, respectively, was used. In the CG simulations, electrostatic (Coulombic) interactions were shifted to zero between 0 and 12 Å, and van der Waal's interactions were shifted to zero between 9 and 12 Å, with a relative dielectric constant of 20. The AT simulations utilized the particle mesh Ewald (PME) method (33), employing a grid spacing of ∼1 Å−1 and an interpolation order of 4. A cutoff of 12 Å was used for the real space portion of the Ewald sum and the Lennard-Jones interactions. The LINCS algorithm (34) was applied to constrain all covalent bonds, and the SETTLE algorithm (35) was used to maintain the geometry of the water molecules in the AT simulations.
Results
Free-energy profiles
Our reaction coordinate (z) is the position, parallel to the membrane normal, of the center of mass (COM) of S4 with respect to the COM of the membrane. Thus, at either limit, i.e., z = ±60 Å, the S4 helix was located in water, whereas at z = 0 Å the S4 helix spanned the bilayer. The change in free energy, ΔG, is with respect to S4 at the limits, when located in water. The CG PMF profiles (total simulation time of 21 μs) revealed that it was favorable by −41 kcal/mol for the Kv1.2 S4 helix to partition from water to a membrane interfacial location at z = ±18 Å (Fig. 1 A), with the helix axis aligned parallel to the bilayer surface. The S4 helix was oriented with its backbone close to glycerol groups of the lipids, with the basic side chains directed toward the lipid phosphates, and the hydrophobic side chains directed toward the lipid tails (Fig. 1 B). It is significant that a local minimum, less stable than the interfacial minima by +5 kcal/mol but more stable than the helix in water by −36 kcal/mol, was also revealed. This corresponded to z = 0 Å, with the S4 helix in a TM orientation. From visual inspection, it is clear that the membrane was locally deformed when S4 was in a TM orientation (as seen in previous CG studies (36)).
Figure 1.

(A) PMF/free-energy profiles for the S4 helices of Kv1.2 and KvAP across a membrane. The reaction coordinate z is the position, parallel to the membrane normal, of the COM of S4 with respect to the COM of the membrane. The membrane center is at z ∼ 0 Å. Free energies were derived using CG and AT MD simulations with explicit membrane and solvent. The basic residues of S4 were charged. The CG and AT simulations utilized a pure POPC bilayer. The gray regions indicate the approximate locations of the lipid phosphates. (B) Snapshots of the Kv1.2 S4 helix at local and global minima in the CG and AT profiles. The helix backbone is cyan, and Arg and Lys residues are blue and red, respectively. POPC phosphorus atoms and phosphate moieties (in CG and AT, respectively) are colored orange. Waters are red and white. Waters near Arg and Lys residues are green. All other lipid atoms/particles are not shown.
To evaluate the robustness of our approach, we calculated the CG PMF profile for the S4 helix of the archaeal Kv channel KvAP (25). The overall PMFs for S4 of KvAP and Kv1.2 were very similar, but the TM orientation for KvAP was ∼−2 kcal/mol more stable than for Kv1.2. This difference can be reconciled if one recalls that the S4 helix of KvAP contains five Arg residues compared to six basic residues (5 Arg + 1 Lys) in S4 of Kv1.2. We emphasize that our CG PMF profiles were well converged due to extensive sampling, as is evident from the symmetry of the profiles on either side of the membrane (see Supporting Material for convergence tests). Nonsampled degrees of freedom, in particular, helix orientation with respect to the membrane, equilibrated in the CG simulations, and this is why the PMF profile is symmetric despite an asymmetric distribution of residues in the S4 sequence. We repeated the CG simulations with S4 in a different initial orientation to test whether we could capture other favorable helix orientations to reveal negligible differences in the free energies (Supporting Material). As a further test of the methodology, we calculated the CG free energy of taking the S4 helix of Kv1.2 from water to the headgroup/tail interface via an alternative sampling protocol (thermodynamic integration; Supporting Material) to derive a ΔG of −41 ± 1 kcal/mol (± SD).
We used the trajectories of the CG simulations to guide the setup of the corresponding AT simulations of Kv1.2 S4 and a POPC bilayer. We searched >∼3 × 10⁶ configurations of S4 in the CG simulations to identify favorable orientations of the helix (with respect to the membrane) at each point along reaction coordinate z. We are confident that the CG simulations can sample relevant helix orientations. The CG simulations show that S4 adopted one dominant and favorable helix orientation at each point along z as it interacted with the membrane, and it is this orientation that is explored within the AT simulations. We show that the helix orientations predicted by the CG simulations correlated closely with the AT simulations (Supporting Material). This allowed us to derive a meaningful 1D AT PMF profile, as helix orientation is an important, nonsampled, orthogonal degree of freedom that crucially needs to equilibrate, and may be difficult to achieve over accessible AT timescales. Block analyses revealed that the AT profile was well converged (Supporting Material). The AT free-energy profile (total simulation time of 1.3 μs) resembles the CG profile in showing minima corresponding to both interfacial and TM orientations of the S4 helix, but the AT and CG profiles differ in their relative energies of these two orientations. Thus, in the AT profile we see metastable (∼−38 kcal/mol relative to in water) minima/shoulders at z = ±13 Å, with the S4 helix axis aligned parallel to the membrane surface near the lipid glycerols, and the Arg and Lys residues exposed to the lipid phosphates and solvent (Fig. 1 B). (The shift in the location of the interfacial minima by 5 Å between the CG and AT profiles is accounted for by differences in the equilibrium thickness of the CG and AT membranes). S4 remained helical over the time course of our simulations, even when located in water, as (unlike the case in CG simulations) no additional restraints were applied to maintain helicity in the AT simulations.
The global minimum in the AT profile corresponds to S4 in a TM orientation, with a ΔG of −45 kcal/mol in taking the Kv1.2 S4 helix from water to the bilayer center (z = 0 Å). With S4 in this TM orientation, the helix tilt angle was 25°, which is comparable to ∼35° in the crystal structure of Kv1.2 (6). Local bilayer defects and water penetration into the hydrophobic core were observed, as in an earlier study of S4 in a bilayer (10), thus providing a locally favorable environment for the basic residues.
Decomposition of the AT free-energy profile
We investigated the individual components of the S4/membrane/water interactions by decomposing the AT PMF profile (Fig. 2):
where is the instantaneous force acting on the helix COM due to component α of the helix interacting with component β of its environment. Thus, we decomposed the AT PMF profile into contributions arising from the interactions between the basic (b) (i.e., Arg and Lys) and the nonbasic (nb) (all other residues, which are predominantly hydrophobic) residues of S4 with lipids (l) and solvent (s) (i.e., water and counterions): Wb-l, Wb-s, Wnb-l, and Wnb-s. Note that in calculating these terms for the interaction of S4 residues with the bilayer and solvent environment, the energetic cost of perturbing the environment (i.e., deformation of the bilayer and penetration of water molecules) is hidden (12).
Figure 2.
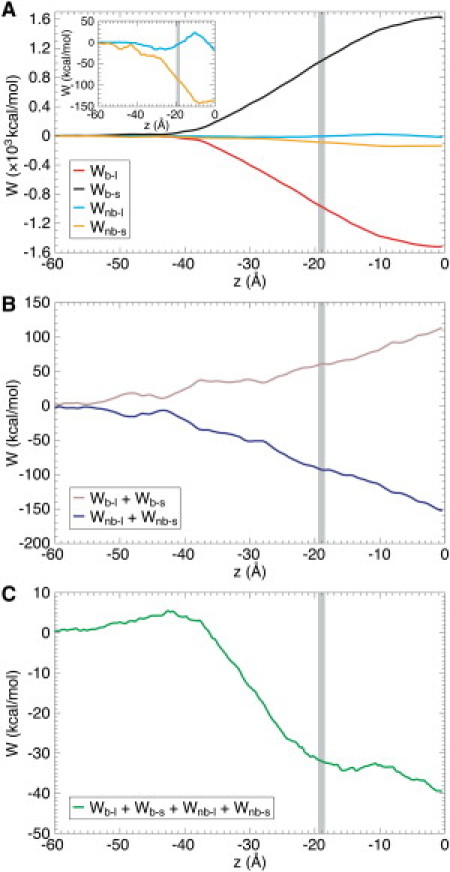
Decomposition of the AT PMF profile of Kv1.2 S4 interacting with a POPC bilayer to reveal contributions arising from the basic (b) (i.e., Arg and Lys) and nonbasic (nb) (all other residues, which are predominantly hydrophobic) residues of S4 interacting with lipids (l) and solvent (s) (i.e., water and counterions). W denotes free energy. (A) Wb-l, Wb-s, Wnb-l, and Wnb-s. (B) Wb-l + Wb-s and Wnb-l + Wnb-s. (C) Wb-l + Wb-s + Wnb-l + Wnb-s. Analyses performed over 5–10 ns (i.e., the equilibrated period) per umbrella sampling window.
It is evident (Fig. 2 A) that interactions between the basic residues and the environment (i.e., Wb-l and Wb-s) were approximately an order of magnitude larger than those arising from the hydrophobic residues (i.e., Wnb-l and Wnb-s). The large and positive Wb-s values toward 0 Å represent the free-energy cost of (partially) dehydrating the basic residues of S4. It is significant that toward 0 Å, Wb-s began to plateau (i.e., tends to zero). This is because as the helix adopted a TM orientation toward 0 Å, waters penetrated from both sides of the membrane, resulting in a mean net force on the helix COM of zero. It is also significant that interactions between the basic residues and lipids made a negative (i.e., favorable) contribution to the PMF (Wb-l). This is because electrostatic interactions (between the basic residues and the lipid headgroups) dominated, and the membrane was able to deform near the helix to maintain such interactions (see below). Thus, interactions between the basic residues of S4 and the membrane stabilized the helix. This is consistent with a number of recent experiments indicative of functionally important interactions between the basic side chains of S4 and the phosphate groups of lipids (37,38). If we sum Wb-l and Wb-s, we get an overall free energy barrier of +113 kcal/mol for taking the basic residues of S4 from water to the center of the membrane (Wb-l + Wb-s; Fig. 2 B).
Although there is a small barrier (Wnb-l = +23 kcal/mol at −10 Å) in taking the hydrophobic residues of S4 past the lipid headgroups, the nonbasic/lipid interactions are favorable to S4 insertion (−18 kcal/mol at 0 Å; compared to water). However, as expected, the dominant term is the favorable removal of the hydrophobic residues of S4 from water, making a major negative contribution to the PMF (Wnb-s = −135 kcal/mol at 0 Å). Thus, summing Wnb-l and Wnb-s, it is overall energetically favorable (Wnb-l + Wnb-s = −153 kcal/mol at 0 Å) to take the hydrophobic residues of S4 from water to the bilayer center, despite water penetration and bilayer distortion (see below) due to the basic residues. Thus, although there is a free energy penalty for taking the basic residues of S4 into the membrane, this is compensated for by the free-energy gain of taking the hydrophobic residues of S4 away from water into the bilayer core (as shown in Fig. 2 C, which is a reconstruction of the PMF from the total mean force). A picture therefore emerges wherein as a result of its combination of charged and hydrophobic residues, the S4 helix of Kv channels is uniquely poised to insert stably in lipid bilayers in a TM fashion despite carrying charged cargo. This is consistent with recent high-resolution structures of Kv channels where the S4 helix can be seen to adopt a TM orientation and interact with a number of lipid molecules (6,7).
Thus, large individual free-energy terms (i.e., on the order of ∼103 kcal/mol in Wb-l and Wb-s) cancel to give an overall free energy of S4 insertion two magnitudes smaller (i.e., on the order of ∼101 kcal/mol), and we emphasize that the magnitude and overall balance of these terms are determined by the parameterization of the AT force field. We also decomposed our CG PMF profiles (Supporting Material). As anticipated from the study of Vorobyev et al. (39), this revealed that the simplified (cutoff) treatment of electrostatic interactions typically used in CG simulations introduces approximations into the interactions between the basic residues of S4 and the lipid headgroups and water that results in the metastable local minimum at 0 Å (see above), compared to the global minimum at 0 Å in the AT profile.
A microscopic view of the biophysical phenomena that stabilize S4 in a lipid bilayer
We restrict our subsequent analyses to the AT simulations of the Kv1.2 S4 helix when located at the global minimum (z = 0 Å). We calculated the thickness of the POPC bilayer as defined by the lipid phosphorus-to-phosphorus distance between opposite leaflets (dpp) as a function of distance in the bilayer plane from the COM of S4 (Fig. 3). Away from the helix, dpp was ∼36–40 Å, which corresponds to an unperturbed bilayer. Near S4, dpp was ∼20 Å, corresponding to a local thinning of the bilayer by ∼16–20 Å. Thus, lipid phosphates were pulled toward the membrane center as a result of favorable electrostatic interactions with the basic residues of S4, increasing exposure of the basic residues to water as a result (Fig. 4). We note that the deformation of the bilayer structure decayed to zero well before the boundary of the periodic simulation box. Membrane deformation was present in the corresponding CG simulations but to a more limited extent (see Supporting Material). Deformability of the membrane in our simulations is consistent with a crystal structure of a chimeric Kv channel with lipids bound, where lipids encircling the VS domain were displaced away from their equilibrium positions due to interactions with the channel (7), and with the structure observed in a number of earlier simulations, both atomistic (10,23,40–42) and CG (36,43).
Figure 3.

Bilayer deformation near the Kv1.2 S4 helix in the AT simulations when S4 was located at its global minimum (0 Å; i.e., S4 inserted in a TM orientation), shown by the lipid phosphorus-to-phosphorus distance (dpp) (i.e., between opposing leaflets) as a function of radial distance from the COM of S4.
Figure 4.

(A) Arg and Lys side chains of S4 interacting with bilayer-penetrating water molecules (red and white bonds) and phosphates (orange spheres) of lipids. (B) Hydrogen-bonding between the basic residues of S4 and its environment (i.e., POPC phosphates and carbonyls, and waters) with the helix inserted in a TM orientation. Mean ± 1 SD. Analyses performed over 5–10 ns.
It is evident that the basic side chains of S4 also snorkelled toward the solvent when the helix was inserted in a TM orientation (Fig. 4). To explore further the role of side-chain orientation in stabilizing the helix in the membrane, we analyzed (Fig. S8 in the Supporting Material) the first two dihedrals (χ1 and χ2) of the basic side chains of S4 (with the helix at 0 Å). When S4 was in water, the side chains explored a wide spread of orientations. With the inserted TM helix, the distributions of rotamers observed were more limited and corresponded to the side chains directed outward toward solvent (χ2 ∼ 180°). This was particularly the case for the more buried side chain of R300, which was locked in an outward configuration (toward the extracellular solvent; Fig. 4 A) by lipid headgroups and penetrated waters. The side chain of R303, unresolved in the crystal structure of Kv1.2, was modeled with an initial χ1 of ∼300° and χ2 of ∼180°, but over the time course of the simulation, χ2 tended toward ∼300° indicative of side-chain snorkelling toward the IC solvent. The side chain of R309, also unresolved in the crystal structure, was located in the IC interfacial region and exhibited a larger spread of rotamers (χ2 ∼ 60° and 180°; modeled with an initial χ1 of ∼180° and χ2 of ∼180°). The distribution of rotamers for R294, R297, and R300 (these side chains are resolved in the crystal structure) is consistent with the crystal structure of Kv1.2 S4.
We counted H-bonding interactions between the basic side chains of S4 and their environment (i.e., lipid phosphates, lipid carbonyls, and waters) (Fig. 4 B) that could stabilize the helix in the membrane. As expected, the Args of S4 H-bonded with waters, with residues located toward either terminus forming the greatest number of H-bonds (approximately three). It is interesting that even the buried Args (i.e., R300 and R303) were able to form, on average, more than one H-bond with water, indicative of membrane deformation and water defects in the bilayer due to the presence of the charged helix. However, R300 and R303 formed the most H-bonds with the lipid carbonyls (approximately two), again consistent with local bilayer deformation. The basic side chains also formed an average of ∼0.5–0.75 H-bonds with the lipid phosphates. Overall, this network of H-bonds between the Arg and Lys residues and their environment is made possible by the local bilayer deformation and is one of the bases of charge stabilization within the membrane (10,37).
Comparison with translocon-mediated insertion
Although we resist oversimplistic comparisons of simulation results with the data from translocon-mediated insertion, a more nuanced interpretation of the latter data (as in, e.g., Hessa et al. (44) and Enquist et al. (45)) aids the interpretation of the simulations. In the translocon-mediated studies, a ΔGAPP was calculated from an apparent equilibrium constant, KAPP, for membrane insertion of a given helix. The latter is calculated as KAPP = f1x/f2x, where f1x and f2x correspond to the fractions of singly and doubly glycosylated membrane proteins (45). If we compare ΔGAPP = −RTlnKAPP with ΔG values for transfer from water to the hydrophobic core, we are implicitly equating the doubly glycosylated state (represented by f2x) with the test helix in bulk aqueous solution. However, the f2x standard state may just as well correspond to a (nonmembrane) helix somewhere within the translocon or a nonhelical state of the peptide sequence in an aqueous environment. This complicates a direct comparison of the calculated PMFs with ΔGAPP. There is, however, an important indirect comparison that can be made. The translocon-mediated membrane insertion efficiency depends critically on the position of different amino acid side chains within the peptide sequence. For example, for KvAP S4, shifting outward from the center of the helix, two of the Arg residues changes ΔGAPP from +0.5 kcal/mol to 0.0 kcal/mol (9). This strong dependence of the exact position of the Arg residues is consistent with the complex balance of hydrophobic and polar interactions of side chains and lipids seen in this study. It also has been observed in combined simulation and NMR studies of a model hydrophobic peptide containing a single Arg residue at different positions within the hydrophobic α-helical core (46).
The free energies calculated from our PMFs seem to imply that the bulk water and surface-bound states of S4 would be visited with a vanishingly low probability. In contrast, the experimental results indicate that although the TM and non-TM states may coexist, the non-TM state is favored (9,47,48). For example, efficiency of membrane insertion for Shaker S4 is ∼10% (48). However, this apparent paradox can be resolved by a careful comparison of our calculations with the assumptions underlying the interpretation of the experimental data. As noted above, our PMF is for an S4 helix along a reaction coordinate corresponding to translation of the COM along the bilayer normal. Thus, we do not allow for possible unfolding of the S4 helix when in the aqueous phase. Although the nature of the partition event in the translocon-mediated insertion experiments remains uncertain, it is unlikely to correspond to that of a folded helix in an aqueous environment to an isolated transbilayer helix (49).
One can also explore the possibility that the partition event in translocon-mediated insertion corresponds to that of an unfolded peptide in an aqueous environment to a folded TM helix. From considerations of thermodynamics (see, e.g., White and Wimley (50) for a more detailed analysis):
where c = coil, α = α-helix, aq = aqueous, and TM = transmembrane. Now, if one equates the Hessa et al. (44) estimate of +0.5 kcal/mol for inserting the KvAP S4 helix into the endoplasmic reticulum (ER) membrane with ΔG{(c, aq) → (α, TM)}, one obtains a value of +45.5 kcal/mol for ΔG{(c, aq) → (α, aq)}, i.e., for the free energy of folding of an S4 helix in water. This value has not been measured experimentally. However, it is reasonable to assume, based on the extensive literature (both experimental and computational) about the thermodynamics of α-helix folding (see, e.g., Taylor et al. (51) and Gnanakaran et al. (52)), a value of between −5 and +5 kcal/mol, i.e., very different from that obtained from the above analysis. This in turn implies that one cannot simply equate the Hessa ΔGAPP with ΔG{(c, aq) → (α, TM)}.
Thus, there are two experimental structural observations for S4, namely, 1), that S4 can form an α-helix at a membrane interface (from NMR, e.g. (53)), and 2), that S4 can form a TM helix (from the x-ray structures of Kv channels). The PMF presented above is consistent with both of these. Furthermore, the apparent disagreement with the translocon-mediated insertion data may also be accommodated in the context of uncertainty concerning the reference state in these experiments.
Discussion and Conclusion
We have used explicit membrane and solvent CG and AT MD simulations to study how the S4 helices of Kv channels interact with lipid bilayers. The PMF profiles show that it is thermodynamically favorable for S4, along with its positively charged residues, to insert in a TM orientation into a POPC bilayer rather than to remain in water. Although this may appear counterintuitive (11), decomposition of the AT PMF profile revealed that the preference of the hydrophobic residues of S4 to escape water dominates over the free-energy penalty for inserting Arg residues into the membrane. Although we acknowledge that free-energy decomposition results should be interpreted with care, we note that they have given insightful results, e.g., in a recent study of the energetics of tilting of a model TM helix (54). In the case of S4, these calculations indicate that the penalty for inserting Arg residues into a bilayer is reduced by the deformability of the membrane, which also enables the penetration of waters into the hydrophobic core to provide a micropolar environment for the Arg side chains. It is the overall balance of charged versus hydrophobic residues that ultimately determines whether a helix can insert into a membrane.
It is perhaps also surprising that the interfacial location of the S4 helix is stabilized significantly relative to the helix in bulk water. We suggest that hydrophobic effects also are the key to stabilization of S4 at the membrane/water interface. In this location, with the principal axis of S4 aligned parallel to the membrane surface, and with the majority of the charged residues of S4 positioned on the same face of the helix, S4 was aligned such that the charged residues remained exposed to solvent, yet the hydrophobic residues were directed toward the hydrophobic lipid tails. In contrast, in bulk water, the hydrophobic residues are solvent-exposed.
The result that the ΔG for transfer of an S4 helix from an interfacial location to a TM location is closer to 0 kcal/mol than had been anticipated appears to be quite robust. Thus, both CG simulations (which are well sampled but which use an approximate force field) and AT simulations (where sampling is more of an issue, hence the multiscale approach, but for which the force field is more accurate) yield a picture that is broadly consistent with the available experimental data on S4 (9,47). Although we have considered S4 in isolation (i.e., without the remainder of the VS) in this study, we can nevertheless attempt to link insights gained to proposals as to how Kv channel VS domains may interact with a lipid bilayer. One may argue that, from a reductionist perspective, it is important to explore the insertion of an isolated S4 helix into a lipid bilayer to better understand the structure, function, and stability of the VS domain as a whole.
More generally, our PMFs provide an interesting perspective on the biological hydrophobicity scale of Hessa et al. (44) which was derived by challenging the translocon with a series of amino acid sequences in a test TM segment to determine the apparent free energy of inserting amino acids into the ER membrane. At first glance, there is some discrepancy between biological free energies and those derived from MD simulations (12,13). In the case of a lone, protonated Arg side chain, atomistic MD simulations predict a penalty of +15 to +17 kcal/mol (12,13) compared to only +2.5 kcal/mol in the translocon experiments (44). However, the penalty falls to +3 to +5 kcal/mol if Arg is introduced into a membrane with a mass fraction of ∼50% of other TM helices (55), indicating that changes in the immediate environment of a side chain can alter the energetics of insertion and thus complicating a direct interpretation of the translocon data. Hessa et al. have used translocon experiments to estimate a free energy of +0.5 kcal/mol for inserting the KvAP S4 helix into the ER membrane (9). However, a direct comparison of the current simulations and the translocon experiments is rather misleading (this is discussed in more detail in the Supporting Material and Table S1). Rather, the PMFs reported here should be thought of as exploring the origin of the (meta)-stability of a transbilayer S4 helix observed in a number of simulation studies (e.g., (10,36,56)) and of the energetic causes and consequences of the resultant bilayer distortions. This in turn may help to inform ongoing experimental and simulation studies of the more complex situation of a membrane-spanning voltage sensor domain (4,23,24,36,57,58).
In terms of methodology, we must address any CG bias in the derivation of our AT free-energy profiles. It has been shown that CG simulations underestimate the barrier of membrane insertion of a single protonated Arg side chain (15,39). Despite this, AT simulations, based on starting configurations predicted by CG simulations, showed little deviation in terms of helix orientation relative to the membrane (Supporting Material), and in terms of microscopic phenomena (i.e., membrane deformation and water penetration) that stabilized S4. Operating within the limitations of the CG force field, we have tested the robustness of the CG free-energy profiles to initial helix orientation, and we are confident that the CG simulations can sample relevant helix orientations.
It is also important to emphasize the need for a multiscale approach (59), as it would be difficult to obtain meaningful and converged free energies using AT simulations in isolation, without guidance from CG simulations. Such a methodological framework will become increasingly important in future simulation studies of membrane/protein systems. We have kept the basic residues of S4 protonated (i.e., charged) in our simulations. This assumption may not be unreasonable, as recent theoretical studies suggest that Arg remains protonated till the center of a membrane, where protonated and deprotonated forms are equally favorable (60). Of course, our simulations do not account for possible shielding of the S4 charges from the membrane by the remainder of the VS (61), as can be observed in recent crystal structures of Kv channels (6,7), which could further stabilize S4 in the membrane.
We also note that the choice of a suitable reaction coordinate is difficult for complex membrane systems. We selected a reaction pathway along the bilayer normal, as this was natural for investigating the membrane insertion of α-helices. We have also maintained the S4 peptide in an α-helical conformation. Thus, it should be emphasized that what we report are the PMFs for a folded S4 helix along a reaction coordinate corresponding to the COM of the helix moved along the bilayer normal, thus enabling comparison with a number of recent simulation studies of related, if somewhat simpler, TM helix systems (12,15,62). We are therefore not attempting to explore helix unfolding/refolding in the presence of a lipid bilayer, which has been studied for simple hydrophobic helices (see, e.g., Ulmschneider et al. (63)).
We show in Fig. S3 that the rotational degree of freedom of S4 was well sampled and can equilibrate over the timescale of each umbrella sampling simulation. In particular, when S4 was located in water, it rotated randomly. When S4 interacted with the membrane, there was a dominant orientation for the helix with respect to the membrane. As a further test (Fig. S6), we reestimated the CG PMF profile of KvAP S4 with a different initial orientation with respect to the membrane. This revealed a negligible change in the PMF profile. We also visually monitored helix conformation as a function of z. With S4 in water, side chains sampled a wider range of conformations compared to when S4 was in the membrane. When S4 was at z = 0 Å, the basic side chains snorkeled toward the solvent and side-chain conformations were more limited (Fig. S8). In the AT simulations, S4 remained helical and extended and did not unfold at all z values, even when in water. However, the timescale (10 ns) is limited, and so we must stress (as noted above) that the reaction coordinate is for the COM of an α-helix along the bilayer normal. We note that a recent study (63) of simple hydrophobic helices has demonstrated that rather more extended (duration ∼1 μs) AT simulations are needed if the reaction coordinate is to be extended to include folding/unfolding of a peptide as it partitions between water and the bilayer. In the CG simulations, S4 was more flexible when in water and kinked to a degree about F302. This kinking motion was well sampled in the CG simulations. S4 remained unkinked when in the membrane in the CG simulations. Taken together, we are confident that with our choice of reaction coordinate z, the nonsampled degrees of freedom can equilibrate and the PMF profiles have converged.
In conclusion, a recurring theme from simulations of S4 helices and of Arg side chains in lipid bilayers, both from this and previous (10,12,13,36) studies, is how the apparent plasticity of the membrane and the formation of water defects may play a role in accommodating charges within the membrane. This suggests that the membrane should be considered a structural extension of a membrane protein (10), and it correlates well with a number of studies demonstrating the sensitivity of Kv channel gating to changes in lipid environment (37,38,64,65). Thus, it is important that we reevaluate our understanding of the membrane stability of charge-containing TM fragments from a thermodynamic basis.
Acknowledgments
We thank the United Kingdom National Grid Service for computing time.
We thank Oliver Beckstein for many helpful discussions and Phillip Stansfeld for providing code for the CG-to-AT conversion. We also thank Martin Ulmschneider and Ranjit Vijayan. C.L.W. was funded by the Oxford Centre for Integrative Systems Biology. Alan Chetwynd is a Medical Research Council research student. Research in M.S.P.S.'s laboratory is funded by the Biotechnology and Biological Sciences Research Council and the Wellcome Trust.
Supporting Material
References
- 1.Nilsson J., Persson B., von Heijne G. Comparative analysis of amino acid distributions in integral membrane proteins from 107 genomes. Proteins. 2005;60:606–616. doi: 10.1002/prot.20583. [DOI] [PubMed] [Google Scholar]
- 2.Terstappen G.C., Reggiani A. In silico research in drug discovery. Trends Pharmacol. Sci. 2001;22:23–26. doi: 10.1016/s0165-6147(00)01584-4. [DOI] [PubMed] [Google Scholar]
- 3.Killian J.A., von Heijne G. How proteins adapt to a membrane-water interface. Trends Biochem. Sci. 2000;25:429–434. doi: 10.1016/s0968-0004(00)01626-1. [DOI] [PubMed] [Google Scholar]
- 4.Krepkiy D., Mihailescu M., Swartz K.J. Structure and hydration of membranes embedded with voltage-sensing domains. Nature. 2009;462:473–479. doi: 10.1038/nature08542. [DOI] [PMC free article] [PubMed] [Google Scholar]
- 5.Swartz K.J. Sensing voltage across lipid membranes. Nature. 2008;456:891–897. doi: 10.1038/nature07620. [DOI] [PMC free article] [PubMed] [Google Scholar]
- 6.Long S.B., Campbell E.B., Mackinnon R. Crystal structure of a mammalian voltage-dependent Shaker family K+ channel. Science. 2005;309:897–903. doi: 10.1126/science.1116269. [DOI] [PubMed] [Google Scholar]
- 7.Long S.B., Tao X., MacKinnon R. Atomic structure of a voltage-dependent K+ channel in a lipid membrane-like environment. Nature. 2007;450:376–382. doi: 10.1038/nature06265. [DOI] [PubMed] [Google Scholar]
- 8.Parsegian A. Energy of an ion crossing a low dielectric membrane: solutions to four relevant electrostatic problems. Nature. 1969;221:844–846. doi: 10.1038/221844a0. [DOI] [PubMed] [Google Scholar]
- 9.Hessa T., White S.H., von Heijne G. Membrane insertion of a potassium-channel voltage sensor. Science. 2005;307:1427. doi: 10.1126/science.1109176. [DOI] [PubMed] [Google Scholar]
- 10.Freites J.A., Tobias D.J., White S.H. Interface connections of a transmembrane voltage sensor. Proc. Natl. Acad. Sci. USA. 2005;102:15059–15064. doi: 10.1073/pnas.0507618102. [DOI] [PMC free article] [PubMed] [Google Scholar]
- 11.Allen T.W. Modeling charged protein side chains in lipid membranes. J. Gen. Physiol. 2007;130:237–240. doi: 10.1085/jgp.200709850. [DOI] [PMC free article] [PubMed] [Google Scholar]
- 12.Dorairaj S., Allen T.W. On the thermodynamic stability of a charged arginine side chain in a transmembrane helix. Proc. Natl. Acad. Sci. USA. 2007;104:4943–4948. doi: 10.1073/pnas.0610470104. [DOI] [PMC free article] [PubMed] [Google Scholar]
- 13.MacCallum J.L., Bennett W.F.D., Tieleman D.P. Distribution of amino acids in a lipid bilayer from computer simulations. Biophys. J. 2008;94:3393–3404. doi: 10.1529/biophysj.107.112805. [DOI] [PMC free article] [PubMed] [Google Scholar]
- 14.Ayton G.S., Noid W.G., Voth G.A. Multiscale modeling of biomolecular systems: in serial and in parallel. Curr. Opin. Struct. Biol. 2007;17:192–198. doi: 10.1016/j.sbi.2007.03.004. [DOI] [PubMed] [Google Scholar]
- 15.Bond P.J., Wee C.L., Sansom M.S.P. Coarse-grained molecular dynamics simulations of the energetics of helix insertion into a lipid bilayer. Biochemistry. 2008;47:11321–11331. doi: 10.1021/bi800642m. [DOI] [PubMed] [Google Scholar]
- 16.Marrink S.J., de Vries A.H., Mark A.E. Coarse grained model for semiquantitative lipid simulations. J. Phys. Chem. B. 2004;108:750–760. [Google Scholar]
- 17.Monticelli L., Kandasamy S.K., Marrink S.J. The MARTINI coarse grained force field: extension to proteins. J. Chem. Theory Comput. 2008;4:819–834. doi: 10.1021/ct700324x. [DOI] [PubMed] [Google Scholar]
- 18.Shih A.Y., Arkhipov A., Schulten K. Coarse grained protein-lipid model with application to lipoprotein particles. J. Phys. Chem. B. 2006;110:3674–3684. doi: 10.1021/jp0550816. [DOI] [PMC free article] [PubMed] [Google Scholar]
- 19.Shelley J.C., Shelley M.Y., Klein M.L. A coarse grain model for phospholipid simulations. J. Phys. Chem. B. 2001;105:4464–4470. [Google Scholar]
- 20.Izvekov S., Voth G.A. A multiscale coarse-graining method for biomolecular systems. J. Phys. Chem. B. 2005;109:2469–2473. doi: 10.1021/jp044629q. [DOI] [PubMed] [Google Scholar]
- 21.Tozzini V. Coarse-grained models for proteins. Curr. Opin. Struct. Biol. 2005;15:144–150. doi: 10.1016/j.sbi.2005.02.005. [DOI] [PubMed] [Google Scholar]
- 22.Wee C.L., Ulmschneider M.B., Sansom M.S.P. Membrane/toxin interaction energetics via serial multi-scale molecular dynamics simulations. J. Chem. Theory Comput. 2010;6:966–976. doi: 10.1021/ct900652s. [DOI] [PubMed] [Google Scholar]
- 23.Sands Z.A., Sansom M.S.P. How does a voltage sensor interact with a lipid bilayer? Simulations of a potassium channel domain. Structure. 2007;15:235–244. doi: 10.1016/j.str.2007.01.004. [DOI] [PMC free article] [PubMed] [Google Scholar]
- 24.Schow E.V., Freites J.A., Tobias D.J. Down-state model of the voltage-sensing domain of a potassium channel. Biophys. J. 2010;98:2857–2866. doi: 10.1016/j.bpj.2010.03.031. [DOI] [PMC free article] [PubMed] [Google Scholar]
- 25.Jiang Y., Lee A., MacKinnon R. X-ray structure of a voltage-dependent K+ channel. Nature. 2003;423:33–41. doi: 10.1038/nature01580. [DOI] [PubMed] [Google Scholar]
- 26.Sali A., Blundell T.L. Comparative protein modelling by satisfaction of spatial restraints. J. Mol. Biol. 1993;234:779–815. doi: 10.1006/jmbi.1993.1626. [DOI] [PubMed] [Google Scholar]
- 27.Sánchez R., Sali A. Comparative protein structure modeling. Introduction and practical examples with modeller. Methods Mol. Biol. 2000;143:97–129. doi: 10.1385/1-59259-368-2:97. [DOI] [PubMed] [Google Scholar]
- 28.van Gunsteren W.F., Kruger P., Tironi I.G. Biomos & Hochschulverlag AG an der ETH Zurich; Groningen, The Netherlands: 1996. Biomolecular Simulation: The GROMOS96 Manual and User Guide. [Google Scholar]
- 29.Berger O., Edholm O., Jähnig F. Molecular dynamics simulations of a fluid bilayer of dipalmitoylphosphatidylcholine at full hydration, constant pressure, and constant temperature. Biophys. J. 1997;72:2002–2013. doi: 10.1016/S0006-3495(97)78845-3. [DOI] [PMC free article] [PubMed] [Google Scholar]
- 30.Marrink S.J., Berger O., Jähnig F. Adhesion forces of lipids in a phospholipid membrane studied by molecular dynamics simulations. Biophys. J. 1998;74:931–943. doi: 10.1016/S0006-3495(98)74016-0. [DOI] [PMC free article] [PubMed] [Google Scholar]
- 31.Kumar S., Bouzida D., Rosenberg J.M. The weighted histogram analysis method for free-energy calculations on biomolecules. 1. The method. J. Comput. Chem. 1992;13:1011–1021. [Google Scholar]
- 32.Berendsen H.J.C., Postma J.P.M., Haak J.R. Molecular dynamics with coupling to an external bath. J. Chem. Phys. 1984;81:3684–3690. [Google Scholar]
- 33.Darden T., York D., Pedersen L. Particle mesh Ewald: an N.log(N) method for Ewald sums in large systems. J. Chem. Phys. 1993;98:10089–10092. [Google Scholar]
- 34.Hess B., Bekker H., Fraaije J.G.E.M. LINCS: A linear constraint solver for molecular simulations. J. Comput. Chem. 1997;18:1463–1472. [Google Scholar]
- 35.Miyamoto S., Kollman P.A. Settle: an analytical version of the Shake and Rattle algorithm for rigid water models. J. Comput. Chem. 1992;13:952–962. [Google Scholar]
- 36.Bond P.J., Sansom M.S.P. Bilayer deformation by the Kv channel voltage sensor domain revealed by self-assembly simulations. Proc. Natl. Acad. Sci. USA. 2007;104:2631–2636. doi: 10.1073/pnas.0606822104. [DOI] [PMC free article] [PubMed] [Google Scholar]
- 37.Schmidt D., Jiang Q.X., MacKinnon R. Phospholipids and the origin of cationic gating charges in voltage sensors. Nature. 2006;444:775–779. doi: 10.1038/nature05416. [DOI] [PubMed] [Google Scholar]
- 38.Xu Y., Ramu Y., Lu Z. Removal of phospho-head groups of membrane lipids immobilizes voltage sensors of K+ channels. Nature. 2008;451:826–829. doi: 10.1038/nature06618. [DOI] [PMC free article] [PubMed] [Google Scholar]
- 39.Vorobyov I., Li L., Allen T.W. Assessing atomistic and coarse-grained force fields for protein-lipid interactions: the formidable challenge of an ionizable side chain in a membrane. J. Phys. Chem. B. 2008;112:9588–9602. doi: 10.1021/jp711492h. [DOI] [PubMed] [Google Scholar]
- 40.Treptow W., Tarek M. Environment of the gating charges in the Kv1.2 Shaker potassium channel. Biophys. J. 2006;90:L64–L66. doi: 10.1529/biophysj.106.080754. [DOI] [PMC free article] [PubMed] [Google Scholar]
- 41.Jogini V., Roux B. Dynamics of the Kv1.2 voltage-gated K+ channel in a membrane environment. Biophys. J. 2007;93:3070–3082. doi: 10.1529/biophysj.107.112540. [DOI] [PMC free article] [PubMed] [Google Scholar]
- 42.Denning E.J., Woolf T.B. Double bilayers and transmembrane gradients: a molecular dynamics study of a highly charged peptide. Biophys. J. 2008;95:3161–3173. doi: 10.1529/biophysj.108.134049. [DOI] [PMC free article] [PubMed] [Google Scholar]
- 43.Treptow W., Marrink S.-J., Tarek M. Gating motions in voltage-gated potassium channels revealed by coarse-grained molecular dynamics simulations. J. Phys. Chem. B. 2008;112:3277–3282. doi: 10.1021/jp709675e. [DOI] [PubMed] [Google Scholar]
- 44.Hessa T., Kim H., von Heijne G. Recognition of transmembrane helices by the endoplasmic reticulum translocon. Nature. 2005;433:377–381. doi: 10.1038/nature03216. [DOI] [PubMed] [Google Scholar]
- 45.Enquist K., Fransson M., Nilsson I. Membrane-integration characteristics of two ABC transporters, CFTR and P-glycoprotein. J. Mol. Biol. 2009;387:1153–1164. doi: 10.1016/j.jmb.2009.02.035. [DOI] [PubMed] [Google Scholar]
- 46.Vostrikov V.V., Hall B.A., Sansom M.S. Changes in transmembrane helix alignment by arginine residues revealed by solid-state NMR experiments and coarse-grained MD simulations. J. Am. Chem. Soc. 2010;132:5803–5811. doi: 10.1021/ja100598e. [DOI] [PMC free article] [PubMed] [Google Scholar]
- 47.Fernández-Vidal, M., F. Castro-Roman, and S.H. White. 2006. Membrane insertion of a S4 potassium channel voltage sensor: an experimental study. 2006 Biophysical Society Meeting Abstracts. Biophys. J. Suppl. 20a. :1164–Pos.
- 48.Zhang L., Sato Y., Uozumi N. Contribution of hydrophobic and electrostatic interactions to the membrane integration of the Shaker K+ channel voltage sensor domain. Proc. Natl. Acad. Sci. USA. 2007;104:8263–8268. doi: 10.1073/pnas.0611007104. [DOI] [PMC free article] [PubMed] [Google Scholar]
- 49.White S.H., von Heijne G. How translocons select transmembrane helices. Annu. Rev. Biophys. 2008;37:23–42. doi: 10.1146/annurev.biophys.37.032807.125904. [DOI] [PubMed] [Google Scholar]
- 50.White S.H., Wimley W.C. Membrane protein folding and stability: physical principles. Annu. Rev. Biophys. Biomol. Struct. 1999;28:319–365. doi: 10.1146/annurev.biophys.28.1.319. [DOI] [PubMed] [Google Scholar]
- 51.Taylor J.W., Greenfield N.J., Privalov P.L. A calorimetric study of the folding-unfolding of an α-helix with covalently closed N and C-terminal loops. J. Mol. Biol. 1999;291:965–976. doi: 10.1006/jmbi.1999.3025. [DOI] [PubMed] [Google Scholar]
- 52.Gnanakaran S., García A.E. Helix-coil transition of alanine peptides in water: force field dependence on the folded and unfolded structures. Proteins. 2005;59:773–782. doi: 10.1002/prot.20439. [DOI] [PubMed] [Google Scholar]
- 53.Mattila K., Kinder R., Bechinger B. The alignment of a voltage-sensing peptide in dodecylphosphocholine micelles and in oriented lipid bilayers by nuclear magnetic resonance and molecular modeling. Biophys. J. 1999;77:2102–2113. doi: 10.1016/S0006-3495(99)77051-7. [DOI] [PMC free article] [PubMed] [Google Scholar]
- 54.Lee J., Im W. Transmembrane helix tilting: insights from calculating the potential of mean force. Phys. Rev. Lett. 2008;100:018103. doi: 10.1103/PhysRevLett.100.018103. [DOI] [PubMed] [Google Scholar]
- 55.Johansson A.C.V., Lindahl E. Protein contents in biological membranes can explain abnormal solvation of charged and polar residues. Proc. Natl. Acad. Sci. USA. 2009;106:15684–15689. doi: 10.1073/pnas.0905394106. [DOI] [PMC free article] [PubMed] [Google Scholar]
- 56.Nishizawa M., Nishizawa K. Molecular dynamics simulation of Kv channel voltage sensor helix in a lipid membrane with applied electric field. Biophys. J. 2008;95:1729–1744. doi: 10.1529/biophysj.108.130658. [DOI] [PMC free article] [PubMed] [Google Scholar]
- 57.Freites J.A., Tobias D.J., White S.H. A voltage-sensor water pore. Biophys. J. 2006;91:L90–L92. doi: 10.1529/biophysj.106.096065. [DOI] [PMC free article] [PubMed] [Google Scholar]
- 58.Ramsey I.S., Mokrab Y., Clapham D.E. An aqueous H+ permeation pathway in the voltage-gated proton channel Hv1. Nat. Struct. Mol. Biol. 2010;17:869–875. doi: 10.1038/nsmb.1826. [DOI] [PMC free article] [PubMed] [Google Scholar]
- 59.Chen H.N., Wu Y.J., Voth G.A. Proton transport behavior through the influenza A M2 channel: insights from molecular simulation. Biophys. J. 2007;93:3470–3479. doi: 10.1529/biophysj.107.105742. [DOI] [PMC free article] [PubMed] [Google Scholar]
- 60.Yoo J., Cui Q. Does arginine remain protonated in the lipid membrane? Insights from microscopic pKa calculations. Biophys. J. 2008;94:L61–L63. doi: 10.1529/biophysj.107.122945. [DOI] [PMC free article] [PubMed] [Google Scholar]
- 61.Treptow W., Tarek M., Klein M.L. Initial response of the potassium channel voltage sensor to a transmembrane potential. J. Am. Chem. Soc. 2009;131:2107–2109. doi: 10.1021/ja807330g. [DOI] [PMC free article] [PubMed] [Google Scholar]
- 62.Gkeka P., Sarkisov L. Interactions of phospholipid bilayers with several classes of amphiphilic α-helical peptides: insights from coarse-grained molecular dynamics simulations. J. Phys. Chem. B. 2010;114:826–839. doi: 10.1021/jp908320b. [DOI] [PubMed] [Google Scholar]
- 63.Ulmschneider M.B., Smith J.C., Ulmschneider J.P. Peptide partitioning properties from direct insertion studies. Biophys. J. 2010;98:L60–L62. doi: 10.1016/j.bpj.2010.03.043. [DOI] [PMC free article] [PubMed] [Google Scholar]
- 64.Schmidt D., MacKinnon R. Voltage-dependent K+ channel gating and voltage sensor toxin sensitivity depend on the mechanical state of the lipid membrane. Proc. Natl. Acad. Sci. USA. 2008;105:19276–19281. doi: 10.1073/pnas.0810187105. [DOI] [PMC free article] [PubMed] [Google Scholar]
- 65.Schmidt D., Cross S.R., MacKinnon R. A gating model for the archeal voltage-dependent K+ channel KvAP in DPhPC and POPE:POPG decane lipid bilayers. J. Mol. Biol. 2009;390:902–912. doi: 10.1016/j.jmb.2009.05.062. [DOI] [PMC free article] [PubMed] [Google Scholar]
Associated Data
This section collects any data citations, data availability statements, or supplementary materials included in this article.