

In this report, we describe the development of an approach that couples computation and experiment to allow the prediction of the affinity of RNA motif-ligand partners identified via two-dimensional combinatorial screening (2DCS).[1] This method, termed Structure-Activity Relationships Through Sequencing (StARTS), uses information from the sequences of the RNA motifs selected to bind a ligand. Sequences are statistically analyzed using the RNA Privileged Space Predictor (RNA-PSP) program to determine features (for example, 5′GC steps) in the selected sequences that occur with ≥95% confidence.[2] The confidence intervals are associated with a Z-score, with a larger value corresponding to a higher confidence level. Each selected RNA motif can have multiple significant features. Therefore, the sum of the Z-scores for all features is also computed. These data are then plotted against the measured binding affinities and can be fit to an inverse first order equation, which allow prediction of the affinity of the ligand for any RNA library member. StARTS has the potential to streamline the identification and scoring of both optimal and suboptimal RNA motif-ligand partners selected via 2DCS. Such information could prove useful in developing rational methods to target RNA with small molecules.
RNA represents an important target for small molecule intervention.[3] Potential targets in genomic sequence include mRNAs and non-coding RNAs such as untranslated regions in mRNAs (riboswitches or triplet repeats that cause disease), and pri- and pre-microRNAs.[4] Most of these potential targets, however, have not been exploited in part due to a fundamental lack of understanding of the types of chemical ligands that are specifically bound by RNA and the types of RNA motifs that are specifically bound by chemical ligands. A database of RNA motif-ligand partners and modular assembly strategies are being developed to fill this void.[1,5] These approaches have the potential to enable the rational design of small molecules targeting RNA. A major impediment in the development of a database of RNA motif-ligand partners via 2DCS is its annotation, including determining relative affinities of RNAs selected to bind a ligand.
In an attempt to streamline the annotation of the database, we identified the RNA motifs that bind 6′-N-5-hexynoate neamine (1, Figure 1a) using a microarray-based selection method [1] and then analyzed sequencing information from the selection to estimate the binding affinities of RNA motif-ligand partners. In this selection, 1 was immobilized onto azide-functionalized agarose microarrays via a Huisgen dipolar cycloaddition reaction (Figure 1a). Arrays containing serially-diluted loadings of 1 were probed for binding to a 32P-labeled 3×3 nucleotide internal loop library (2, Figure 1c) in the presence of excess competitor oligonucleotides (3-9, Figure 1c). The lowest loading spot of 1 that gave sufficient signal above background was excised from the microarray surface (Figure 1b). After amplification of this population of bound RNAs using biotinylated primers, the products were subjected to a modified ligation-based protocol to increase the information density in sequencing reactions.[6]
Figure 1.
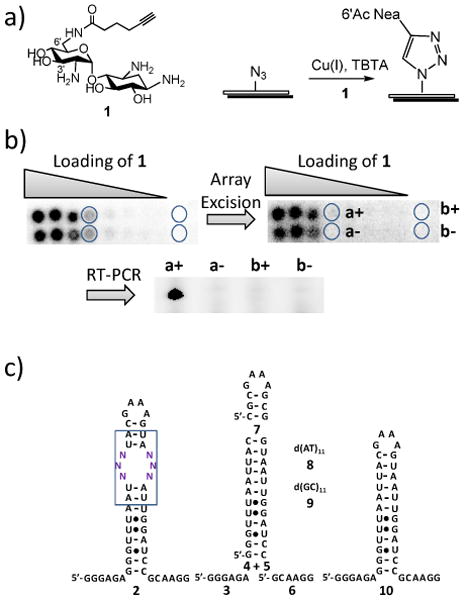
Schematic of the microarray-based selection protocol used to identify RNA motif-1 partners and the oligonucleotides used in this study. a) anchoring 1 onto azide-functionalized agarose microarrays. b) image of microarray displaying 1 after hybridization with 32P-labeled 2 in the presence of excess of competitor oligonucleotides (3-9) and a representative gel image after RT-PCR amplification of array harvested spots (circles). A “+”indicates that reverse transcriptase was added while a “–” indicates that it was absent. c) the 3×3 nucleotide internal loop library (2) and competitor oligonucleotides (3-9). 10 is the cassette used to display the 3×3 nucleotide internal loop library and was not used in a selection experiment.
The randomized regions from selected members of 2 were extracted from the sequencing data and statistically analyzed via RNA-PSP.[2] The output of RNA-PSP is Z-scores for each statistically significant feature in the selected RNAs. Figure 2 illustrates the output of the RNA-PSP analysis for one selected internal loop. Two of the most statistically significant features in the selected internal loops were 5′NAC/3′CGN and 5′NAN/3′CGC (Figure 2). It was then attempted to correlate the statistical analysis with the affinity of the selected RNA motif-1 partners. To do this, the affinities of 15 selected loops were determined as previously described using fluorescein-labeled 1 (1-Fl).[1] The loops and the measured affinities are shown in Figure 3. In addition to studying selected loops, binding affinity was also measured to the entire library, 2, the hairpin cassette into which the randomized region was embedded (10), and the mixture of structures selected to bind 1. Binding analysis shows that 1-Fl does not bind to 2 or to 10 (Kd's ≫3000 nM); however, the mixture of selected members binds tightly (Kd = 315 nM).
Figure 2.

Protocol that was used to determine the feature with the highest Z-score and the summed Z-score of all features using Nea6′AcIL1 as an example. The statistically significant features were determined by analyzing sequencing data via the RNA-PSP program.[2]
Figure 3.
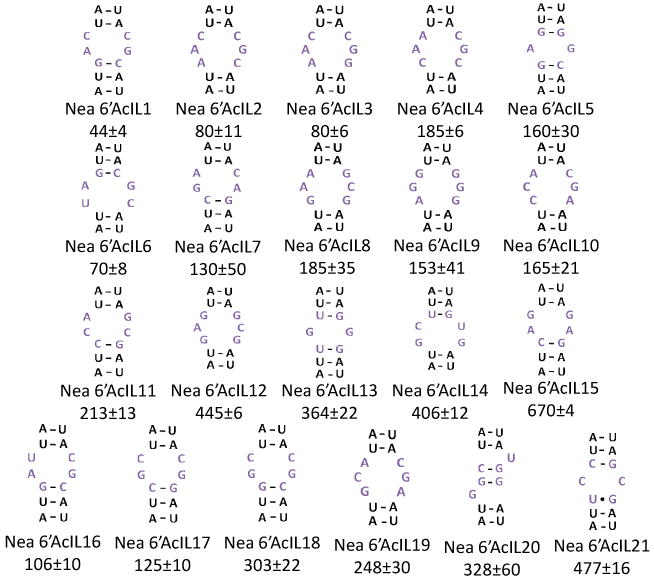
The secondary structures of the internal loops selected to bind 1; nucleotides shown are derived from the boxed region of 2 (Figure 1c). The top three rows correspond to sequences identified from sequencing data while the bottom row contains members of 2 not found in the original selection, but whose summed Z-scores correlate with affinity (Figure 4). The value below each loop is the Kd (nanomolar) of the RNA-1-Fl complex.
With these measured affinities in hand, two different methods were employed to attempt to correlate the output of RNA-PSP (Z-scores with ≥ 95% confidence) with measured binding affinities. Both methods assume that a statistically significant feature or set of features helps drive association of the RNA-ligand complex. Thus, in principle, a function could be constructed by defining a relationship between these features (Z-scores) and affinity. In the first method, the feature with the single highest Z-score for each loop was plotted as a function of the affinity of the RNA-ligand complex (Figure 4a).[7] There is no global correlation between affinity and a single Z-score. However, loops with the highest Z-score features did exhibit some of the highest affinities measured. In the second method, the sum of the Z-scores for all features displayed by a loop was computed (Figure 3), and those values were plotted as a function of affinity (Figure 4). Plots of these data showed a good correlation (R2=0.85; Figure 4b) when the data are fit to an inverse first-order equation:
Figure 4.

Correlating Z-scores to the affinity of the RNA motif-ligand interactions. a) plot of the highest individual Z-score feature for each loop as a function of affinity; there is no correlation between these data. b) plot of the sum of each Z-score for the selected RNA structures as a function of affinity; data correlate well when fit to a inverse-first order equation. The closed circles are RNA motifs that were identified from sequencing data. The open circles are RNA motifs that were not identified in the sequencing data but were randomly chosen. Their summed Z-scores were computed and their affinities to 1-Fl were measured.
| Eq (1) |
To test the ability of the Equation (1) to predict the affinity of RNA motif-1 interactions that were not found in sequencing data, six random RNAs that are members of 2 were chosen and tested for binding to 1-Fl. These RNAs have summed Z-scores ranging from 20 to 131. The affinities were then plotted as a function of their summed Z-score that was determined from the analysis of selected structures. Data for these RNAs are shown in Figure 4 as open circles. These data correlated well with the predictive model for affinity that was derived using only 15 selected interactions. Because of the success of this analysis, we modified RNA-PSP to compute summed Z-scores for each member of 2. This new program, RNA-PSP v. 2.0,[8] allows for rapid scoring of the fitness of each library member for a ligand.
In summary, by statistically analyzing features in RNAs that are selected to bind a ligand and measuring the affinities of a subset of the selected interactions, a scoring function to predict the affinity of RNA motif-ligand partners was developed. Since 2DCS [1] allows rapid probing of both chemical and RNA spaces to potentially identify large numbers of RNA motif-ligand partners, measuring the affinities of each selected interaction can be intractable. The combination of the computational and experimental approach (StARTS) described herein, however, will allow for the efficient annotation of a growing database of RNA-ligand interactions. Such studies have the potential to enable computational approaches to rationally and modularly design small molecules targeting RNAs present in genomic sequence.
Acknowledgments
Funding for this work was provided by the National Institutes of Health (RO1-GM079235). MDD is a Camille and Henry Dreyfus New Faculty Awardee, A Cottrell Scholar through the Research Corporation, and a J.D. Watson Young Investigator through NYSTAR.
Footnotes
Supporting information for this article is available on the WWW under http://www.angewandte.org or from the author.
References
- 1.Childs-Disney JL, Wu M, Pushechnikov A, Aminova O, Disney MD. ACS Chem Biol. 2007;2:745–754. doi: 10.1021/cb700174r. [DOI] [PubMed] [Google Scholar]; Disney MD, Labuda LP, Paul DJ, Poplawski SG, Pushechnikov A, Tran T, Velagapudi SP, Wu M, Childs-Disney JL. J Am Chem Soc. 2008;130:11185–11194. doi: 10.1021/ja803234t. [DOI] [PubMed] [Google Scholar]
- 2.Paul DJ, Seedhouse SJ, Disney MD. Nucleic Acids Res. 2009;37:5895–5907. doi: 10.1093/nar/gkp594. [DOI] [PMC free article] [PubMed] [Google Scholar]
- 3.Thomas JR, Hergenrother PJ. Chem Rev. 2008;108:1171–1224. doi: 10.1021/cr0681546. [DOI] [PubMed] [Google Scholar]
- 4.Blount KF, Breaker RR. Nat Biotechnol. 2006;24:1558–1564. doi: 10.1038/nbt1268. [DOI] [PubMed] [Google Scholar]; Jeyaseelan K, Herath WB, Armugam A. Expert Opin Ther Targets. 2007;11:1119–1129. doi: 10.1517/14728222.11.8.1119. [DOI] [PubMed] [Google Scholar]; Wheeler TM. Neurotherapeutics. 2008;5:592–600. doi: 10.1016/j.nurt.2008.08.001. [DOI] [PMC free article] [PubMed] [Google Scholar]
- 5.Lee MM, Pushechnikov A, Disney MD. ACS Chem Biol. 2009;4:345–355. doi: 10.1021/cb900025w. [DOI] [PMC free article] [PubMed] [Google Scholar]; Pushechnikov A, Lee MM, Childs-Disney JL, Sobczak K, French JM, Thornton CA, Disney MD. J Am Chem Soc. 2009;131:9767–9779. doi: 10.1021/ja9020149. [DOI] [PMC free article] [PubMed] [Google Scholar]
- 6.Childs-Disney JL, Disney MD. RNA. 2008;14:390–394. doi: 10.1261/rna.576908. [DOI] [PMC free article] [PubMed] [Google Scholar]; Each sequencing reaction contained multiple selected RNAs (∼3).
- 7.Analysis of each individual Z-score either the overall highest feature did not allow for the construction of an equation to correlated affinity with Z-scores. Details are in the Supporting Information.
- 8.Details of the RNA-PSP v. 2.0 given in the Supporting Information. The program will be available upon publication for free download at http://www.nsm.buffalo.edu/Research/rna/