In cancer surgery there is a great need for imaging techniques to enable fast, in situ and accurate characterization of tissue so as to optimize resection. Nowhere is this more critical than in tumors that arise from the brain parenchyma. Analytical tools such as microscopy and fluoroscopy, magnetic resonance imaging, and computed tomography have been increasingly applied to the detection and delineation of human cancerous tissue.[1] While each method significantly increases the ability to detect tumor and its relationship to surrounding healthy tissue, limited chemical information, low-sensitivity and the need for systemic administration of contrast agents are limitations. Mass spectrometry (MS) is a powerful analytical technique with the potential to play such a role in tumor detection and diagnosis by imaging the distribution of proteins, lipids and other specific compounds in tissue.[2,3] Amongst the MS imaging methods, the newer ambient ionization techniques allow the direct analysis of samples in the open atmosphere.[4] In particular, desorption electrospray ionization mass spectrometry (DESI-MS) has the advantages of little or no sample preparation, ease of implementation and high quality analytical data.[5] DESI-MS imaging has been shown to provide 3D images of lipid distributions in mouse brain[6], to provide images of antifungals in algae[7], and to distinguish between cancerous and non-cancerous canine bladder tissue samples using multiple marker lipids[2]. However, little work has been reported on human tissue, a notable exception being the observation of distinctive lipid markers associated with tumor and non-tumor regions in human liver adenocarcinoma tissue sections.[8] A well-defined tumor margin boundary correlated with histopathological examination. Related ambient ionization methods have been used for similar purposes including 3D tissue imaging[9] and for characterization of lipids in surgical smoke during animal surgery[10].
The World Health Organization (WHO) recognizes over 125 types of brain tumors according to histopathological evaluation, and classifies them according to cellular characteristics, and grades malignancy according to proliferation, cellular and nuclear morphology, vascularization, and a few biomarkers.[11] Gliomas are the most common human primary brain tumors, with astrocytomas comprising the most common subtype ranging in grade from WHO grade II to the most aggressive form glioblastoma (WHO grade IV). Currently, diagnosis and grading of gliomas relies primarily on neuropathological examination of a biopsy sample and characteristic cytogenetic aberrations.[12] However, the histopathological examination of frozen specimens for diagnosis or tumor boundary assessment during surgery is of limited utility in guiding surgical resection as it depends on expert evaluation of the tissue resected from locations of interest, significantly delaying surgical intervention. Surgical pathology based approaches therefore need to be complemented by improved intraoperative diagnosis of tumors and their margins without interfering with the surgical workflow. MS based molecular evaluation of tissue can rapidly provide extensive chemical information from biopsy samples, which could aid differentiation of brain tumors from healthy and functional brain.
Here, we report on the use of DESI-MS to analyze and characterize the lipid profiles of different grades of human astrocytomas. Lipids make up a major portion of brain tissue and altered levels of lipids in brain tissue are associated with several diseases.[13, 14] Specifically, altered lipid compositions as determined by classical extraction methods have been reported in human gliomas.[15] The lipid composition of a cell reflects its histological cell type, state of cellular growth, maturation and differentiation. Therefore, the lipid composition of tissues could provide valuable information in terms of disease diagnosis.[16] Herein, the sphingo and glycerophospholipid compositions of astrocytoma tumor samples were investigated, and distinct lipid profiles concordant with WHO grade were observed. These results show that differentiation of grade within this type of human brain cancer can be achieved by direct DESI-MS analysis of tissue with the lipid constituents providing the needed information.
Glioma specimens from seven human subjects were examined using DESI-MS in the negative and positive ion modes. Patients gave informed consent for tissue review in accordance with the Internal Review Board of Partners Healthcare, and tissue samples were handled in accordance with institutional guidelines. From the seven biopsy samples evaluated by an expert neuropathologist (K.L.), one was diagnosed as a diffuse astrocytoma (WHO grade II), two were diagnosed as anaplastic astrocytoma (WHO grade III), and four as glioblastoma (GBM) (WHO grade IV), from which three showed epidermal growth factor receptor (EGFR) amplification. Identical standard DESI-MS imaging conditions were used to analyze the tissue specimens, and serial sections were independently analyzed in a second laboratory, the results of which were in qualitative agreement with those reported herein (see the Supporting Information and Figure S4 for experimental details). Lipid assignments were confirmed by tandem mass spectrometry (MS/MS) experiments compared to existing ESI product-ion mass spectra in the literature. [17]
The major ions observed in the negative mode correspond to four main lipid classes; glycerophosphoinositols (PI), glycerophosphoserines (PS), plasmenyl glycerophospho ethanolamines (plasmenyl-PE), and sulfatides (ST). In the positive ion mode, the major ions observed correspond to three main lipid classes; glycerophosphocholines (PC), sphingomyelins (SM) and galactoceramides (GalCer). Each DESI-MS image represents the abundance of ions of one particular value of mass-to-charge ratio (m/z) and consequently shows the distribution of the corresponding molecule in the tissue sample.
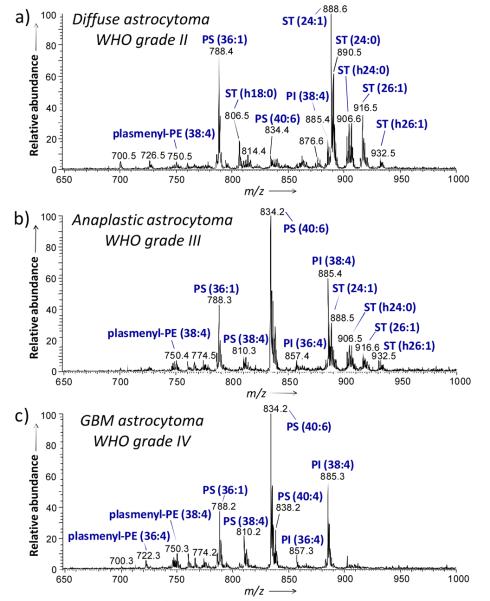
A representative mass spectrum (m/z 650 to 1000) of a tissue specimen collected from a subject diagnosed with diffuse astrocytoma (WHO grade II) is shown in Figure 1a. The major ions observed in the mass spectrum correspond to lipids of classes ST, PS and PI, and are identified as follows; m/z 788.2, PS(36:1); m/z 806.5, ST(h18:0); m/z 885.4, PI(38:4); m/z 888.6, ST(24:1); m/z 890.5, ST(24:0); m/z 904.6, ST(h24:1); m/z 906.6, ST(h24:0); and m/z 916.6, ST(26:1). Table S1, Supporting Information, lists the major peaks detected in the human glioma tissue in the negative ion mode. Figure 1c shows a representative negative ion mode mass spectrum obtained from sample G5, a case of grade IV astrocytoma (GBM). In contrast with the grade II tumor, the highest ion abundances detected in this higher grade of astrocytoma in the negative ion mode correspond to lipids of the classes PS, PI and plasmenyl-PE. The most abundant ions are identified as follows; m/z 750.3 plasmenyl-PE(38:4); m/z 788.2, PS(36:1); m/z 810.2, PS(38:4); m/z 812.2, PS(38:3); m/z 834.2, PS(40:6); m/z 836.2, PS(40:5); m/z 838.2; PS(40:4); m/z 885.3, PI(38:4); and m/z 887.3, PI(38:3). Negative ion mode mass spectra obtained for other GBM samples (G6, G7 and G8) are shown in Figure S1. The same lipid composition was observed for each of the samples of GBM, with the lipids PS(40:6), PI(38:4) and PS(36:1) giving the most abundant ions in all the samples analyzed. Note that the sulfatide ions observed for the diffuse astrocytoma are completely absent in the GBM tissues analyzed. While the lipid profiles observed for grade II and grade IV astrocytomas are distinct, the negative ion mode mass spectrum obtained from sample G4, a case of anaplastic astrocytoma (WHO grade III), Figure 1b, presents a transitional lipid composition, showing the presence of the sulfatide ions observed in the grade II sample, as well as an increased abundance of glycerophosphoserine peaks characteristic of the GBM lipid profile.
Figure 1.
Representative negative ion mode DESI spectra of human tumor tissues. a) Sample G2, diffuse astrocytoma (WHO grade II), b) sample G4, anaplastic astrocytoma (WHO grade III) and c) sample G5, glioblastoma (WHO grade IV). See text for lipid abbreviations.
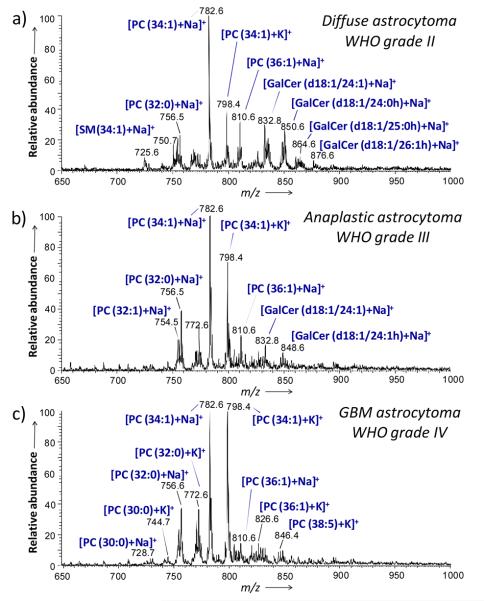
Similar trends in tissue lipid profiles with increasing malignancy were observed in the positive ion mode spectra. Figures 2 a, b and c show representative spectra obtained for the samples G2 (grade II), G4 (grade III), and G5 (GBM, grade IV), respectively. For the different grades of astrocytomas, the main positive ions observed are sodium and potassium adducts of glycerophosphocholines. The main ions observed are m/z 782.6, identified as PC(34:1)+Na+, m/z 798.4, identified as PC(34:1)+K+ and m/z 756.6, identified as PC(32:0)+Na+. However, a series of ions identified as galactoceramides was observed most abundantly in the positive mode spectrum for sample G2, grade II astrocytoma and in lower abundance in the spectrum obtained for sample G4, grade III astrocytoma. These galactoceramide ions are absent in the spectra obtained from all four glioblastoma samples (G5-G8) (Figure S2). Figure S3 shows the product ion spectrum generated from tandem MS experiments on m/z 850.6, identified as a sodium adduct of GalCer(d18:1/24:0h). The fragmentation pattern of this ion is consistent with the molecular structure and is consistent with reported literature.[18] Table S2, Supporting Information, summarizes the identification of the major peaks detected in the glioma samples in the positive ion mode. Technical reproducibility was assessed by analyzing different tissue sections of the same sample on different days under the same experimental conditions (Figure S5, Supporting Information).
Figure 2.
Representative positive ion mode DESI spectra of human tumor tissues. a) Sample G2, diffuse astrocytoma (WHO grade II), b) sample G4, anaplastic astrocytoma (WHO grade III) and c) sample G5, glioblastoma (WHO grade IV). See text for lipid abbreviations.
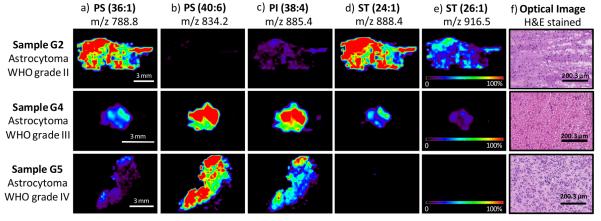
DESI-MS molecular images obtained for the main ions observed in the negative ion mode are shown in Figure 3 a-e for samples of grade II, III, and IV respectively. Standard histological hematoxylin and eosin (H&E) staining was performed on serial sections and corresponding optical images are shown in Figure 3f. The differences in lipid composition observed in the negative mode are clearly observed in the DESI-MS ion images obtained for the samples analyzed. Comparison between the ion images of the different samples clearly demonstrate the change in lipid composition as a function of the astrocytoma grade.
Figure 3.
Selected negative ion DESI-MS images from three of the different glioma samples analyzed, sample G2 (diffuse astrocytoma WHO grade II), sample G4 (anaplastic astrocytoma WHO grade III) and sample G5 (glioblastoma, astrocytom a WHO grade IV), showing the distribution of a) m/z 788.8 (PS 36:1), b) m/z 834.2 (PS 40:6), c) m/z 885.4 (PI 38:4), d) m/z 888.4 (ST 24:1), e) m/z 916.5 (ST 26:1). Optical images of the stained tissue sections are shown in f).
Our findings indicate that it is possible to establish three different lipid profiles corresponding to each degree of malignancy II, III, and IV in astrocytic tumors by negative and positive ion DESI-MS analysis although examination of a larger number of samples is needed to confirm these findings. Indeed, the concurrent change in lipid composition with astrocytoma grade observed with a combination of the negative and positive ion modes corroborates previous reports based on classical lipid extraction methodologies.[19] It has been observed that as the malignancy of astrocytomas increases, there is a decreased abundance of sulfatides and galactoceramides.[16] It has also been reported that while galactosylcerebrosides and sulfatides are absent from glioblastoma, they are present in astrocytomas grade II.[20] Since these distinctive lipids profiles are easily assessed using DESI-MS imaging, this technique has the potential to be utilized for differentiating human astrocytomas directly from tissue.
The approach reported here supports the feasibility of using lipid profiles for the differentiation of astrocytoma grades using DESI-MS. Moreover, the results are validated by previous reports on the characterization of lipids from gliomas, each involving initial lipid extraction followed by either HPLC or HPTLC separation.[16, 19, 20] A follow up biomarker discovery phase will require increasing the sample size to derive and validate classification models. Multiple sampling sites with varying tumor cell density would also contribute to minimizing the effect of a lack of true non-tumor controls inherent to the study of brain diseases. Because DESI-MS is an ambient technique with a characteristic ease and rapidity of execution, the approach might possibly translate to in situ analysis of gliomas to assist in intraoperative surgical decision making.
Supplementary Material
Footnotes
This work was supported by the U.S. National Institute of Health (Grant 1R21EB009459-01) to LSE, ALD and RGC, and by grants from the Brain Science Foundation, and the Daniel E. Ponton Fund for the Neurosciences to NYRA. Prosolia acknowledges support from the Indiana 21st Century Research and Technology Fund (JMW). We gratefully acknowledge the assistance of Kristen K. Gill for tissue banking at BWH and Jessica Li of Prosolia for assistance in DESI-MS experiments.
Supporting information for this article is available on the WWW under http://www.angewandte.org or from the author.
References
- 1.Black PM, Moriarty T, Alexander E, Stieg P, Woodard EJ, Gleason PL, Martin CH, Kikinis R, Schwartz RB, Jolesz FA. Neurosurgery. 1997;41:831. doi: 10.1097/00006123-199710000-00013. [DOI] [PubMed] [Google Scholar]; Cha S. Am. J. Neuroradiol. 2006;27:475. [PMC free article] [PubMed] [Google Scholar]; Upadhyay UM, Golby AJ. Expert Rev. Med. Devices. 2008;5:65. doi: 10.1586/17434440.5.1.65. [DOI] [PubMed] [Google Scholar]
- 2.Dill AL, Ifa DR, Manicke NE, Costa AB, Vara JAR, Knapp DW, Cooks RG. Anal. Chem. 2009;81:8758. doi: 10.1021/ac901028b. [DOI] [PMC free article] [PubMed] [Google Scholar]
- 3.Pacholski ML, Winograd N. Chem. Rev. 1999;99:2977. doi: 10.1021/cr980137w. [DOI] [PubMed] [Google Scholar]; Seeley EH, Caprioli RM. Proteom. Clin. Appl. 2008;2:1435. doi: 10.1002/prca.200800013. [DOI] [PubMed] [Google Scholar]
- 4.Nemes P, Vertes A. Anal. Chem. 2007;79:8098. doi: 10.1021/ac071181r. [DOI] [PubMed] [Google Scholar]; Shelley JT, Ray SJ, Hieftje GM. Anal. Chem. 2008;80:8308. doi: 10.1021/ac801594u. [DOI] [PubMed] [Google Scholar]; Venter A, Nefliu M, Cooks RG. Trac-Trends Anal. Chem. 2008;27:284. [Google Scholar]
- 5.Wiseman JM, Ifa DR, Venter A, Cooks RG. Nat. Protoc. 2008;3:517. doi: 10.1038/nprot.2008.11. [DOI] [PubMed] [Google Scholar]
- 6.Eberlin LS, Ifa DR, Wu C, Cooks RG. Angew. Chem. Int. Edit. 49:873. doi: 10.1002/anie.200906283. [DOI] [PMC free article] [PubMed] [Google Scholar]
- 7.Esquenazi E, Dorrestein PC, Gerwick WH. Proc. Natl. Acad. Sci. U. S. A. 2009;106:7269. doi: 10.1073/pnas.0902840106. [DOI] [PMC free article] [PubMed] [Google Scholar]
- 8.Wiseman JM, Puolitaival SM, Takats Z, Cooks RG, Caprioli RM. Angew. Chem. Int. Edit. 2005;44:7094. doi: 10.1002/anie.200502362. [DOI] [PubMed] [Google Scholar]
- 9.Nemes P, Barton AA, Vertes A. Anal. Chem. 2009;81:6668. doi: 10.1021/ac900745e. [DOI] [PubMed] [Google Scholar]
- 10.Schafer KC, Denes J, Albrecht K, Szaniszlo T, Balog J, Skoumal R, Katona M, Toth M, Balogh L, Takats Z. Angew. Chem. Int. Edit. 2009;48:8240. doi: 10.1002/anie.200902546. [DOI] [PubMed] [Google Scholar]
- 11.Louis DN, Ohgaki H, Wiestler OD, Cavenee WK. WHO Classification of Tumors of the Central Nervous System. WHO press; Lyon: [Google Scholar]
- 12.Wen PY, Kesari S. N. Engl. J. Med. 2008;359:492. doi: 10.1056/NEJMra0708126. [DOI] [PubMed] [Google Scholar]
- 13.Jackson SN, Wang HYJ, Woods AS. Anal. Chem. 2005;77:4523. doi: 10.1021/ac050276v. [DOI] [PubMed] [Google Scholar]
- 14.Podo F. NMR Biomed. 1999;12:413. doi: 10.1002/(sici)1099-1492(199911)12:7<413::aid-nbm587>3.0.co;2-u. [DOI] [PubMed] [Google Scholar]
- 15.Beljebbar A, Dukic S, Amharref N, Bellefqih S, Manfait M. Anal. Chem. 2009;81:9247. doi: 10.1021/ac901464v. [DOI] [PubMed] [Google Scholar]; Kohler M, Machill S, Salzer R, Krafft C. Anal. Bioanal. Chem. 2009;393:1513. doi: 10.1007/s00216-008-2592-9. [DOI] [PubMed] [Google Scholar]
- 16.Jennemann R, Rodden A, Bauer BL, Mennel HD, Wiegandt H. Cancer Res. 1990;50:7444. [PubMed] [Google Scholar]
- 17.Han XL, Cheng H. J. Lipid Res. 2005;46:163. doi: 10.1194/jlr.D400022-JLR200. [DOI] [PubMed] [Google Scholar]; Hsu FF, Turk J. J. Am. Soc. Mass Spectrom. 2001;12:1036. doi: 10.1016/S1044-0305(00)00194-X. [DOI] [PubMed] [Google Scholar]; Manicke NE, Wiseman JM, Ifa DR, Cooks RG. J. Am. Soc. Mass Spectrom. 2008;19:531. doi: 10.1016/j.jasms.2007.12.003. [DOI] [PubMed] [Google Scholar]
- 18.Cha SW, Yeung ES. Anal. Chem. 2007;79:2373. doi: 10.1021/ac062251h. [DOI] [PubMed] [Google Scholar]
- 19.Wagener R, Rohn G, Schillinger G, Schroder R, Kobbe B, Ernestus RI. Acta Neurochir. 1999;141:1339. doi: 10.1007/s007010050439. [DOI] [PubMed] [Google Scholar]
- 20.Jennemann R, Mennel HD, Bauer BL, Wiegandt H. Acta Neurochir. 1994;126:170. doi: 10.1007/BF01476429. [DOI] [PubMed] [Google Scholar]
Associated Data
This section collects any data citations, data availability statements, or supplementary materials included in this article.


