Abstract
Due to methodological difficulties related to the small size, variable distribution of hippocampal arteries, and the location of the hippocampus in the proximity of middle cranial fossa, little is known about hippocampal blood flow (HBF). We have tested the utility of a pulsed ASL sequence based on multi-shot TrueFISP to measure HBF in 34 normal volunteers (17 women, 17 men, 26-92 years old). Flow sensitivity to a mild hypercapnic challenge was also examined. Coregistered 3D MPRAGE sequence was used to eliminate from hippocampal and cortical regions of interest all voxel with <75% of gray matter. Large blood vessels were also excluded. HBF in normal volunteers averaged 61.2±9.0 ml/(100g min). There was no statistically significant age or gender effect. Under a mild hypercapnia challenge (end tidal CO2 pressure increase of 6.8±1.9 mg Hg over the baseline), HBF response was 14.1±10.8 ml/(100g min), whereas cortical gray matter flow increased by 18.0±12.2 ml/(100g min). Flow response among women was significantly larger than in the men. The average absolute difference between two successive HBF measures was 3.6 ml/(100g min), or 5.4%. The 3T TrueFISP ASL method offers a HBF measurement strategy that combines good spatial resolution, sensitivity, and minimal image distortions.
Keywords: MR imaging, methods, hippocampus, cerebral blood flow, brain perfusion, MR imaging, image analysis, aging
Introduction
Hippocampus, located in the medial temporal lobe, plays an essential role in the formation of new memories and is involved in general declarative memory function (1,2). Hippocampal dysfunction is well documented in Alzheimer’s disease, epilepsy, and other neurological disorders. Due to methodological difficulties related to the small size, variable distribution of hippocampal arteries, and the location of the hippocampus in the proximity of middle cranial fossa and large vessels, little is known about hippocampal blood flow. Hippocampal blood is supplied by branches of the posterior cerebral artery, the anterior choroidal artery, and by numerous internal hippocampal arterioles arising from both of these vessels (3). Pathology studies often demonstrate collateral circulation (3). Accurate measurement must account for “through-flow” error caused by blood vessels, such as posterior communicating artery, part of the circle of Willis, located along the medial border of the hippocampus. These vessels may pass through the region but deliver blood to a capillary bed located elsewhere.
Since the first measurement of total cerebral blood flow (CBF) by Kety and Schmidt in 1948 (4), many regional techniques have been developed. The positron emission tomography (PET) method using Oxygen-15 (O-15) labeled water enabled perfusion imaging of the deep gray structures (5-7). In spite of its high costs and limited availability, O-15 PET is still considered the gold standard method for CBF assessment. However, due to the limited spatial resolution and low SNR of CBF estimates in small brain structures (8), PET provides an inadequate measure of hippocampal perfusion.
MRI-based perfusion imaging can be performed using arterial spin labeling (ASL), a noninvasive technique that uses magnetically labeled arterial blood water as a diffusible tracer. The most extensively used data readout technique for ASL is echo-planar imaging (EPI). EPI is extremely sensitive to magnetic field artifacts caused by susceptibility differences across brainair or brain-bone transitions. These artifacts, more pronounced at 3T than at 1.5T field strength, preclude application of EPI sequence in the hippocampus. To overcome image distortions, Fernandez-Seara et al (9) recently optimized an ASL sequence based on single shot 3D GREASE and demonstrated its utility to image the hippocampus at an isotropic 4 × 4 × 4 mm3 resolution. True fast imaging in steady precession (TrueFISP) is another sequence with reduced sensitivity to susceptibility artifacts. Pulsed ASL sequence based on single-shot TrueFISP has been used successfully to measure perfusion in the brain (10) and other organs (11-13).
This study validates a new procedure to measure hippocampal CBF. Rather than using QUIPSS approach to reduce ASL sensitivity to vascular signal, we acquire segmented TrueFISP combined with conventional FAIR spin labeling (14). Resulting ASL data are acquired at spatial resolution that is sufficient to resolve and remove the signal from large blood vessels. While FAIR scheme inverts arterial spins close to the slice of interests (a 1-2 cm gap is inserted to separate the slice from the labeling region), it is associated with residual error most likely due to imperfect inversion profiles. Our technique uses ASL signal in the white matter to compensate for such error. We also restrict hippocampal region to the gray matter, estimated from the coregistered T1-weighted sequence.
There are three parts to our study. We report on reproducibility and effect of the head motion on CBF estimates. We then provide values of hippocampal and cortical blood flow measured across the human life span. Since our procedures (the use of white matter as a reference region, vessel removal) could potentially reduce the sensitivity to true CBF changes, we also examined perfusion measurements under a mild hypercapnic challenge.
Methods
Subjects
A total of 34 healthy volunteers consented and participated in this IRB approved study. Subjects included 17 women, aged 54.8±19.6 yrs (mean ± standard deviation), range 26-83; and 17 men aged 54.5±19.7, range 26-92. There was no significant age difference between the two genders: p=0.48, t-Stat=0.0524, df=32. Excluded were individuals with a history of alcoholism, drug abuse, medical (diabetes, evidence of vascular disease), neurological or psychiatric illness. All subjects were free of overt brain pathology such as tumor, stroke, hydrocephalus or significant trauma. All subjects older than 55 (N=18) received a complete battery of medical, neurological, psychiatric and neuropsychological assessment and were within normal limits of the Global Deterioration Scale (GDS) (15). In subjects below the age of 55, the diagnosis of normalcy was based on clinical interview.
MRI protocol
All studies were performed on a 3-T Siemens TIM Trio unit equipped with high performance gradients (45 mT/m maximum strength, 200 mT/m/ms slew rate). A 12-element head coil receiver and a body coil were used. The patient’s head was positioned using foam pads located under the head and clamped around the ears to reduce the head movement. The protocol consisted of a high-resolution structural T1-weighted acquisition (MPRAGE), followed by 2D ASL acquisition in the axial plane through the long axis of both hippocampi.
Using the MPRAGE acquisition and the graphical localization software available on the MR console, the operator and the study neurologist determined the plane for the ASL exam (Fig.1). The procedure consisted of: (a) selection of the sagittal slice through the longitudinal axis of the right hippocampus, (b) drawing on this slice a line segment H-H’ through the long axis of the right hippocampus, and (c) adjusting the plane by rotating it about the H-H’ axis to better encompass the left hippocampus.
Figure 1.
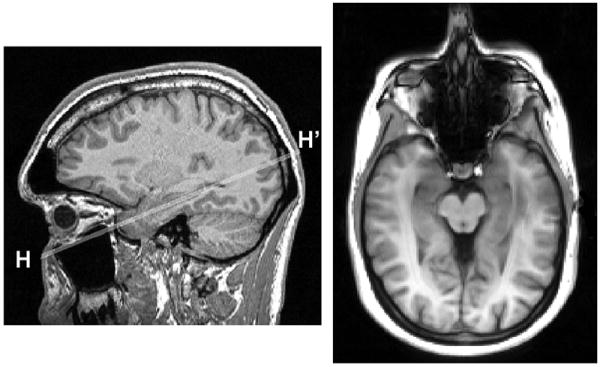
Slice positioning for hippocampal ASL. Left: longitudinal axis H-H’ of the right hippocampus is selected on a sagittal MPRAGE view. Right: resulting ASL axial imaging plane.
Imaging parameters for the MPRAGE sequence were: TR/TE/TI=2300/2.8/1100ms, FA=9°, bandwidth = 220 Hz/pixel, matrix 240 (antero-posterior direction) × 256 (cranio-caudal) × 208 (left-right), FOV= 24 × 25.6 × 20.8 cm, voxel size = 1 × 1 × 1 mm3, NEX=1, 9 min acquisition time).
The pulsed ASL sequence combined FAIR spin labeling with a segmented 2D TrueFISP readout, described in a separate publication (14). In the FAIR preparation, slice-selective and slice-nonselective inversion RF pulses were applied to generate tagged and untagged images of a 6 mm thick slice. The inversion time (TI) was 1200 ms, the RF pulse duration was 10.2 ms, and the recovery time between labeling pulses was 3 s. The slice thickness of the applied FOCI pulse was 15 mm. A spoiler 8 mT/m gradient of 9 ms duration was applied during the slice selective inversion pulses. TrueFISP steady state precession readout was based on interleaved acquisition of 3 segments of the k-space at the rate of 53 lines (217.3 ms) per segment. TrueFISP sequence parameters were: TR/TE/TI=3.4/1.7/1200 ms, FA = 50°, bandwidth = 975 Hz/pixel, 256 × 168 matrix, 30 × 19.7 cm FOV, voxel size = 1.2 × 1.2 × 6 mm3, NEX = 8. It took 2:10 minutes to acquire the tagged and untagged image pair.
The entire ASL sequence was then repeated using the inversion delay TIshort =110 ms, with all remaining parameters being the same as for TI=1200 ms acquisition. The goal was to provide an estimate the signal difference (labeled-control) when minimal perfusion effects were expected (see below). Finally, a steady state TrueFISP sequence was acquired without the FAIR pulse and with NEX=4 to estimate the equilibrium magnetization M0. The total acquisition time was 5:25 min per slice: 2:10 min at TI=1200ms, 2:10 min at TI=110 ms, and 1:05 min to acquire the steady state image.
Computation of CBF
For each exam, hippocampal, neocortical, and deep white matter regions of interest (ROI) were drawn on the ASL images. CBF was computed using the “standard model” approximation (16):
| [1] |
where ΔM is the adjusted (see below) difference between tagged and untagged signal, λ is the blood-tissue water partition coefficient (assumed 0.9 ml/g), σ is the inversion efficiency, TI is the inversion delay (1200 ms), and M0 is the equilibrium magnetization. M0 was estimated from the steady state TrueFISP sequence (17). We have used T1 of the arterial blood at 3T, reported in (18) as 1930 ms, to approximate tissue T1 in the above equation.
Compensation for imperfect inversion profile – short TI method
A prerequisite for accurate ASL measurement is that in the absence of flow, the signal strengths M2 of tagged and M1 of untagged image be identical. This requirement is difficult to achieve because of imperfect inversion profile associated with FAIR scheme. Two different ways for adjusting ΔM were tested. Our first calibration method (short TI method) assumes that no flow-related tagging is reflected in the signal difference ΔMshort measured at TIshort:
| [2] |
The exponential term is used to reflect the decay of magnetization between TIshort and TI of the main ASL acquisition.
Compensation for imperfect inversion profile – white matter method
For our second calibration technique (white matter method) we assumed that the perfusion rate of cerebral white matter is consistently low, approximately 3-4 times lower than cortical flow (5,19,20). Thus, the signal difference measured in white matter at TI=1200ms can be used to correct CBF in more perfused gray matter regions:
| [3] |
The term ΔMWM denotes the difference between tagged and untagged signal in white matter ROI. Based on prior studies, we assumed the nominal value of 25 ml/(100g min) for white matter flow FWavg (5,19,20). We have also investigated how this assumption affects CBF measurement in gray matter regions by simulating systematic error in FWavg and error in vascular transit time.
CBF response to mild hypercapnia
For measurement of CBF response during mild hypercapnia, ASL measurements were repeated using a noninvasive partial rebreathing technique. Subjects were fitted with a mouthpiece, nose clip, and a respiratory tube (Fig.2). The expired air was sampled continuously by an infra-red capnometer via a 3 m long cannula attached to the mouthpiece. To reduce the variability in hypercapnia level achieved during partial rebreathing, the length of rebreathing tube was individually adjusted in a training session that took place before each exam. Tube length was selected to raise end-tidal CO2 (ETCO2) by 7 mm Hg over the baseline level. The training session also served to familiarize each subject with the protocol and to reduce their level of anxiety. Heart rate, respiratory rate and blood oxygen saturation were monitored continuously during the ASL exam. When computing CBF under hypercapnia challenge, the calibration described in eq.[3] was based on the baseline acquisition, i.e. the nominal value for white matter flow was no longer assumed.
Figure 2.
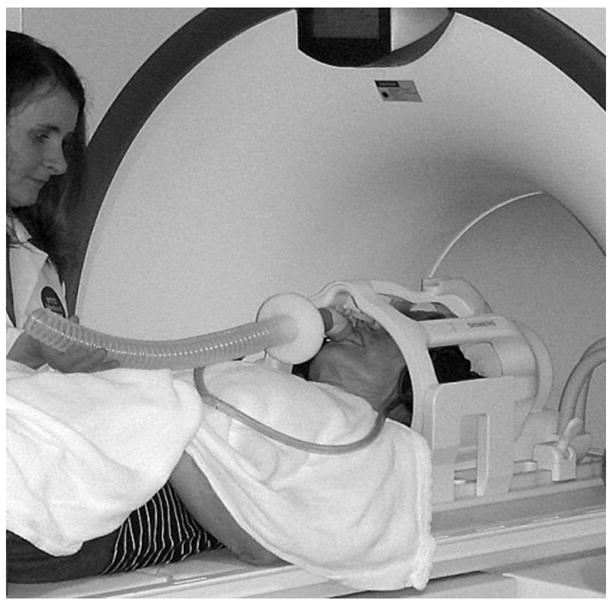
Nose clip, mouthpiece, and respiratory tube used in generating a mild hypercapnia challenge.
Measurement of hippocampal volume
The hippocampus was traced on coronally-reformatted MPRAGE images using anatomical rules (21,22) that have been validated at postmortem (23) and are in use in several other laboratories (24,25). Tracing begins anteriorly at the interface of hippocampus with the amygdala that is identified from sagittal views, and end posteriorly at the anterior crus of ascending fimbriafornix. The superior/lateral border is defined by the alveus and temporal horn. The medial border abuts the ambient cistern. The uncal sulcus separates the inferior surface of the hippocampal head from the subiculum of the parahippocampal gyrus. Near its posterior, the smaller hippocampal body is bounded on its medial side by the transverse fissure of Bichat and on the inferior side by the white matter of the parahippocampal gyrus. The surrounding cortical structure of the subiculum is included in the hippocampal volume, as the hippocampussubiculum demarcation cannot be reliably traced. The hippocampal volume was obtained by multiplying the number of voxels by the known voxel volume, and summed across slices. We have also expressed the hippocampal volume as the fraction of the intracranial supratentorial volume (traced at the dural and tentorial margins) in order to correct for variable brain size (prior to atrophy).
Cortical and hippocampal ROIs
High resolution 1 × 1 × 1 mm3 MPRAGE volumes were segmented into the gray matter, white matter, and cerebrospinal fluid by applying the SPM2 voxel-based morphometry algorithm (26,27). The segmented images indicate the tissue fraction of gray or white matter per voxel. As a second step, ROIs for the hippocampus, deep periventricular white matter, and cerebral cortex were drawn on the TrueFISP image. The image was then coregistered with the MPRAGE volume using a rigid body transformation computed from the values in “Image Orientation Patient” and “Image Position Patient” DICOM tags of these two sequences. Each voxel of each ROI was then examined in relation to its SPM2-derived gray matter and white matter density. If the hippocampal or a cortical voxel was found to contain <75% of gray matter, the voxel was deleted. Similarly, voxels in white matter ROIs were eliminated when found to contain <75% of white matter. Furthermore, all brain voxels with CBF exceeding 150 ml/100g min were deemed to contain large blood vessels and were excluded from ROIs.
To examine inter- and intra-observer reproducibility, two individuals generated the hippocampus ROI. The first observer was a neurologist with 6 years experience in research on brain aging. The second, an undergraduate student with no prior exposure to brain anatomy or MRI, was given a 20 min tutorial on hippocampus anatomy and was shown 3 sample ROIs. After this brief tutorial, ROIs were drawn blind to each other. The second observer repeated the ROI drawings after 2 months, blind to the first drawings. Observers used locally developed software that provides the user with an electronic paintbrush and eraser tools. The manual segmentation of the hippocampus took on the average 15 sec.
The effect of head motion
As head movement cannot be completely eliminated or post-corrected, appropriate procedures should be taken to remove from consideration images contaminated with large head movements during the scan. For this reason we assessed the head motion for each ASL exam. We also experimentally assessed the effect of head motion on CBF reproducibility. Head motion was monitored during the scan using built-in MRI video camera system and retrospectively quantified in each volunteer by measuring the signal intensity H outside the head. For segmented k-space acquisition, head motion causes ghosting features that can be estimated from the image area located outside the head. We have automatically constructed the fringe area (yellow region in Fig. 3) defined as a 12 mm wide ring separated by 5 mm from the scalp. TrueFISP signal in the fringe area (after normalization to the signal in the white matter) yielded the head motion index H. It should be noted that H is only sensitive to within-plane head motion.
Figure 3.
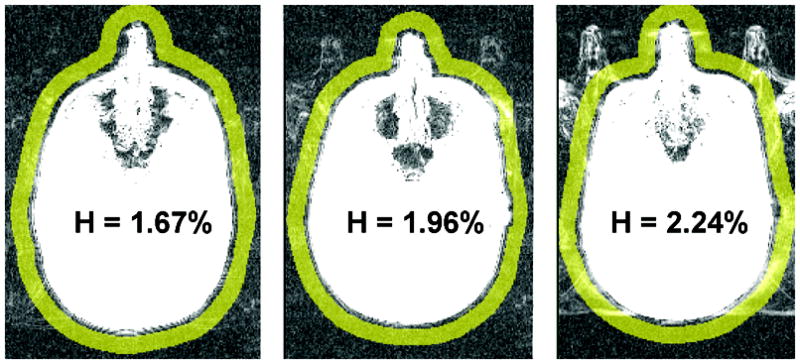
Fringe area (in yellow) used to assess the head motion. Shown are three exams, representing different magnitudes of the head motion index H. H is normalized to the signal in the white matter.
ASL reproducibility and stability tests
The precision of hippocampal CBF was estimated by repeating the measurements on a sample of 13 volunteers. After completing the first acquisition, these subjects were removed from the magnet for 5 minutes, then returned to the magnet and reexamined with a second ASL procedure. Single measure intraclass correlation analysis was used to compare the two CBF estimates.
To assess the stability of the CBF measurement for the relatively small hippocampus, we have computed the hippocampal CBF and compared it to the value obtained after applying a morphological erosion operator that shrinks the hippocampal ROI by 1 layer of voxels. Linear regression analysis was used to examine the influence of age and gender on CBF and volume of the hippocampus.
Results
Reproducibility
Using “short TI” technique, the average absolute difference between two successive CBF measures in the hippocampi was 5.1 ml/(100g min), or 9.8% and intraclass correlation coefficient (ICC) was 0.78. Improved reproducibility was obtained using “white matter” calibration technique, with absolute difference averaging 3.6 ml/(100g min) (5.4%) and ICC = 0.90 (Fig.4). Similarly, the reproducibility in the cortical gray matter was 7.6 ml/(100g min) (12.6%), ICC=0.71, for the short TI method and 6.2 ml/(100g min) (8.8%) ICC=0.86 for the white matter technique. Because of its increased precision, the latter technique was used in all results reported below.
Figure 4.
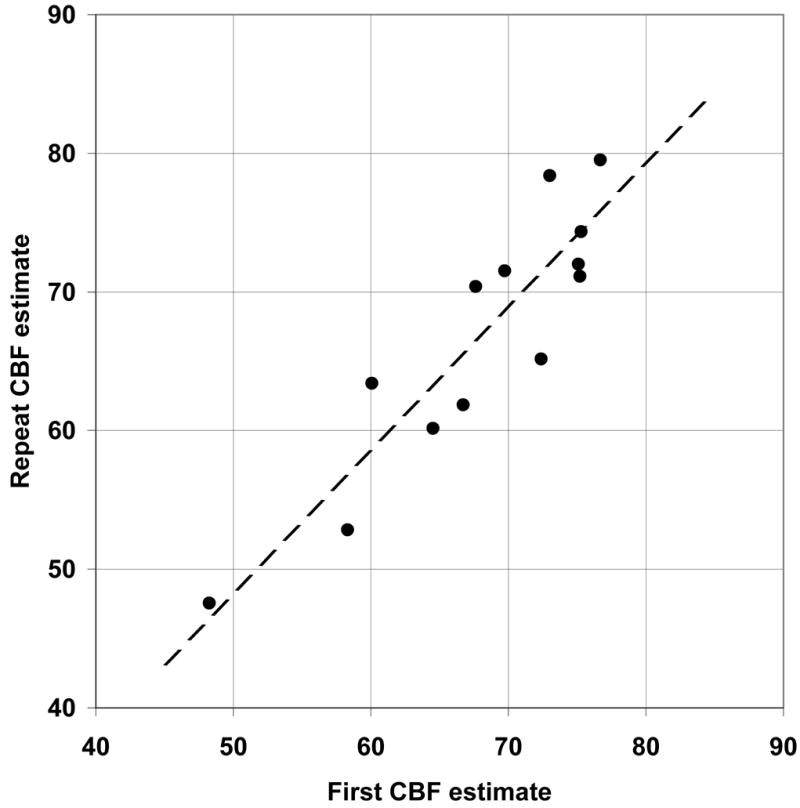
Reproducibility of CBF was estimated by repeating ASL measurement in 13 volunteers. For hippocampal CBF and the “white matter” calibration (see Methods for details), the absolute difference between the two measurements averaged 3.6 ml/(100g min) (5.4%) and their intra-class correlation was 0.90. The equation of the regression (dotted line) relating the second CBF2 and the first CBF1 estimate of hippocampal flow rate was: CBF2 = 1.03*CBF1 − 3.13.
Resting flow versus age and gender
The hippocampal blood flow averaged 61.2 ± 9.0 ml/(100g min). There was no statistically significant age or gender effect (Fig.5, left panel). The global cortical flow averaged 57.2±10.4 ml/100g min and there was a significant linear relationship with age (Fig.5, right): CBF”= -0.18*age+67.3, p=0.04. Resting cortical CBF in 12 subjects < 45 years old was 64.2 ± 10.0 ml/(100g min), with coefficient of variability (CV) of 16%, which was larger than the corresponding CV of 12.7% in the hippocampus. There was no gender effect for resting cortical CBF.
Figure 5.
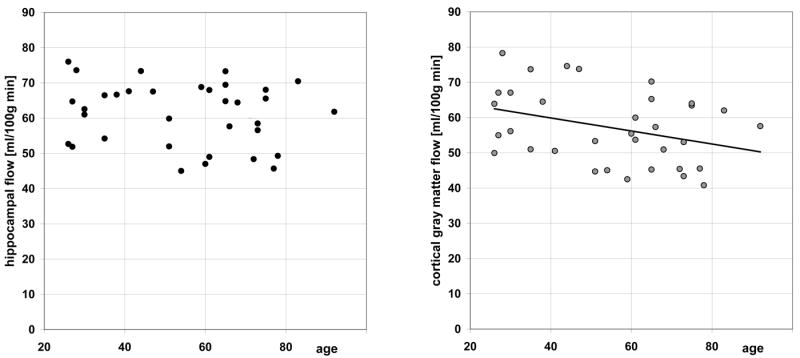
Hippocampal flow (left) and cortical flow (right) versus age.
Resting flow and ETCO2
Figure 6 plots the relationship between resting CBF and corresponding ETCO2. In four subjects ETCO2 could not be reliably recorded. There was a significant positive association between CO2 and cortical gray matter CBF (regression line: CBF = 1.23*ETCO2+8.9, p=0.03) and a trend for increased hippocampal flow with increasing CO2 level (regression line: CBF = 0.96*ETCO2+23.0, p=0.07).
Figure 6.
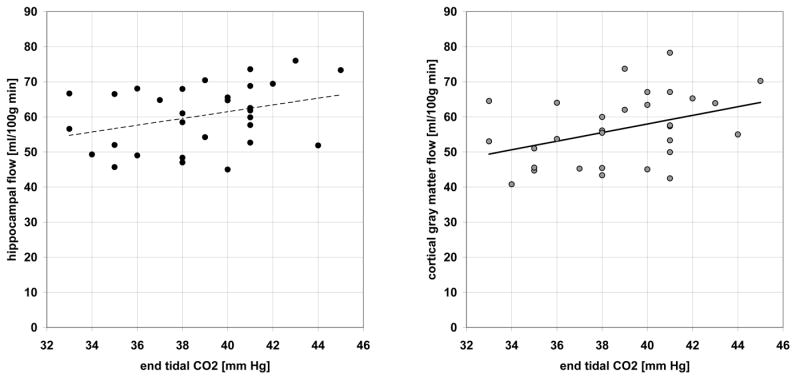
The effect of end tidal CO2 pressure on resting hippocampal (left) and cortical (right) blood flow.
Flow response to a mild hypercapnia challenge
For each patient a steady-state level of ETCO2 was achieved within about 30 seconds after breathing through the tube. Partial rebreathing yielded ETCO2 increase of 6.8±1.9 mg Hg over the baseline level. There was no aging or gender effect on ETCO2 change (females: 6.7±1.8 mg Hg, males 6.9±1.9 mg Hg). Hypercapnia resulted in a significant CBF increase in all brain tissue (Fig.7). Cortical gray matter response of 18.0±12.2 ml/(100g min) was larger than hippocampal blood flow response of 14.1±10.8 ml/(100g min). Both hippocampus and neocortex responses were larger than 5.4±7.8 ml/(100g min) change observed in the white matter. There was no association between age and CBF response to CO2 challenge. However, the cortical flow increase among the women was significantly larger than in the males (t-test, t=1.67, p=0.05) and there was a statistical trend for larger response in female white matter (t=1.39, p=0.09). No gender effect was observed in the hippocampal response to mild hypercapnia.
Figure 7.
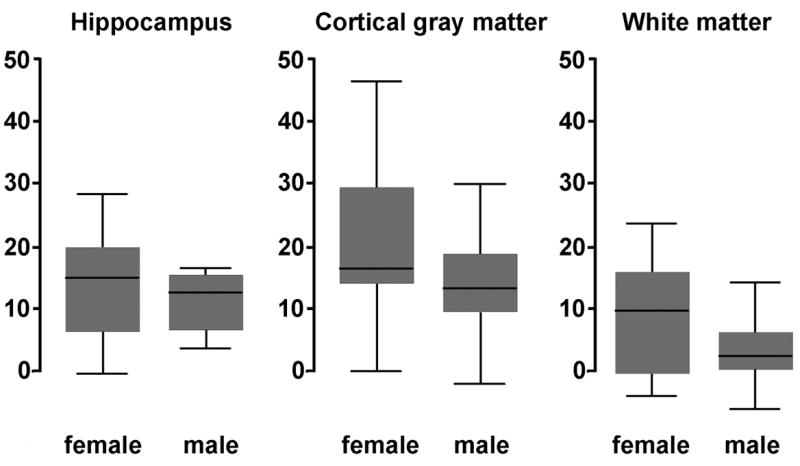
Flow response to mild hypercapnia challenge was greater in female than in male volunteers. Plotted is the change in CBF in ml/(100g min). The horizontal line indicates the median value, the box represent two middle quartiles, and the whiskers the range.
Figure 8 shows tagged TrueFISP and flow images in three normal volunteers representing the adult lifespan. General structural atrophic changes due to aging are readily apparent. For all cases, hippocampal anatomy and large vessels along the medial surface of the hippocampus are clearly depicted.
Figure 8.
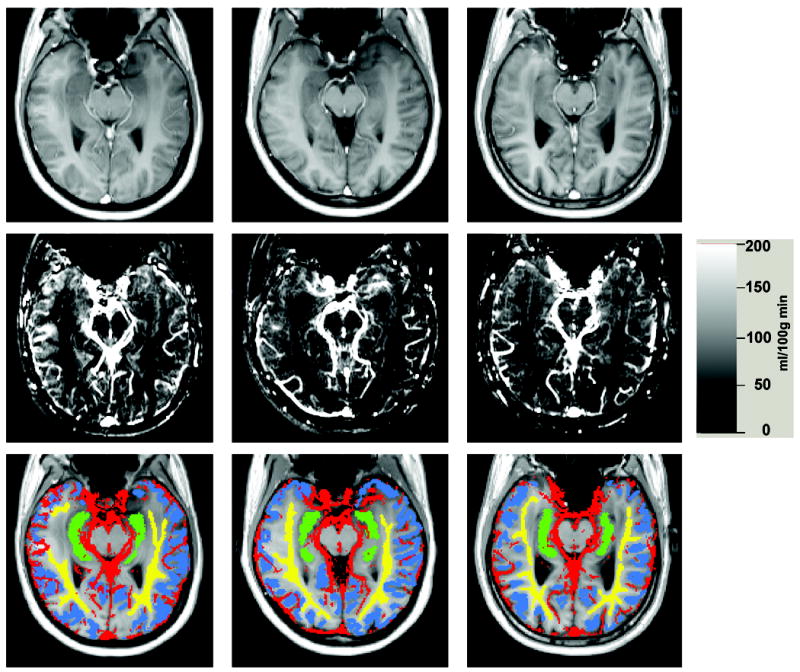
Left column: 30 year old woman, middle column: 51 year old woman, right column: 68 year old man. Top row: tagged TrueFISP images. Middle row: CBF images. Bottom row: tissue ROIs used in this study: yellow=white matter ROI, blue = cortical gray matter ROI, green=hippocampal ROI, red=vascular ROI.
Head motion, signal/noise, and ROI reproducibility
Head motion index H (Fig.3) was not correlated with either age (R=0.14, p=0.46), gender (t-test, t=0.26, p=0.79), cortical CBF (R=0.06, p=0.078) or hippocampal gray matter CBF (R=0.21, p=0.30). In the sample of 13 subjects with two CBF examinations, H was associated with the absolute difference between two successive CBF measures for the cortex (R=0.57, p=0.04) but not for the hippocampus (R=0.20, p=0.51).
Across all subjects, the difference between the original and the eroded hippocampal ROI averaged only 2.4%±2.1%, suggesting sufficient signal/noise.
The mean absolute discrepancy between hippocampal CBF using the same data but different observers was 2.8 ± 2.4 ml/(100g min) and ICC was 0.93. Intra-observer discrepancy was 2.4 ± 1.9 ml/(100g min), ICC=0.95.
Hippocampal volume
There were significant age-related (p=0.006) and gender (p=0.007) effects on the full hippocampal volume (computed from the high-resolution 3D MPRAGE sequence). The linear regression equation for hippocampal volume (ml) was 6.1 - 0.017 *age. The age, but not the gender, remained a significant contributor when hippocampal volume was measured relative to intra-cranial cavity volume. There was no correlation between the hippocampal volume and the CBF.
Volumes of hippocampal ROI on ASL image were smaller than volumes measured on 3D MPRAGE. The distribution of ratios (ASL ROI volume)/(MPRAGE-derived volume) was 0.742 ± 0.078.
The effect of error in assumed mean white matter flow
Figure 9 demonstrates the effect of systematic error in assumed value of FWavg and error in transit time. Even in a low gray matter perfusion scenario (50 ml/100g min), a ±20% FWavg error results in a modest ±10% gray matter error. The error corresponding to unknown discrepancy ΔtWM - ΔtHIP between vascular transit time for the white matter and for the hippocampus is also less than 10%, (Fig.9B) provided time delay discrepancy is less than 200 ms.
Figure 9.
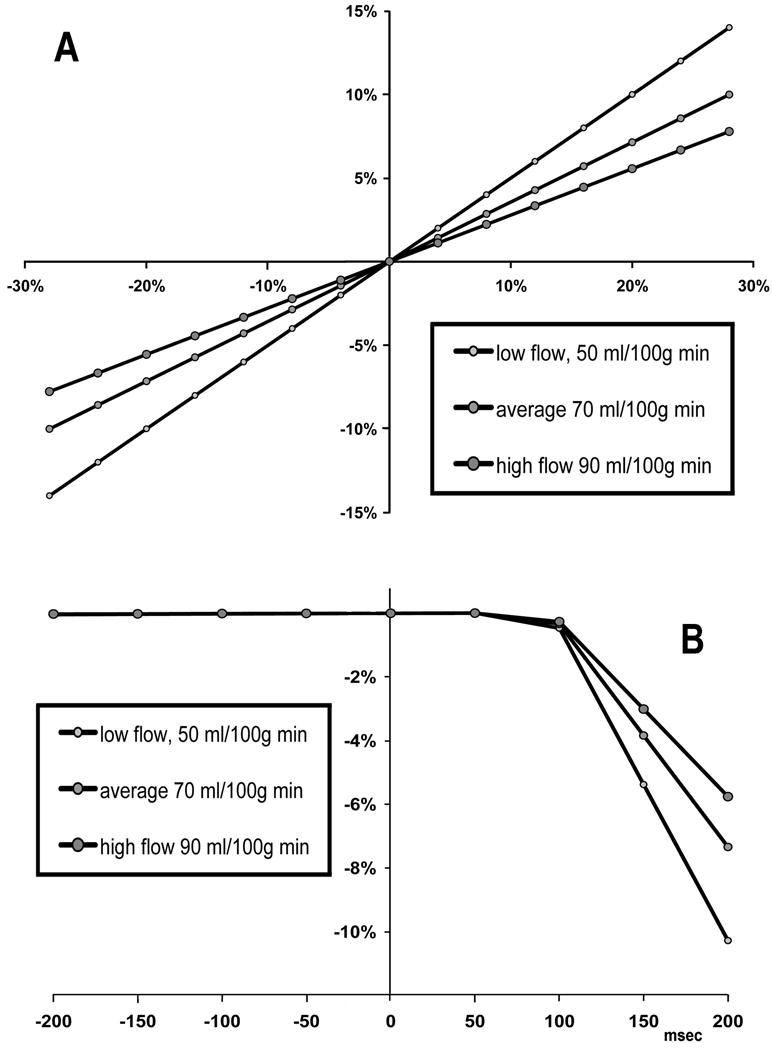
Analysis of white matter compensation method. (A) The effect of error in assumed white matter flow on the error in gray matter flow. (B) The use of white matter correction method assumes the time delay Δt from tagged slab to ROI to be the same as the time delay to the white matter. The error in hippocampal CBF (vertical axis) corresponding to variable difference ΔtWM - ΔtHIP between Δt for the white matter and for the hippocampus (horizontal axis), was simulated assuming ΔtWM = 600 msec and TI=1.2 s. Relatively low CBF errors are expected, provided time delay discrepancy is under 200 ms.
Discussion
To overcome the limitation of EPI readout, we have employed segmented TrueFISP imaging at 3T that is largely free of susceptibility artifacts and has adequate precision and spatial resolution (voxel volume <10 mm3) to assess CBF in the hippocampus. The results show good reliability and reproducibility. While head motion is detrimental to accurate assessment of regional CBF, we show that head motion problem is manageable even in exams involving elderly subjects and that it is less severe for hippocampal measurement than for the cortex.
There are only few reports on hippocampal CBF measured with ASL. As part of a study on hippocampal perfusion in Alzheimer’s disease, Alsop et al (28) used ASL technique based on 3D Fast Spin Echo imaging sequence to measure CBF in a group of 16 healthy controls aged 72.6±8.9 yrs. Before atrophy correction, the ratio of hippocampal CBF to visual cortex was 0.97±0.22. Raw hippocampal CBF values were not reported. Since our oblique hippocampal slice included only a small portion of the visual cortex, an exact comparison of our results with (28) is difficult. However, in 16 of our healthy elderly >60 year old (mean age 71.8) we observed hippocampal/visual cortex CBF ratio of 1.03±0.13, in good agreement with Alsop et al.
Our study of the effect of normal aging and gender on CBF and its response to hypercapnia confirm the classic PET findings (29) of age-related CBF decrease in neocortex. Using a novel algorithm that corrects for partial volume effect (PVE) in ASL-MRI, Asllani et al. demonstrated a global gray matter reduction in PVE-corrected CBF in 30 healthy elderly (age range 62-86, CBF=88.2 ml/(100 g min) as compared with 26 healthy young individuals (age range 21-31, CBF=107.3 ml/(100 g min)) (30). Linear extrapolation yields an annual decrease which is larger than annual CBF reduction in cortical gray matter we have observed. The discrepancy could be attributed to significant methodological differences between our studies.
Our data suggests however that the hippocampal perfusion, in contrast to neocortical perfusion, is not as vulnerable to aging. A possible explanation of the preservation of hippocampal CBF is the proximity of the hippocampus to the circle of Willis, resulting in a direct and short path of arterial input supply. It is also entirely possible that the hippocampal blood flow is age-related but the changes are too small to be detected using present methodology (31).
We observed that the hippocampal volume decreased by 0.02 ml per year, in agreement with other reports (32-39), but this was unrelated to the CBF.
Our measurements of the resting cortical CBF in younger healthy adults, 64.2 ± 10.0 ml/(100g min), agrees well with cortical CBF distribution measured in this population using the PET O-15 technique. For example, Rostrup et al reported cortical CBF of 61.0+/-19.1 ml/(100g min) (40); while Ito et al reported 55.1+/-11.8 in temporal and 57.6 +/- 11.7 in occipital cortex (41). The reason of relatively high variability of the resting cortical CBF across normal subjects is not well understood. One explanation, suggested by our data in Fig.6, is the inter-individual differences in vascular tone, i.e., the state of contractile tension in the vessel walls (42). Clearly, many other factors could contribute to variability of resting CBF.
Our CBF technique is sensitive to both the resting level and to mild changes in ETCO2. In response to a mild hypercapnia challenge averaging 6.8 mm Hg increase in end tidal pCO2 we observed CBF increase in all brain tissue, with cortical gray matter CBF averaging 18.0 ml/(100g min) or 31% over the baseline. This magnitude of gray matter CBF increase is in close agreement with a 30.4% increase observed by Bulte et al (43) in response to a breath-holding induced challenge (6.4 mm Hg increase in end tidal pCO2). Because hypercapnia is assumed to increases CBF without changing brain metabolism, response to hypercapnia is increasingly used as a calibration step to estimate the maximum possible BOLD signal change in functional MRI (44).
We confirm the previously reported gender effects in the CBF response to hypercapnia (41,45-47). For reason unknown, the female resting CBF is equivalent to the male but the response to CO2 is larger.
This study has several limitations. One limitation of the TrueFISP ASL protocol is the acquisition time of approximately 2 min/slice that makes it impractical to examine the entire brain or to detect activations that occur at temporal resolution of a few seconds. Lengthy acquisition time is of special concern when imaging impaired patients. However, relatively high precision of current protocol suggests that the exam may be acquired with fewer than 8 repetitions, yielding faster throughput.
A more adequate flow quantification formula, derived by Alsop and Detre (48) and modified by Wang et al (49), could be used to reflect two-compartmental distribution of tagged water in small arterial vessels and brain tissue. The potential sensitivity to unknown transit time from the tagging band to the image voxels could also be minimized with QUIPSS II ASL approach, in which a saturation pulse is applied after the inversion pulse to externally define the duration of tagging bolus. It would be of interest to compare our technique with QUIPSS and other recently proposed quantitative measurements of perfusion that acquire images at two or more TI values.
An additional limitation is related to the use of ASL signal in normally appearing white matter to reduce measurement variance. Clearly, this method precludes assessment of white matter flow (but not its vasoreactivity). Also, the departure of cerebral white matter flow from its assumed value of 25 ml/(min 100 ml) will be a source of systematic CBF error. It should be noted that the method does not simply scale CBF as the ratio against the mean white matter flow. Instead, as shown in Fig.9A, there is an attenuated effect of error in assumed value of FWavg on the gray matter flow. Parkes et al recently reported white matter CBF of 24±4 ml/(100 g min), with no age or gender effects (20).
Because ROI on ASL image represents a single 6 mm slice through the center of the hippocampus (Fig.1), its volume is approximately 25% smaller (on the average) than full hippocampal volume measured from 3D MPRAGE. Unsampled portion include mostly the dome of the hippocampal head. A more complete protocol would include a second slice that is adjacent and positioned immediately above our slice.
In spite of its limitations, the ability of the method to correlate local blood flow values with high resolution anatomy may be important in the management of patients with a broad variety of neurological disorders. The issue of hippocampal perfusion is of particular interest in dementia research, with a growing number of papers reporting changes in Alzheimer’s disease and cognitive impairment. Most of existing observations of hippocampal perfusion in AD are based on low resolution SPECT studies (50,51) and the results have been inconsistent for SPECT and ASL modalities (52,28). This study offers a strategy to examine hippocampal perfusion using 3T TrueFISP ASL technique that combines good spatial resolution, minimal susceptibility distortions, and high sensitivity.
Acknowledgments
This work was supported in part by a research grant from the Alzheimer’s Association, and by the National Institutes of Health through grants AG08051 and AG012101.
References
- 1.Eichenbaum H. A cortical-hippocampal system for declarative memory. Nat Rev Neurosci. 2001;1:41–50. doi: 10.1038/35036213. [DOI] [PubMed] [Google Scholar]
- 2.Squire LR. Memory and the hippocampus: a synthesis from findings with rats, monkeys, and humans. Psychol Rev. 1992;99:195–231. doi: 10.1037/0033-295x.99.2.195. [DOI] [PubMed] [Google Scholar]
- 3.Goetzen B, Sztamska E. Comparative anatomy of the arterial vascularization of the hippocampus in man and in experimental animals (cat, rabbit and sheep) Neuropatol Pol. 1992;30(2):173–84. [PubMed] [Google Scholar]
- 4.Kety SS, Schmidt CF. The nitrous oxide method for the quantitative determination of cerebral blood flow in man: theory, procedure and normal values. J Clin Invest. 1948;27:476–483. doi: 10.1172/JCI101994. [DOI] [PMC free article] [PubMed] [Google Scholar]
- 5.Frackowiak RSJ, Lenzi GL, Jones T, Heather JD. Quantitative measurement of regional cerebral blood flow and oxygen metabolism in man using 15O and positron emission tomography: theory, procedure, and normal values. J Compul Assist Tomogr. 1980;4:727–736. doi: 10.1097/00004728-198012000-00001. [DOI] [PubMed] [Google Scholar]
- 6.Huang SC, Carson RE, Hoffman EJ, Carson J, MacDonald N, Barrio JR, Phelps ME. Quantitative measurement of local cerebral blood flow in humans by positron computed tomography and 15O-water. J Cereb Blood Flow Metab. 1983;3:141–153. doi: 10.1038/jcbfm.1983.21. [DOI] [PubMed] [Google Scholar]
- 7.Raichle ME, Martin WRW, Herscovitch P, Mintun MA, Markham J. Brain blood flow measured with intravenous O-15 H2O. 2. Implementation and validation. J Nucl Med. 1983;24:790–798. [PubMed] [Google Scholar]
- 8.Chen JJ, Wieckowska M, Meyer E, Pike BG. Cerebral blood flow measurement using fMRI and PET: a cross-validation study. Int J Biomed Imag. 2008:516359. doi: 10.1155/2008/516359. [DOI] [PMC free article] [PubMed] [Google Scholar]
- 9.Fernandez-Seara MA, Wang J, Wang Z, Korczykowski M, Guenther M, Feinberg D, Detre JA. Imaging Mesial Temporal Lobe Activation During Scene Encoding: Comparison of fMRI Using BOLD and Arterial Spin Labeling. Human Brain Mapping. 2007;28:1391–1400. doi: 10.1002/hbm.20366. [DOI] [PMC free article] [PubMed] [Google Scholar]
- 10.Boss A, Martirosian P, Klose U, Nagele T, Claussen CD, Schick F. FAIR-TrueFISP imaging of cerebral perfusion in areas of high magnetic susceptibility differences at 1.5 and 3 Tesla. J MRI. 2007;25:924–931. doi: 10.1002/jmri.20893. [DOI] [PubMed] [Google Scholar]
- 11.Matrirosian P, Klose U, Mader I, Schick F. FAIR True-FISP Perfusion Imaging of the Kidneys. Magn Res Med. 2004;51:353–361. doi: 10.1002/mrm.10709. [DOI] [PubMed] [Google Scholar]
- 12.Schraml C, Schwenzer NF, Martirosian P, Claussen CD, Schick F. Perfusion Imaging of the Pancreas Using an Arterial Spin Labeling Technique. JMRI. 2008;28:1459–1465. doi: 10.1002/jmri.21564. [DOI] [PubMed] [Google Scholar]
- 13.Schraml C, Boss A, Martirosian P, Schwenzer NF, Claussen CD, Schick F. FAIR True-FISP Perfusion Imaging of the Thyroid Gland. JMRI. 2007;26:66–71. doi: 10.1002/jmri.20943. [DOI] [PubMed] [Google Scholar]
- 14.Grossman EJ, Zhang K, An J, Voorhees A, Inglese M, Ge Y, Oesingmann N, Xu J, Mcgorty K, Chen Q. Measurement of deep gray matter perfusion using a segmented True-Fast Imaging with Steady-State Precession Arterial Spin-Labeling method at 3T. JMRI. 2009;29:1425–1431. doi: 10.1002/jmri.21794. [DOI] [PMC free article] [PubMed] [Google Scholar]
- 15.Reisberg B, Sclan SG, Franssen EH, de Leon MJ, Kluger A, Torossian CL, Shulman E, Steinberg G, Monteiro I, McRae T, Boksay I, Mackell JA, Ferris SH. Clinical stages of normal aging and Alzheimer’s disease: The GDS staging system. Neurosci Res Communic. 1993;13(Suppl. 1):551–4. [Google Scholar]
- 16.Buxton RB, Frank LR, Wong EC, Siewert B, Warach S, Edelman RR. A general kinetic model for quantitative perfusion imaging with arterial spin labeling. Magn Reson Med. 1998;40:383–396. doi: 10.1002/mrm.1910400308. [DOI] [PubMed] [Google Scholar]
- 17.Haacke EM, Brown RW, Thompson MR, Venkatesan R. Magnetic resonance imaging: physical principles and sequence design. Chap. 18. St. Louis: Mosby; 1999. [Google Scholar]
- 18.Stanisz GJ, Odrobina EE, Pun J, Escaravage M, Graham SJ, Bronskill MJ, Henkelman RM. T1, T2 Relaxation and Magnetization Transfer in Tissue at 3T. Magnetic Resonance in Medicine. 2005;54:507–512. doi: 10.1002/mrm.20605. [DOI] [PubMed] [Google Scholar]
- 19.Law I, Iida H, Holm S, Nour S, Rostrup E, Svarer C, Paulson OB. Quantitation of regional cerebral blood flow corrected for partial volume effect using O-15 water and PET: II. Normal values and gray matter blood flow response to visual activation. J Cereb Blood Flow Metab. 2000;20:1252–1263. doi: 10.1097/00004647-200008000-00010. [DOI] [PubMed] [Google Scholar]
- 20.Parkes LM, Rashid W, Chard DT, Tofts PS. Normal cerebral perfusion measurements using arterial spin labeling: reproducibility, stability, and age and gender effects. Magn Res Med. 2004;51:736–743. doi: 10.1002/mrm.20023. [DOI] [PubMed] [Google Scholar]
- 21.Convit A, de Leon MJ, Tarshish C, De Santi S, Tsui W, Rusinek H, George AE. Specific hippocampal volume reductions in individuals at risk for Alzheimer’s disease. Neurobiology of Aging. 1997;18:131–138. doi: 10.1016/s0197-4580(97)00001-8. [DOI] [PubMed] [Google Scholar]
- 22.De Santi S, de Leon MJ, Rusinek H, Convit A, Tarshish CY, Boppana M, Tsui WH, Daisley K, Wang GJ, Schlyer D. Hippocampal formation glucose metabolism and volume losses in MCI and AD. Neurobiology of Aging. 2001;22:529–539. doi: 10.1016/s0197-4580(01)00230-5. [DOI] [PubMed] [Google Scholar]
- 23.Bobinski M, de Leon MJ, Wegiel J, De Santi S, Convit A, Saint Louis LA, Rusinek H, Wisniewski HM. The histological validation of post mortem magnetic resonance imaging-determined hippocampal volume in Alzheimer’s disease. Neurosci. 2000;95:721–725. doi: 10.1016/s0306-4522(99)00476-5. [DOI] [PubMed] [Google Scholar]
- 24.Haller J, Botteron K, Brunsden B, Sheline Y, Walkup R, Black K, Gado M, Vannier M. Hippocampal MR volumetry. SPIE Medical Imag. 1994;2359:660–671. [Google Scholar]
- 25.Jack CR, Jr, Petersen RC, Xu YC, O’Brien PC, Smith GE, Ivnik RJ, Boeve BF, Waring SC, Tangalos EG, Kokmen E. Prediction of AD with MRI-based hippocampal volume in mild cognitive impairment. Neurol. 1999;52:1397–1403. doi: 10.1212/wnl.52.7.1397. [DOI] [PMC free article] [PubMed] [Google Scholar]
- 26.Ashburner J, Friston KJ. Voxel-based morphometry - the methods. Neuroimage. 2000;11:805–821. doi: 10.1006/nimg.2000.0582. [DOI] [PubMed] [Google Scholar]
- 27.Good CD, Johnsrude IS, Ashburner J, Henson RN, Friston KJ, Frackowiak RS. A voxel-based morphometric study of ageing in 465 normal adult human brains. Neuroimage. 2001;14:21–36. doi: 10.1006/nimg.2001.0786. [DOI] [PubMed] [Google Scholar]
- 28.Alsop DC, Casement M, de Bazelaire C, Fong T, Press DZ. Hippocampal hyperperfusion in Alzheimer’s disease. NeuroImage. 2008;42:1267–1274. doi: 10.1016/j.neuroimage.2008.06.006. [DOI] [PMC free article] [PubMed] [Google Scholar]
- 29.Martin AJ, Friston KJ, Colebatch JG, Frackowiak RS. Decreases in regional cerebral blood flow with normal aging. Journal of Cerebral Blood Flow & Metabolism. 1991;11(4):684–9. doi: 10.1038/jcbfm.1991.121. [DOI] [PubMed] [Google Scholar]
- 30.Asllani I, Habeck C, Borogovac A, Brown TR, Brickman AM, Stern Y. Separating function from structure in perfusion imaging of the aging brain. Human Brain Mapping. 2009;30:2927–2935. doi: 10.1002/hbm.20719. [DOI] [PMC free article] [PubMed] [Google Scholar]
- 31.Asllani I, Borogovac A, Wright C, Sacco R, Brown TR, Zarahnd E. An investigation of statistical power for continuous arterial spin labeling imaging at 1.5 T. NeuroImage. 2008;39:1246–1256. doi: 10.1016/j.neuroimage.2007.10.015. [DOI] [PMC free article] [PubMed] [Google Scholar]
- 32.Lim KO, Zipursky RB, Murphy GM, Jr, Pfefferbaum A. In vivo quantification of the limbic system using MRI: effects of normal aging. Psychiatry Res. 1990;35:15–26. doi: 10.1016/0925-4927(90)90005-q. [DOI] [PubMed] [Google Scholar]
- 33.Convit A, de Leon MJ, Hoptman MJ, Tarshish C, De Santi S, Rusinek H. Age-related changes in brain: I. Magnetic resonance imaging measures of temporal lobe volumes in normal subjects. Psychiatr Q. 1995;66:343–355. doi: 10.1007/BF02238754. [DOI] [PubMed] [Google Scholar]
- 34.De Leon MJ, George AE, Golomb J, Tarshish C, Convit A, Kluger A, De Santi S, McRae T, Ferris SH, Reisberg B, Ince C, Rusinek H, Bobinski M, Quinn B, Miller DC, Wisniewski HM. Frequency of hippocampal formation atrophy in normal aging and Alzheimer’s disease. Neurobiol Aging. 1997;18:1–11. doi: 10.1016/s0197-4580(96)00213-8. [DOI] [PubMed] [Google Scholar]
- 35.Jernigan TL, Archibald SL, Fennema-Notestine C, Gamst AC, Stout JC, Bonner J, Hesselink JR. Effects of age on tissues and regions of the cerebrum and cerebellum. Neurobiol Aging. 2001;22:581–594. doi: 10.1016/s0197-4580(01)00217-2. [DOI] [PubMed] [Google Scholar]
- 36.Scahill RI, Frost C, Jenkins R, Whitwell JL, Rossor MN, Fox NC. A longitudinal study of brain volume changes in normal aging using serial registered magnetic resonance imaging. Arch Neurol. 2003;60:989–994. doi: 10.1001/archneur.60.7.989. [DOI] [PubMed] [Google Scholar]
- 37.Raz N, Gunning-Dixon F, Head D, Rodrigue KM, Williamson A, Acker JD. Aging, sexual dimorphism, and hemispheric asymmetry of the cerebral cortex: replicability of regional differences in volume. Neurobiol Aging. 2004;25:377–396. doi: 10.1016/S0197-4580(03)00118-0. [DOI] [PubMed] [Google Scholar]
- 38.Raz N, Rodrigue KM, Head D, Kennedy KM, Acker JD. Differential aging of the medial temporal lobe: a study of a five-year change. Neurology. 2004;62:433–438. doi: 10.1212/01.wnl.0000106466.09835.46. [DOI] [PubMed] [Google Scholar]
- 39.Du AT, Schuff N, Chao LL, Kornak J, Jagust WJ, Kramer JH, Reed BR, Miller BL, Norman D, Chui HC, Weiner MW. Age effects on atrophy rates of entorhinal cortex and hippocampus. Neurobiol Aging. 2006;27:733–740. doi: 10.1016/j.neurobiolaging.2005.03.021. [DOI] [PMC free article] [PubMed] [Google Scholar]
- 40.Rostrup E, Knudsen GM, Law I, Holm S, Larsson HBW, Paulson OB. The relationship between cerebral blood flow and volume in humans. Neuroimage. 2005;24:1–11. doi: 10.1016/j.neuroimage.2004.09.043. [DOI] [PubMed] [Google Scholar]
- 41.Ito H, Kanno I, Ibaraki M, Suhara T, Miura S. Relationship between baseline cerebral blood flow and vascular responses to changes in PaCO2 measured by positron emission tomography in humans: implication of inter-individual variations of cerebral vascular tone. Acta Physiol. 2008;193:325–330. doi: 10.1111/j.1748-1716.2008.01847.x. [DOI] [PubMed] [Google Scholar]
- 42.Kastrup A, Happe V, Hartmann C. Gender-related effects of indomethacin on cerebrovascular CO2 reactivity. J Neurol Sci. 1999;162:127–132. doi: 10.1016/s0022-510x(98)00288-3. [DOI] [PubMed] [Google Scholar]
- 43.Bulte DP, Drescher K, Jezzard P. Comparison of hypercapnia-based calibration techniques for measurement of cerebral oxygen metabolism with MRI. Magn Res Med. 2009;61:391–398. doi: 10.1002/mrm.21862. [DOI] [PubMed] [Google Scholar]
- 44.Kastrup A, Kruger G, Neumann-Haefelin T, Moseley ME. Assessment of cerebrovascular reactivity with functional magnetic resonance imaging: comparison of CO2 and breath holding. Magn Reson Imaging. 2001;19:13–20. doi: 10.1016/s0730-725x(01)00227-2. [DOI] [PubMed] [Google Scholar]
- 45.Vavilala MS, Lee LA, Lam AM. Cerebral blood flow and vascular physiology. Anesthesiol Clin North America. 2002;20:247–264. doi: 10.1016/s0889-8537(01)00012-8. [DOI] [PubMed] [Google Scholar]
- 46.Robertson JW, Debert CT, Frayne R. Variability of middle cerebral artery blood flow with hypercapnia in women. Ultrasound Med Biol. 2008;34:730–740. doi: 10.1016/j.ultrasmedbio.2007.07.024. [DOI] [PubMed] [Google Scholar]
- 47.Debert CT, Ide K, Poulin MJ. Ventilatory response to hypercapnia in premenopausal and postmenopausal women. Adv Exp Med Biol. 2008;605:452–457. doi: 10.1007/978-0-387-73693-8_79. [DOI] [PubMed] [Google Scholar]
- 48.Alsop DC, Detre JA. Reduced transit-time sensitivity in noninvasive magnetic resonance imaging of human cerebral blood flow. J Cerebl Blood Flow & Metab. 1996;16:1236–1249. doi: 10.1097/00004647-199611000-00019. [DOI] [PubMed] [Google Scholar]
- 49.Wang J, Alsop DC, Li L, Listerud J, Gonzalez-At JB, Schnall MD, Detre JA. Comparison of quantitative perfusion imaging using arterial spin labeling at 1.5 and 4.0 tesla. Magn Res Med. 2002;48:242–254. doi: 10.1002/mrm.10211. [DOI] [PubMed] [Google Scholar]
- 50.Johnson KA, Jones K, Holman BL, Becker JA, Spiers PA, Satlin A, Albert MS. Preclinical prediction of Alzheimer’s disease using SPECT. Neurology. 1998;50(6):1563–71. doi: 10.1212/wnl.50.6.1563. [DOI] [PubMed] [Google Scholar]
- 51.Ansar AB, Osaki Y, Kazui H, Oku N, Takasawa M, Kimura Y, Begum NN, Ikejiri Y, Takeda M, Hatazawa J. Effect of linearization correction on statistical parametric mapping (SPM): A 99mTc-HMPAO brain perfusion SPECT study in mild Alzheimer’s disease. Annals of Nuclear Medicine. 2006;20(8):511–517. doi: 10.1007/BF03026814. [DOI] [PubMed] [Google Scholar]
- 52.Fayed N, Dávila J, Oliveros A, Castillo J, Medrano JJ. Utility of Different MR Modalities in Mild Cognitive Impairment and Its Use as a Predictor of Conversion to Probable Dementia. Acad Radiol. 2008;15:1089–1098. doi: 10.1016/j.acra.2008.04.008. [DOI] [PubMed] [Google Scholar]


