

Abstract
We are using Drosophila follicle cells to study the mechanisms that promote cell motility. Using genetics we identified a gene regulatory network that controls the dynamic pattern of activation of JAK/STAT in anterior follicle cells. Under the influence of a graded signal, Unpaired (UPD), JAK/STAT becomes activated first in a graded fashion. STAT, in turn, locally activates its own repressor, Apontic (APT), a new feedback regulator of JAK/STAT signaling. High levels of JAK/STAT also activate Slow Border Cells (SLBO), which undermines APT-mediated repression. In this way, cells that achieve a high JAK/STAT level maintain SLBO expression and form border cells, which then migrate out of the cell layer. Cells with lower JAK/STAT activity express more APT than SLBO, ultimately lose STAT activity, and remain in the follicular epithelium. To better understand how the graded signal is converted to an all-or-none decision to move or stay, we developed a mathematical model. Simulations using the model reproduce the observed dynamics of JAK/STAT expression in the wild type and in several mutant situations. By combining biological experiments and mathematical modeling, we can achieve a more sophisticated understanding of how cells interpret molecular gradients.
Keywords: cell motility, mathematical modeling, JAK/STAT, morphogens, drosophila
Introduction: Morphogens and Pattern Formation
Everyone starts out as a single cell. How this one cell precisely develops into a well-patterned organism with a myriad of different cell identities, is a captivating problem in developmental biology. Specification of distinct cell fates at the appropriate times and places requires differential gene expression within a field of cells. Patterns of gene expression are often induced by a morphogen: a molecule that is present in a gradient and specifies different cell fates at different concentrations. Morphogens are usually expressed at a local source, then diffuse or are transported away, thus generating a concentration gradient that results in positional information.1,2 How cells differentially respond to varied levels of a gradient of signal is of great interest. During development, the source of a signal might change position, become more distant by growth, or even disappear. In these cases, instructions carried by a certain morphogen concentration must be decoded into stable states of cell fate determination that are maintained independently of the morphogen. In other instances, uninterrupted signaling from a local source is required for maintaining the fates of nearby cells.
Mathematical modeling has been useful in demonstrating how a localized signaling source can arise, and how cells respond to the local signal concentrations in an unequivocal way. For patterning within initially more or less uniform situations, Alain Turing (1952) was the first to show that an interaction of two substances with different diffusion ranges can lead to local concentration maxima.3 In the early 1970s, Gierer and Meinhardt showed that pattern formation is possible if and only if a short-range self-activating reaction is coupled with an antagonistic reaction of longer-range4—a condition not inherent in Turing’s pioneering paper. One example of this idea is the case of a short-range activator that feeds back positively on its own production and also produces a long-range inhibitor. In fact, several activator-inhibitor mechanisms are known. One example is Nodal/Lefty2, involved in the patterning of the oral field of the sea urchin embryo and in left-right patterning of vertebrate embryos.5-7 The mutual inhibition between Chordin and Bone Morphogenic Protein (BMP) represents an indirect self-enhancing system that generates the famous Spemann organizer in Xenopus. This self-activation is antagonized by a long-range substance, a TGFbeta homolog called Anti-dorsalizing morphogenetic protein, produced in the organizing region (reviewed in refs. 8-11). This type of pattern formation is robust and allows pattern regeneration even if the organizer is removed. Related mechanisms can generate a pattern within a single cell. Local self-enhancement can occur, for instance, if molecules cooperatively aggregate at the membrane. The ‘long-range’ antagonistic effect can result from depletion of precursors in the cytoplasm.11,12
Although patterns can emerge from initially uniform conditions, source regions for morphogens often arise from pre-existing patterns of differential gene expression. For example, for the formation of legs and wings in insects and vertebrates it was predicted that the corresponding morphogens are generated by a cooperation of differently determined cells (compartments in insects). The production of the morphogen is restricted to the compartment border or to the intersection of two compartment borders.13,14 Such a mechanism ensures that structures form at the right sites relative to earlier cell fate decisions, and that they have the correct orientation. This boundary model accounts for the generation of appendages in pairs with opposite handedness, and correctly describes many classical grafting experiments. Later, this model found strong support by molecular-genetic observations (reviewed in refs. 15-17).
Molecular Properties of Morphogens in Drosophila
Much of our understanding of how positional information is encoded by a graded signal derives from studies in fruit flies. Bicoid (BCD) is a transcription factor that functions to specify cell fates in the head and thorax of the embryo, and it was the first molecularly-defined morphogen18,19 (reviewed in refs. 20 and 21). The anterior gradient of BCD in the early embryo is also based on a preceding pattern. It depends on the local, maternal deposition of mRNAs into the egg, and then diffusion of the protein within the syncytial embryo to form a gradient over about 200 microns.22-24 As a morphogen, different amounts of BCD, along with its target Hunchback, specify distinct cell fates along the anterior posterior axis by controlling the expression of downstream gap genes and pair rule genes. Other well-known morphogens include the signaling molecules Wingless and Decapentaplegic (WG and DPP, fly homologs of Wnt and TGFbeta, respectively), which are repeatedly used in development for patterning multiple tissues (reviewed in refs. 25-28). Gradients of these signaling molecules form by localized production and secretion, followed by spreading to and uptake by neighboring cells.29,30 Once the expression gradient is generated, these morphogens initiate an intracellular signaling cascade, and different cellular fates are ultimately determined by downstream transcription factors reaching certain thresholds of expression or activity.
Interpretation of Signaling Gradients
Since diffusion plays an important role in the generation of morphogen gradients, it is expected that the local concentration in a particular cell varies with changes in the distance between the cell and the morphogen source. Tissue growth and cell movements are common during development, so morphogen concentrations are likely to change over time. If the signal is prone to variation: what should the cell measure? Several lines of evidence suggest that some cells measure the highest concentration to which they are exposed.31 In this way changing morphogen concentrations can nevertheless produce stable cellular responses.
Another challenge for cells in interpreting gradients is the precision with which the cells have to measure local protein concentrations. The concentration differences between neighboring cells are expected to be small, roughly 10% in the case of Bicoid for example.22,32 Nevertheless, these differences must be sufficient to activate different genes. Clearly, such a process requires amplification of a small difference in input to create a large difference in output.
One mechanism that can achieve switch-like activation of genes above a certain threshold concentration involves gene products that have a positive and non-linear feedback on their own activation (Fig. 1).31,33-35 One way the condition of non-linearity can be satisfied is if a dimer is required for auto-activation. The Deformed gene, for example, has this feature—autoregulation by a dimer.36 At low concentration, the chance to find a partner for dimerization is low whereas decay of the molecule does not require a partner. Therefore, at low levels of gene expression, the decay rate of the gene product exceeds its activation rate. In contrast, from a certain level onwards, sufficient dimers form and the auto-activation exceeds the decay. Activation will increase until saturation is achieved (Fig. 1). Thus, such a system can have two stable steady states, one at low and one at high levels of gene activation, a condition known as bistability. A switch to the high steady state is possible if a morphogen m has an additional activating influence on gene activation. In this way, the threshold level can be reached in response to m, and then autoregulation leads irreversibly to the high steady state. In this example, gene activation will be maintained even after the morphogen is no longer available. There are, however, other cases in which the morphogen must remain to maintain self-activation.
Figure 1.
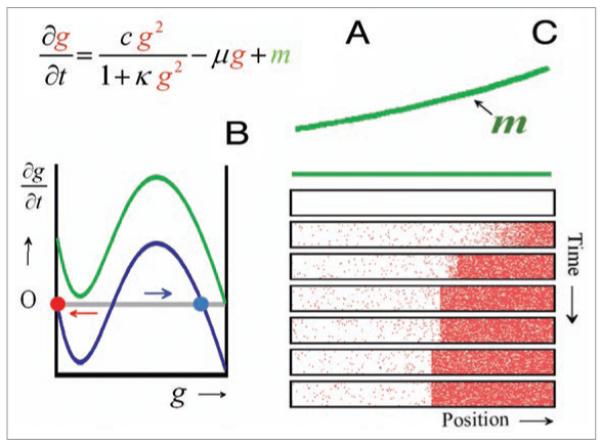
Switch-like activation of a gene by auto-activation. (A) A gene product g has a non-linear feedback (g2) on its own production; the production saturates at high concentration and the molecule undergoes linear decay (−μg). The morphogen m has an additional activating influence on the gene activation. The equation describes the concentration change of the gene activator per time unit. (B) The concentration change plotted as a function of g. At low g levels, the decay term dominates, i.e., the concentration change (∂g/∂t) is negative and the activation will drop further (red arrow) until the low steady state (red circle) is reached. At higher activation, the self-enhancement dominates, ∂g/∂t is positive and the activation will increase further (blue arrow) until the high steady state (blue circle) is reached. Only these two states are stable (∂g/∂t = 0). With a sufficient concentration of the morphogen m (green curve), the low steady state no longer exists, ∂g/∂t is positive also at low g levels and the system will switch irreversibly to a high activation. (C) Simulation: cells exposed at least to a threshold concentration of the morphogen m switch from a low to the high gene activation (indicated by the density of pixels). This is in contrast to the situation in border-cell activation (Fig. 4) where cells below a threshold cease gene activation.
As mentioned above for organizer formation, self-activation does not need to be direct. For example, mutual repression of two genes can achieve the same effect.34 Imagine that genes A and B repress each other. If both are at equilibrium, a slight increase of A would lead to a stronger repression of B, which, in turn, would lead to a further increase of the A activity, as if A were self-enhancing. The same is valid, of course, for gene B. The switching of the Lambda-phage between the lytic and lysogenic mode is a classical example of a system involving a double-inhibition.37 Generation of stable states by reciprocal inhibition may provide a more tunable system over a wider range of inputs.38-40 As will be shown below in detail, such a mutual inhibition is also decisive in the all-or nothing activation of the JAK/STAT pathway in the determination of the border cells in the development of Drosophila ovary. This came as a surprise for us since evidence for a direct auto-activation exists for this pathway.41,42
Patterning Follicle Cell Fates in the Drosophila Ovary
We are using the epithelium of the Drosophila ovary to study cellular decisions in response to molecular signals. This epithelium is composed of about 650 somatic cells, known as follicle cells, which surround 15 germ-line cells and one oocyte, forming a structure called the egg chamber. During development of the egg chamber, subpopulations of follicle cells differentiate as a consequence of multiple signaling events (reviewed in refs. 43 and 44). Precise patterning of this epithelium is critical for establishing the polarity of the future embryo and for formation of the eggshell. Early in egg development, two specialized cells differentiate at each pole of the egg chamber; these are called the polar cells.45,46 Later, in response to a signal secreted by the polar cells, the surrounding 4–6 anterior follicle cells differentiate from their neighbors to become the border cells. Once the border cells are specified, they tightly adhere around the non-motile polar cells, detach from the follicular epithelium, and migrate a distance of 150–200 μm as a cohesive group (Fig. 2A–C). Upon reaching their destination, the antero-dorsal side of the oocyte, these cells are required for terminal patterning of the egg47 and for formation of the micropyle of the eggshell, which allows sperm entry.48-50
Figure 2.
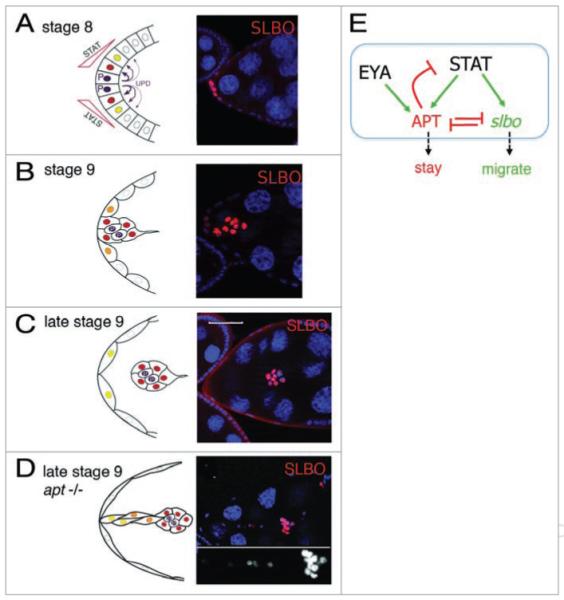
A genetic circuit controls border cell migration. (A–D) Left panels show schematics of the early events in the anterior follicle cell epithelium. Right panels show corresponding micrographs of egg chambers. DAPI marks nuclei in blue. (A) At stage 8, UPD from the polar cells (purple, P) signals to neighboring cells, activating STAT in a graded fashion. SLBO protein, indicated in red by antibody staining, is a marker for STAT activation. (B) Cells with high levels of STAT activity (red in left, or marked with SLBO antibody in green, right) begin migrating at stage 9. Some cells left behind in the epithelium still have SLBO expression at this time. (C) By late stage 9, border cells have moved away from the anterior and maintain high STAT activity, indicated by SLBO expression (red), and other cells have shut off this activity. Scale bar is 50 μm. (D) In apt mutants, all anterior cells maintain STAT activity (marked by SLBO expression in red, white in inset). (E) Regulatory circuit deduced from genetic experiments, which controls STAT activity and thereby the cellular decision to stay or migrate.
Specification of the border cells depends on signaling from the Janus Kinase (JAK) and Signal Transducer and Activator of Transcription (STAT) pathway.42,43,51-53 The key activating ligand for the pathway is Unpaired (UPD). UPD binds the receptor Domeless (DOME, which is also called marelle), which activates the non-receptor tyrosine kinase JAK (also known as hopscotch). Active JAK then phosphorylates DOME, creating binding sites for STAT, which is in turn phosphorylated. Phospho-STAT dimerizes and translocates to the nucleus where it regulates gene expression. One key transcriptional target of STAT in the border cells is the gene slow border cells (slbo),51 a transcription factor related to mammalian C/EBPs.49 STAT has also been proposed to activate transcription of its receptor and itself in embryos.41,42
Interpreting a UPD/JAK/STAT Signaling Gradient
In Drosophila, recent evidence suggests that graded JAK/STAT pathway activation is important for cellular decisions in multiple tissues including the embryo, the eye imaginal disc, and the ovary.42,54-57 In cell culture experiments, UPD can diffuse to nearby cells within 30 minutes.58 UPD is expressed in a graded manner in the eye imaginal disc epithelium55 and in the egg chamber.59 In the developing embryonic hindgut, a STAT activity gradient forms across 20–40 microns over 4–6 hours.56 Proper elongation of the intestine during hindgut development requires the rearrangement of cells within the gradient.56 During eye disc development, graded STAT activity contributes to definition of an equator around which cell clusters, called ommatidia, orient. Here, the gradient is required for appropriate ommatidia rotation.55 In each of these cases, the gradient of activated STAT provides positional information, though not by defining distinct cell fates. Instead, the gradient provides a directional cue that polarizes cell movements to correctly form the tissues. STAT activity is also graded in the anterior epithelial follicle cells of the ovary in response to localized expression of UPD from the polar cells; thus it relies on a previously established pattern. In this tissue, UPD/JAK/STAT signaling specifies at least two cell fates: the border cells, and the cells from which the border cells detach.42,54 Comparable to other morphogens, secreted UPD exerts its effect over about 50 μm in this tissue, or 8 cells,42,54 and with similar kinetics.
APT and SLBO Convert Graded STAT Activity into a Binary Cell Fate Decision
STAT activity is initially graded in the anterior follicular epithelium (Fig. 2A; reviewed in refs. 42 and 54), but later is maintained only in a subset of cells.54 Before border cells migrate, the STAT activity gradient extends across an average of 12 cells. Approximately six hours later, STAT activity remains detectable only in the 4–6 migratory border cells, and is turned off in the remaining cells (Fig. 2C; ref. 54). Thus, the question arises as to how the morphogenetic gradient is converted into on and off states that lead to the binary fate decision to migrate or not? One could have speculated that STAT signaling itself might be sufficient to account for this since STAT forms a dimer that can activate its own transcription and is therefore capable of non-linear auto-amplification. In addition, the polar cells, which are the source of UPD, physically separate from the epithelium with the border cells as they begin to migrate, thus keeping signaling levels highest in the cells closest to the polar cells. Theoretically, either of these mechanisms could be sufficient to amplify the difference in STAT activation between the border cells and the rest of the epithelial cells. However, we found that efficient conversion of the STAT gradient into ON and OFF states requires at least two additional genes: apt and slbo.
Our first clue that APT played a role in STAT regulation was the observation that apt mutant egg chambers have extra migratory cells that lag behind the main cluster of border cells, strikingly similar to the STAT gain-of-function phenotype.51,54 The lagging cells express slbo, which is a STAT target gene (Fig. 2D), although at a lower level than the cells in the border cell cluster. They are also intermediate in morphology and gene expression between the border cells and their neighbors that remain within the epithelium. They also fail to detach either from the border cells or the epithelium. We proposed that apt mutant egg chambers cannot resolve the gradient of STAT activation into ON and OFF states, causing extra cells to acquire invasive behavior due to continued STAT signaling.54 The striking phenotypic similarities between apt loss-of-function and STAT gain-of-function in the follicular epithelium led us to investigate the relationship between these two genes. We found that APT is a feedback inhibitor of the STAT pathway. In support of this idea, STAT regulates APT gene expression and apt exerts a negative effect on STAT nuclear accumulation.
Apontic Expression is Regulated by STAT and EYA
We demonstrated that apt is a downstream transcriptional target of STAT.54 APT expression can be induced by ectopic activation of JAK/STAT in follicle cells. Moreover, border cells mutant for STAT have reduced levels of APT protein expression compared to wild-type cells in the same cluster. apt is also expressed in various embryonic tissues,60-62 and JAK/STAT regulation of apt may occur in other cell types as well, such as in the trachea where they have overlapping patterns of activation,63,64 although this has not been studied.
Two observations suggested that another factor besides STAT must feed into the expression of apt in follicle cells. First, APT expression is not completely eliminated in stat mutant border cells and second, the wild-type domain of expression of APT in the follicular epithelium is broader than that of activated STAT. The transcriptional coactivator Eyes Absent (EYA) is expressed in a pattern that resembles that of APT.65 We found that EYA expression is graded in the anterior domain of the egg chamber, however the gradient is shallower than that of nuclear STAT, as is true for APT (Fig. 3A). Moreover, APT expression is abolished in eya mutant follicle cells, and ectopic expression of eya is capable of inducing ectopic expression of APT (Fig. 3B and C). Therefore two critical inputs, EYA and STAT, contribute to APT expression in the egg chamber. In other tissues, different combinations of transcription factors likely regulate the expression of APT, because EYA and APT are not always co-expressed.
Figure 3.
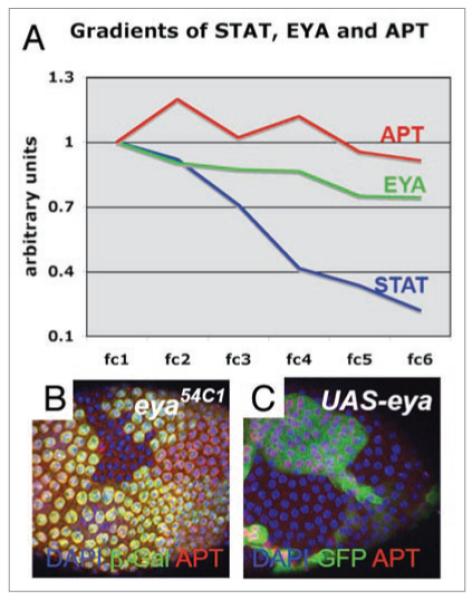
EYA activates apt expression. (A) APT and EYA protein expression relative to DAPI staining intensity in anterior follicle cells (fc) as a function of their distance from the polar cells. Fc1 is a cell next to a polar cell, fc2 is one cell away from a polar cell, etc. Nuclear STAT activity is detected in a steeper gradient than APT or EYA. (B) Loss of eya in mosaic clones marked by loss of β-Galactosidase expression (as detected by antibody staining, green), results in reduced APT protein expression (red). all cell nuclei are marked in blue by DAPI staining. (C) Overexpression of eya in mosaic clones, marked by Green Fluorescent Protein (GFP, green), results in higher levels of APT protein, red (appearing purple when overlaid with DAPI). Methods for clonal analysis were carried out as described in Starz-Gaiano et al. 2008.
A Genetic Circuit That Patterns Anterior Follicle Cells
The gene slbo encodes a transcription factor related to mammalian CAAT enhancer binding proteins (C/EBPs). SLBO is a key downstream target of STAT,51 and is expressed in a pattern that resembles the pattern of STAT activation.54 That is, it is initially graded and subsequently maintained in migrating border cells but turned off in anterior follicle cells that remain within the epithelium. Although APT and SLBO are both targets of STAT, their patterns of expression differ for two reasons. One reason is that the slbo enhancer contains multiple STAT binding sites of differing affinities so that as the STAT concentration rises, more and more sites are occupied and more and more slbo is expressed. In contrast, the apt gene appears to contain only two sites of relatively high affinity. Therefore these sites saturate even at relatively low STAT concentrations. Secondly, EYA affects apt expression but not slbo. Therefore APT ends up expressed in a shallow gradient that extends beyond the STAT activation domain whereas the SLBO expression pattern mirrors STAT activity.
Our genetic and molecular studies indicate that a simple regulatory network between STAT, SLBO, APT and EYA controls cell fate decisions in the anterior epithelium (Fig. 2E). The basic idea of the network is as follows. The UPD gradient leads to graded activation of STAT. STAT, together with EYA, turns on APT in a broad and shallow gradient. APT feeds back to antagonize JAK/STAT. SLBO, also a JAK/STAT target, is expressed in a steeper gradient and antagonizes APT. Therefore, in cells close to the polar cells the SLBO level is high enough to suppress the action of APT and a high JAK/STAT level remains. In contrast, further away from the source of UPD, the SLBO level is too low and APT represses STAT.
Differential Equations Describe the Establishment of Biological Patterns
The precise results of non-linear interactions with positive and negative feedback, such as the genetic circuit described above, are difficult to predict by intuition alone. Therefore we took advantage of mathematical modeling to determine whether the interactions that we described could achieve reliable conversion of a graded signal into a step function. Details of the postulated network evolved during attempts to simulate our experimental results based on the modeling, including the mutant situations. Deviations between the observations and the simulations allowed us to refine the model.
Equations such as those presented in Figure 4A are easy to understand conceptually even for non-specialists. Each equation describes the concentration change of a component in a short time interval as function of the concentrations of the other players. These changes depend upon each protein’s production or activation rate and its decay rate, and in the case of UPD, upon gain or loss by diffusion to neighboring cells. The rates depend on regulatory influences of the other components. In the computer simulation these changes are added to an initial concentration, providing the distributions at a slightly later time point. Subsequently, the next concentration changes are calculated, added to the updated concentrations, and so on. In this way, the total time course of the system is calculated. The initial condition is that the polar cells are specified and produce a polar cell activator (P), which is set arbitrarily to one. It remains unchanged. All other concentrations are initially set to zero. First consider the simplest case, that for the morphogen UPD (U) in Equation 2. UPD is produced in proportion to P, and has a first order decay, i.e., the number of molecules that disappear per time unit is proportional to the number of molecules present. The last term in this equation reflects the diffusion of the molecule where x represents distance. In Equation 1, JAK/STAT activity (J) is increased in proportion to the UPD signal (U). Activity saturates at high levels, giving us 1/0.1 J2, which allows achievement of a stable high level. APT (A) attenuates JAK/STAT activity and thereby appears in the denominator. The downregulation of APT on JAK/STAT is antagonized by SLBO (S). To reflect the empirical observation that there is no JAK/STAT activity detectable in the polar cells, we assume that the polar cell activator (P) attenuates signaling in the polar cells. The decay of JAK/STAT activity is described by the second term in the equation. Equation 3 represents the change in APT concentration. APT (A) is produced in response to JAK/STAT activity (J), but this effect saturates. APT is also downregulated by SLBO (S). The last term in the equation accounts for the JAK/STAT-independent production of APT in response to EYA. In Equation 4, we see that JAK/STAT activates SLBO expression non-linearly, but APT downregulates it. By including a second-order dependence of SLBO on JAK/STAT (J2), the distribution of SLBO expression becomes steeper than that of APT (which is merely a function of J). SLBO also has a linear decay rate.
Figure 4.
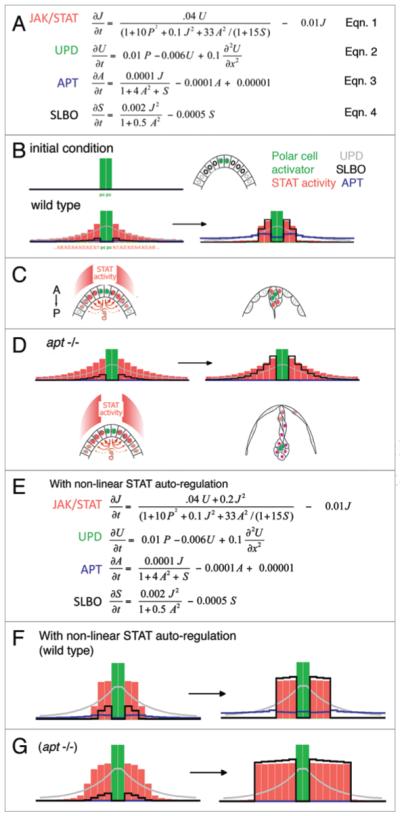
Differential equations describe the establishment of biological patterns. (A) Differential equations describing the changes in concentration over time of each pathway component as a function of the concentrations of other components. See text for details. (B–D) Concentration changes plotted as a function of location in the follicle epithelium, relative to the polar cells (pc, green), by computer simulations. (B) Initially, concentrations are zero except for activating signal in polar cells. (B, D, F and G) Early stages are shown at left, final steady states are shown on the right. (B,C) In wild-type, STAT (salmon colored bars) is activated in a gradient early across follicle cells (fc1, 2, 3 as you move away from the polar cells), but this gradient is refined to a step-function (right). (D) Simulation of apt loss of function mutants shows that the STAT gradient is maintained over time. (E–G) A model including STAT auto-activation does not accurately simulate the apt mutant phenotype. (F) In wild-type, a switch from graded activation to ON/OFF signal is still observed with STAT auto-regulation, although the number of cells with high STAT activity is increased. (G) In apt mutants, this model still demonstrates expanded STAT activity, but it displays an ON/OFF character that is not observed experimentally.
Since we do not have precise kinetic data, numerical values in the equations are estimates and can vary without changing the outcome, as long as the APT:SLBO balance is preserved. In this model, we achieve a steady state at approximately 4,500 iterations. Since the cell-specification process occurs over about 6 hours, each iteration accounts for about 5 seconds. In Figure 4D, the final stable concentrations are plotted as a function of the distance from the polar cells. An advantage of this model system is the small number of cells involved and their arrangement in a single layer. For simplicity they can be considered as a linear array (although, in reality, the signaling occurs radially out from the polar cells in three dimensions). The model clearly recapitulates the signaling pattern across the field of cells, with the polar cells in the center, and the border cells on either side.
The computer simulation accurately mimics the wild-type case as well as several mutant situations that were tested; in each case the outcome matched our empirical observations. In wild-type, SLBO is activated at high levels of STAT activity and antagonizes APT. Near the polar cells, APT activity is reduced, leading to an increase in STAT activity, which leads to an even higher level of SLBO, and thus lower APT activity so that STAT and SLBO predominate. Further from the polar cells, APT outcompetes STAT and SLBO due to its distribution, which is a result both of the saturation of APT production at relatively low concentrations of STAT and of the pattern of EYA expression. Thus, the ON-OFF behavior (to become a border cell or not) that we see in wild-type does not appear to depend on JAK/STAT auto-regulation but instead requires the switch-like effect of two mutually repressing genes, SLBO and APT. The model also describes correctly how the step-like JAK/STAT distribution evolves: first a graded distribution emerges. Subsequently, the cells distant to the polar cells downregulate STAT activity. In other words, cells that are not exposed to a threshold morphogen concentration switch off the migratory cell fate. This is very different from other threshold systems in which the ON-switch only occurs if the signal concentration is above a certain threshold and is maintained even in the absence of the morphogen (see Fig. 1). This property may be important as the anterior follicle cells also require JAK/STAT activity for their fate specification. These cells experience not only a lower level of signaling compared to the border cells but also a transient signal. Moreover border cell fate requires continuous JAK/STAT signaling.66 If STAT activity is lost after they initiate migration, the cells stop migrating and turn on expression of at least one marker of nurse cell associated follicle cell fate. This system is considered therefore to be monostable. The only stable state is off. In order to keep the signal on, continuous input is required.
The model also simulates mutant phenotypes correctly. For example, if APT is absent (Fig. 4D), the JAK/STAT distribution remains graded similar to its activator, UPD. Thus more cells achieve high levels of STAT signaling and acquire border cell-like properties. In contrast, if APT is over-produced, JAK/STAT activity eventually becomes repressed everywhere and no cells migrate. We tested the effect of co-overexpression of both APT and SLBO in silico, and the computer simulation suggested that the migration defect caused by overexpression of either gene alone would be rescued, as we observed in vivo.
A short PC-program including well-commented source code is available in the supplementary material. The program allows the simulation of wild type and mutant situations. Since the program can be recompiled with an open-source compiler, alternative molecular interactions or other ranges of parameters can be easily tested.
Several interesting concepts emerge from the mathematical modeling. First of all, it demonstrates that our minimal four-component genetic interaction network is at least theoretically sufficient to describe the stable outcomes we see in vivo with respect to cell fate decisions, and thereby, cell behaviors. Secondly, it accurately predicts the outcomes of several experiments in which we varied the levels of the components. But perhaps most interestingly, it hints at slightly different biological mechanisms than we expected. For example, we found that STAT does not require auto-regulatory activity for border cell specification, even though STAT activity is known to enhance its own expression in the embryo.41,42 Early versions of our model did incorporate a positive feedback factor for STAT activity (Fig. 4E), and inclusion of such a term can simulate wild-type patterning and produce a switch-like behavior (Fig. 4F). However, this model does not accurately simulate the apt mutant phenotype, as it shows expanded signaling but still retains the ON/OFF property (Fig. 4G). There are several possible explanations for this apparent conundrum. STAT auto-regulation may be tissue-specific and not occur in border cells, or may occur at low levels. Alternatively, this auto-regulation may occur more slowly than the critical time frame between when the border cells are specified and when they move away. Finally, in the ovarian epithelium, the localized and continuous production of UPD from the polar cells defines a domain of maximal activation, which reduces a need for auto-activation for the generation of pattern. Thus, the STAT positive feedback loop may be important in signaling during embryogenesis, but may be insufficiently rapid or simply unnecessary for specifying the border cell population in the presence of APT action.
Another surprise was that cells below a threshold become deactivated, in contrast to many other reactions in which activation is irreversible. In the case of border cells, and also in Drosophila testis stem cells,67,68 it is important that those cells receiving a low level of UPD signal quickly extinguish STAT activity. It may be that the detailed properties of the JAK/STAT signaling pathway make it particularly suitable to this type of regulation, which is also known as monostability. Therefore, the mechanisms we are studying may reveal fundamental properties of JAK/STAT signaling and monostable circuits in general.
Some features of the genetic circuit still require an explanation. For example, the apt loss of function phenotype is incompletely penetrant. That is, 80% of apt mutant egg chambers have additional migratory cells and expanded STAT signaling. But the other 20% appear normal. A possible reason could be that the mechanical separation of the border cell cluster from the epithelium, which physically removes the source of activating UPD signal, may sometimes be sufficient to result in loss of low STAT activity. Alternatively, or in addition, STAT autoregulation in the absence of APT could play a role. Experiments are underway to test these alternatives by genetically blocking border cell movement and measuring the effects on the STAT activity gradient. Note that in the mathematical models, one goal is to find conditions that lead to a steady state. In the case of the border cells, the activating signal is physically moving, but signaling properties altered by the movement are not factored into the simulations. In light of this, models incorporating the putative non-linear STAT self-enhancement may be correct, but the graded signals observed in vivo reflect the early iterations, prior to the achievement of a steady-state, (i.e., the first panel in Fig. 4G).
In conclusion, our molecular genetic investigation of border cell determination together with the modeling revealed a new type of all-or-nothing determination under the influence of graded morphogenetic signal. The modeling may provide help to understand other systems that still appear to be puzzling. Further investigation will reveal whether related mechanisms are also employed in other biological situations.
Program code and parameters:
CASE 246 ‘GE-BISTABLE STATE, FOR POLAR-BORDER CELLS
‘SLBO does not only hinder the production but the effect of APT on J/S
‘a = STAT, activated by UPD (term ba * b), inhibited by APT; thin inhibition is undermined by SLBO
‘J/S is excluded by pole cells (term cc * c)
‘b = UPD, produced by pole cells (=c)
‘c = pole cells, defined by initial condition, unchanged
‘d = APT is quenching the signal (a) that is produced J/S (=> a); is inhibited by SLBO (term cd * e * e)
‘and by itself (term sd * d * d), both terms are non-linear; a base-line APT production exists (se)
‘e = SLBO, produced by j/S (a), inhibits and is inhibited by APT (d)
‘e.g., The term ‘olddecaydiffA’ is the new concentration of a as given by the change due to decay (and diffusion)
‘e.g., olddecaydiffA = a *(1 - ra) where a is the removal per iteration
‘DA, DB… diffusion; RA, RB… removal rates, BA, BB… production rates, others used for coupling
FOR i = ja TO js; GOSUB olddecay
axt(1, i) = olddecaydiffA + ba * B/(1 + cc * c * c + sa * A * A + cb * d/(1 + cd * e * e))
axt(2, i) = olddecaydiffB + bb * C
axt(4, i) = olddecaydiffD + bd * (a/(1 + sd * d * d + sc * e) + se)
axt(5, i) = olddecaydiffE + be * a * a/(1 + ce * d* d)
NEXT i
DA = 0.0000; RA = 0.0100; BA = 0.0400; SA = 0.1000; CA = 0.0000; AA = 0.0000; GA = 0.0000;
DB = 0.1000; RB = 0.0060; BB = 0.0100; SB = 0.0000; CB = 33.0000; AB = 0.0000; GB = 0.0000;
DC = 0.0000; RC = 0.0000; BC = 0.0000; SC = 1.0000; CC = 10.0000; AC = 0.0000; GC = 0.0000;
DD = 0.0000; RD = 0.0001; BD = 0.0001; SD = 4.0000; CD = 15.0000; AD = 0.2000; GD = 0.0000;
DE = 0.0000; RE = 0.0005; BE = 0.0020; SE = 0.1000; CE = 0.5000; AE = 0.0000; GE = 0.0000;
(PC software for such simulations can be found on a CD included in the book: Hans Meinhardt ‘The Algorithmic Beauty of Sea Shells’ (3rd edition, 2003); Springer, Heidelberg, New York. See also http://www.eb.tuebingen.mpg.de/meinhardt).
Abbreviations
- STAT
signal transducer and activator of transcription
- JAK
Janus kinase
- UPD
unpaired
- APT
apontic
- SLBO
slow border cells
References
- 1.Wolpert L. One hundred years of positional information. Trends Genet. 1996;12:359–64. doi: 10.1016/s0168-9525(96)80019-9. [DOI] [PubMed] [Google Scholar]
- 2.Wolpert L. Positional information and the spatial pattern of cellular differentiation. J Theor Biol. 1969;25:1–47. doi: 10.1016/s0022-5193(69)80016-0. [DOI] [PubMed] [Google Scholar]
- 3.Turing AM. The chemical basis of morphogenesis. Philos Trans R Soc Lond B Biol Sci. 1952;237:37–72. doi: 10.1098/rstb.2014.0218. [DOI] [PMC free article] [PubMed] [Google Scholar]
- 4.Gierer A, Meinhardt H. A theory of biological pattern formation. Kybernetik. 1972;12:30–9. doi: 10.1007/BF00289234. [DOI] [PubMed] [Google Scholar]
- 5.Chen Y, Schier AF. Lefty proteins are long-range inhibitors of squint-mediated nodal signaling. Curr Biol. 2002;12:2124–8. doi: 10.1016/s0960-9822(02)01362-3. [DOI] [PubMed] [Google Scholar]
- 6.Duboc V, Rottinger E, Besnardeau L, Lepage T. Nodal and BMP2/4 signaling organizes the oral-aboral axis of the sea urchin embryo. Dev Cell. 2004;6:397–410. doi: 10.1016/s1534-5807(04)00056-5. [DOI] [PubMed] [Google Scholar]
- 7.Nakamura T, Mine N, Nakaguchi E, Mochizuki A, Yamamoto M, Yashiro K, et al. Generation of robust left-right asymmetry in the mouse embryo requires a self-enhancement and lateral-inhibition system. Dev Cell. 2006;11:495–504. doi: 10.1016/j.devcel.2006.08.002. [DOI] [PubMed] [Google Scholar]
- 8.Moos M, Jr, Wang S, Krinks M. Anti-dorsalizing morphogenetic protein is a novel TGFbeta homolog expressed in the Spemann organizer. Development. 1995;121:4293–301. doi: 10.1242/dev.121.12.4293. [DOI] [PubMed] [Google Scholar]
- 9.Niehrs C. Regionally specific induction by the Spemann-Mangold organizer. Nat Rev Genet. 2004;5:425–34. doi: 10.1038/nrg1347. [DOI] [PubMed] [Google Scholar]
- 10.De Robertis EM. Spemann’s organizer and self-regulation in amphibian embryos. Nat Rev Mol Cell Biol. 2006;7:296–302. doi: 10.1038/nrm1855. [DOI] [PMC free article] [PubMed] [Google Scholar]
- 11.Meinhardt H. Models of biological pattern formation: from elementary steps to the organization of embryonic axes. Curr Top Dev Biol. 2008;81:1–63. doi: 10.1016/S0070-2153(07)81001-5. [DOI] [PubMed] [Google Scholar]
- 12.Meinhardt H, de Boer PA. Pattern formation in Escherichia coli: a model for the pole-to-pole oscillations of Min proteins and the localization of the division site. Proc Natl Acad Sci USA. 2001;98:14202–7. doi: 10.1073/pnas.251216598. [DOI] [PMC free article] [PubMed] [Google Scholar]
- 13.Meinhardt H. A boundary model for pattern formation in vertebrate limbs. J Embryol Exp Morphol. 1983;76:115–37. [PubMed] [Google Scholar]
- 14.Meinhardt H. Cell determination boundaries as organizing regions for secondary embryonic fields. Dev Biol. 1983;96:375–85. doi: 10.1016/0012-1606(83)90175-6. [DOI] [PubMed] [Google Scholar]
- 15.Vincent JP, Lawrence PA. Developmental genetics. It takes three to distalize. Nature. 1994;372:132–3. doi: 10.1038/372132a0. [DOI] [PubMed] [Google Scholar]
- 16.Irvine KD, Rauskolb C. Boundaries in development: formation and function. Annu Rev Cell Dev Biol. 2001;17:189–214. doi: 10.1146/annurev.cellbio.17.1.189. [DOI] [PubMed] [Google Scholar]
- 17.Martin GR. Developmental biology. Why thumbs are up. Nature. 1995;374:410–1. doi: 10.1038/374410a0. [DOI] [PubMed] [Google Scholar]
- 18.Driever W, Nusslein-Volhard C. The bicoid protein determines position in the Drosophila embryo in a concentration-dependent manner. Cell. 1988;54:95–104. doi: 10.1016/0092-8674(88)90183-3. [DOI] [PubMed] [Google Scholar]
- 19.Driever W, Nusslein-Volhard C. A gradient of bicoid protein in Drosophila embryos. Cell. 1988;54:83–93. doi: 10.1016/0092-8674(88)90182-1. [DOI] [PubMed] [Google Scholar]
- 20.McGregor AP. How to get ahead: the origin, evolution and function of bicoid. Bioessays. 2005;27:904–13. doi: 10.1002/bies.20285. [DOI] [PubMed] [Google Scholar]
- 21.Ephrussi A, St. Johnston D. Seeing is believing: the bicoid morphogen gradient matures. cells. 2004;116:143–52. doi: 10.1016/s0092-8674(04)00037-6. [DOI] [PubMed] [Google Scholar]
- 22.Houchmandzadeh B, Wieschaus E, Leibler S. Establishment of developmental precision and proportions in the early Drosophila embryo. Nature. 2002;415:798–802. doi: 10.1038/415798a. [DOI] [PubMed] [Google Scholar]
- 23.Gregor T, Tank DW, Wieschaus EF, Bialek W. Probing the limits to positional information. Cell. 2007;130:153–64. doi: 10.1016/j.cell.2007.05.025. [DOI] [PMC free article] [PubMed] [Google Scholar]
- 24.Gregor T, Wieschaus EF, McGregor AP, Bialek W, Tank DW. Stability and nuclear dynamics of the bicoid morphogen gradient. Cell. 2007;130:141–52. doi: 10.1016/j.cell.2007.05.026. [DOI] [PMC free article] [PubMed] [Google Scholar]
- 25.Cadigan KM. Regulating morphogen gradients in the Drosophila wing. Semin Cell Dev Biol. 2002;13:83–90. doi: 10.1016/s1084-9521(02)00014-9. [DOI] [PubMed] [Google Scholar]
- 26.Kicheva A, Gonzalez-Gaitan M. The Decapentaplegic morphogen gradient: a precise definition. Curr Opin Cell Biol. 2008;20:137–43. doi: 10.1016/j.ceb.2008.01.008. [DOI] [PubMed] [Google Scholar]
- 27.Teleman AA, Strigini M, Cohen SM. Shaping morphogen gradients. Cell. 2001;105:559–62. doi: 10.1016/s0092-8674(01)00377-4. [DOI] [PubMed] [Google Scholar]
- 28.Kerszberg M, Wolpert L. Specifying positional information in the embryo: looking beyond morphogens. Cell. 2007;130:205–9. doi: 10.1016/j.cell.2007.06.038. [DOI] [PubMed] [Google Scholar]
- 29.Zhu AJ, Scott MP. Incredible journey: how do developmental signals travel through tissue? Genes Dev. 2004;18:2985–97. doi: 10.1101/gad.1233104. [DOI] [PubMed] [Google Scholar]
- 30.Strigini M. Mechanisms of morphogen movement. J Neurobiol. 2005;64:324–33. doi: 10.1002/neu.20164. [DOI] [PubMed] [Google Scholar]
- 31.Meinhardt H. Space-dependent cell determination under the control of morphogen gradient. J Theor Biol. 1978;74:307–21. doi: 10.1016/0022-5193(78)90078-4. [DOI] [PubMed] [Google Scholar]
- 32.He F, Wen Y, Deng J, Lin X, Lu LJ, Jiao R, et al. Probing intrinsic properties of a robust morphogen gradient in Drosophila. Dev Cell. 2008;15:558–67. doi: 10.1016/j.devcel.2008.09.004. [DOI] [PMC free article] [PubMed] [Google Scholar]
- 33.Meinhardt H. Morphogenesis of lines and nets. Differentiation. 1976;6:117–23. doi: 10.1111/j.1432-0436.1976.tb01478.x. [DOI] [PubMed] [Google Scholar]
- 34.Meinhardt H. Models of biological pattern formation. Academic Press; London: 1982. PDF freely available at http://www.eb.tuebingen.mpg.de/meinhardt. [Google Scholar]
- 35.Lewis J, Slack JM, Wolpert L. Thresholds in development. J Theor Biol. 1977;65:579–90. doi: 10.1016/0022-5193(77)90216-8. [DOI] [PubMed] [Google Scholar]
- 36.Regulski M, Dessain S, McGinnis N, McGinnis W. High-affinity binding sites for the Deformed protein are required for the function of an autoregulatory enhancer of the Deformed gene. Genes Dev. 1991;5:278–86. doi: 10.1101/gad.5.2.278. [DOI] [PubMed] [Google Scholar]
- 37.Ptashne M, Jeffrey A, Johnson AD, Maurer R, Meyer BJ, Pabo CO, et al. How the lambda repressor and cro work. Cell. 1980;19:1–11. doi: 10.1016/0092-8674(80)90383-9. [DOI] [PubMed] [Google Scholar]
- 38.Tsai TY, Choi YS, Ma W, Pomerening JR, Tang C, Ferrell JE., Jr Robust, tunable biological oscillations from interlinked positive and negative feedback loops. Science. 2008;321:126–9. doi: 10.1126/science.1156951. [DOI] [PMC free article] [PubMed] [Google Scholar]
- 39.Ferrell JE., Jr Feedback regulation of opposing enzymes generates robust, all-or-none bistable responses. Curr Biol. 2008;18:244–5. doi: 10.1016/j.cub.2008.02.035. [DOI] [PMC free article] [PubMed] [Google Scholar]
- 40.Ferrell JE., Jr Self-perpetuating states in signal transduction: positive feedback, double-negative feedback and bistability. Curr Opin Cell Biol. 2002;14:140–8. doi: 10.1016/s0955-0674(02)00314-9. [DOI] [PubMed] [Google Scholar]
- 41.Brown S, Hu N, Hombria JC. Identification of the first invertebrate interleukin JAK/STAT receptor, the Drosophila gene domeless. Curr Biol. 2001;11:1700–5. doi: 10.1016/s0960-9822(01)00524-3. [DOI] [PubMed] [Google Scholar]
- 42.Xi R, McGregor JR, Harrison DA. A gradient of JAK pathway activity patterns the anterior-posterior axis of the follicular epithelium. Dev Cell. 2003;4:167–77. doi: 10.1016/s1534-5807(02)00412-4. [DOI] [PubMed] [Google Scholar]
- 43.Denef N, Schupbach T. Patterning: JAK-STAT signalling in the Drosophila follicular epithelium. Curr Biol. 2003;13:388–90. doi: 10.1016/s0960-9822(03)00317-8. [DOI] [PubMed] [Google Scholar]
- 44.Nilson LA, Schupbach T. EGF receptor signaling in Drosophila oogenesis. Curr Top Dev Biol. 1999;44:203–43. doi: 10.1016/s0070-2153(08)60471-8. [DOI] [PubMed] [Google Scholar]
- 45.Grammont M, Irvine KD. Fringe and Notch specify polar cell fate during Drosophila oogenesis. Development. 2001;128:2243–53. doi: 10.1242/dev.128.12.2243. [DOI] [PubMed] [Google Scholar]
- 46.Lopez-Schier H, St. Johnston D. Delta signaling from the germ line controls the proliferation and differentiation of the somatic follicle cells during Drosophila oogenesis. Genes Dev. 2001;15:1393–405. doi: 10.1101/gad.200901. [DOI] [PMC free article] [PubMed] [Google Scholar]
- 47.Savant-Bhonsale S, Montell DJ. Torso-like encodes the localized determinant of Drosophila terminal pattern formation. Genes Dev. 1993;7:2548–55. doi: 10.1101/gad.7.12b.2548. [DOI] [PubMed] [Google Scholar]
- 48.King RC. Drosophila melanogaster. Academic Press; New York: 1970. Ovarian Development. [Google Scholar]
- 49.Montell DJ, Rorth P, Spradling AC. Slow border cells, a locus required for a developmentally regulated cell migration during oogenesis, encodes Drosophila C/EBP. Cell. 1992;71:51–62. doi: 10.1016/0092-8674(92)90265-e. [DOI] [PubMed] [Google Scholar]
- 50.Edwards KA, Kiehart DP. Drosophila nonmuscle myosin II has multiple essential roles in imaginal disc and egg chamber morphogenesis. Development. 1996;122:1499–511. doi: 10.1242/dev.122.5.1499. [DOI] [PubMed] [Google Scholar]
- 51.Silver DL, Montell DJ. Paracrine signaling through the JAK/STAT pathway activates invasive behavior of ovarian epithelial cells in Drosophila. Cell. 2001;107:831–41. doi: 10.1016/s0092-8674(01)00607-9. [DOI] [PubMed] [Google Scholar]
- 52.Beccari S, Teixeira L, Rorth P. The JAK/STAT pathway is required for border cell migration during Drosophila oogenesis. Mech Dev. 2002;111:115–23. doi: 10.1016/s0925-4773(01)00615-3. [DOI] [PubMed] [Google Scholar]
- 53.Ghiglione C, Devergne O, Georgenthum E, Carballes F, Medioni C, Cerezo D, et al. The Drosophila cytokine receptor Domeless controls border cell migration and epithelial polarization during oogenesis. Development. 2002;129:5437–47. doi: 10.1242/dev.00116. [DOI] [PubMed] [Google Scholar]
- 54.Starz-Gaiano M, Melani M, Wang X, Meinhardt H, Montell DJ. Feedback inhibition of Jak/STAT signaling by apontic is required to limit an invasive cell population. Dev Cell. 2008;14:726–38. doi: 10.1016/j.devcel.2008.03.005. [DOI] [PubMed] [Google Scholar]
- 55.Zeidler MP, Perrimon N, Strutt DI. Polarity determination in the Drosophila eye: a novel role for unpaired and JAK/STAT signaling. Genes Dev. 1999;13:1342–53. doi: 10.1101/gad.13.10.1342. [DOI] [PMC free article] [PubMed] [Google Scholar]
- 56.Johansen KA, Iwaki DD, Lengyel JA. Localized JAK/STAT signaling is required for oriented cell rearrangement in a tubular epithelium. Development. 2003;130:135–45. doi: 10.1242/dev.00202. [DOI] [PubMed] [Google Scholar]
- 57.Zeidler MP, Perrimon N. Sex determination: co-opted signals determine gender. Curr Biol. 2000;10:682–4. doi: 10.1016/s0960-9822(00)00686-2. [DOI] [PubMed] [Google Scholar]
- 58.Devergne O, Ghiglione C, Noselli S. The endocytic control of JAK/STAT signalling in Drosophila. J Cell Sci. 2007;120:3457–64. doi: 10.1242/jcs.005926. [DOI] [PubMed] [Google Scholar]
- 59.Ghiglione C, Devergne O, Cerezo D, Noselli S. Drosophila RalA is essential for the maintenance of Jak/Stat signalling in ovarian follicles. EMBO Rep. 2008;9:676–82. doi: 10.1038/embor.2008.79. [DOI] [PMC free article] [PubMed] [Google Scholar]
- 60.Eulenberg KG, Schuh R. The tracheae defective gene encodes a bZIP protein that controls tracheal cell movement during Drosophila embryogenesis. EMBO J. 1997;16:7156–65. doi: 10.1093/emboj/16.23.7156. [DOI] [PMC free article] [PubMed] [Google Scholar]
- 61.Gellon G, Harding KW, McGinnis N, Martin MM, McGinnis W. A genetic screen for modifiers of Deformed homeotic function identifies novel genes required for head development. Development. 1997;124:3321–31. doi: 10.1242/dev.124.17.3321. [DOI] [PubMed] [Google Scholar]
- 62.Lie YS, Macdonald PM. Apontic binds the translational repressor Bruno and is implicated in regulation of oskar mRNA translation. Development. 1999;126:1129–38. doi: 10.1242/dev.126.6.1129. [DOI] [PubMed] [Google Scholar]
- 63.Bach EA, Ekas LA, Ayala-Camargo A, Flaherty MS, Lee H, Perrimon N, et al. GFP reporters detect the activation of the Drosophila JAK/STAT pathway in vivo. Gene Expr Patterns. 2007;7:323–31. doi: 10.1016/j.modgep.2006.08.003. [DOI] [PubMed] [Google Scholar]
- 64.Li J, Li W, Calhoun HC, Xia F, Gao FB, Li WX. Patterns and functions of STAT activation during Drosophila embryogenesis. Mech Dev. 2003;120:1455–68. doi: 10.1016/j.mod.2003.09.004. [DOI] [PMC free article] [PubMed] [Google Scholar]
- 65.Bai J, Montell D. Eyes absent, a key repressor of polar cell fate during Drosophila oogenesis. Development. 2002;129:5377–88. doi: 10.1242/dev.00115. [DOI] [PubMed] [Google Scholar]
- 66.Silver DL, Geisbrecht ER, Montell DJ. Requirement for JAK/STAT signaling throughout border cell migration in Drosophila. Development. 2005;132:3483–92. doi: 10.1242/dev.01910. [DOI] [PubMed] [Google Scholar]
- 67.Tulina N, Matunis E. Control of stem cell self-renewal in Drosophila spermatogenesis by JAK-STAT signaling. Science. 2001;294:2546–9. doi: 10.1126/science.1066700. [DOI] [PubMed] [Google Scholar]
- 68.Kiger AA, Jones DL, Schulz C, Rogers MB, Fuller MT. Stem cell self-renewal specified by JAK-STAT activation in response to a support cell cue. Science. 2001;294:2542–5. doi: 10.1126/science.1066707. [DOI] [PubMed] [Google Scholar]