

Abstract
The G-quadruplex structural motif of DNA has emerged as a novel and exciting target for anticancer drug discovery. The human telomeric G-quadruplex consists of a single strand repeat of d[AGGG(TTAGGG)3] that can fold into higher-order DNA structures. Small molecules that selectively target and stabilize the G-quadruplex structure(s) may serve as potential therapeutic agents and have garnered significant interest in recent years. In the work presented here, the anticancer agent, actinomycin D, is demonstrated to bind to and induce changes in both structure and stability to both the Na+ and K+ forms of the G-quadruplex DNA. The binding of actinomycin D to the G-quadruplex DNAs are characterized by intrinsic association constants of approximately 2 × 10⁵ M−1 (strand), 2:1 molecularity, and are shown to be enthalpically driven with binding enthalpies of approximately −7 kcal/mol. The free Na+ or K+ forms of the quadruplex structures differ in melting temperatures by approximately 8°C (60 and 68°C, respectively), whereas both forms, when complexed with actinomycin D are stabilized with melting temperatures of approximately 79°C. The induced CD signals observed for the actinomycin D-G-quadruplex complexes may indicate that the phenoxazone ring of actinomycin D to be stacked on the G-tetrad rather than intercalated between adjacent G-tetrads. Complex formation with actinomycin D results in changes to both the Na+ or K+ structural isoforms to “ligand-bound” complexes having similar structural properties and stabilities.
The DNA structural motif known as the G-quadruplex has recently emerged as a novel and exciting target for the discovery and design of new classes of anticancer agents (1–3). DNA sequences that can form G-quadruplex structures are found extensively throughout the genome and are located in biologically relevant regions. These sequences and their corresponding quadruplex structures were first observed to exist in telomeric regions of DNA, located at the terminal ends of chromosomes (4–6). More recently, G-quadruplex forming sequences have been mapped to the promoter regions of a number of genes and oncogenes (7–9). It is postulated that G-quadruplex structures may serve important biological functions in the regulation of gene expression (10–12). Hence, these findings have led to an increased interest in the structural and functional features of G-quadruplex structural motif and offers potentially novel targets for the development of small molecules that could selectively target and stabilize the quadruplex structure.
The G-quadruplex consists of stacked G-tetrads connected by lateral, diagonal, or external loops and has been shown to possess a wide range of structural polymorphism within guanine rich sequences that exhibit the motif. Burge and coworkers and Dai and coworkers recently published extensive reviews of the topologies of quadruplex DNA structures (13, 14). The observed polymorphism(s) found for G-quadruplex structures include differences in molecularity, strand orientation, loop characteristics, and structural isomers based on selected cation buffer conditions. The structural stability of quadruplex DNAs have received considerable attention and are reported in a detailed review by Chaires and coworkers (15).
Common features of small molecules that have been found to interact with quadruplex DNA structures include heterocyclic planar aromatic ring systems that have the ability to “cap” the terminal ends of quadruplex structures. Hurley and coworkers have utilized the porphyrin ring system as a structural foundation of perhaps the most well known quadruplex binding ligand, telomostatin (3, 16, 17). In recent years, there has been considerable effort devoted toward the discovery of additional DNA binding ligands that would selectively target quadruplex DNA structures. A thorough review of these studies are reported by Monchaud et al (18).
Efforts in our laboratory have focused on the structural and energetic properties describing the binding of actinomycin D to a variety of nucleic acid structural motifs. Actinomycin D consists of a heterocyclic phenoxazone ring that serves as the interacalative portion of the ligand and two cyclic pentapeptide side chains that have extensive interactions within the minor groove of duplex DNA. In duplex DNA, actinomycin D has historically been demonstrated to bind preferentially to the 5′-dGpC-3′ sequence (19); however, more recently the binding of actinomycin D has been shown to exhibit greater promiscuity in both the base sequence selectivity as well as the DNA structure (20–24). As early as 1994, our laboratory demonstrated the ability of actinomycin D to bind to duplex DNA containing G-tracts which led to our hypothesis that actinomycin D may also interact with the G-quadruplex DNA structure(s) and possibly potentiate biological response(s).
In the work presented here, we report such an interaction between actinomycin D and the human telomeric sequence, d[AGGG(TTAGGG)3]. This 22-mer deoxyoligonucleotide forms an intramolecular G-quadruplex structure that can be used to probe the binding of ligands including actinomycin D. The studies reported here provide key insights into the structural and thermodynamic features that characterize the binding of actinomycin D to the G-quadruplex DNA motif.
Materials and Methods
Sample Preparation
The human telomeric 22-mer of sequence 5′-AGGGTTAGGGTTAGGGTTAGGG-3′ was purchased from Midland Reagents, Midland, TX and purified by reverse phase chromatography. Stock DNA solutions were prepared by dissolving in K-BPES (0.01 M KH2PO4, 0.01 M K2HPO4, 0.001 M EDTA, 0.1 M KCL) or Na-BPES (0.01 M NaH2PO4, 0.01 M Na2HPO4, 0.001 M EDTA, 0.1 M NaCL) buffer at pH 7 for 24 hours at 4°C. The deoxyoligonucleotide samples were heated to 90°C for 5 min followed by cooling to 4°C at a cooling rate of 0.1°C per min using a MJ Research Minicycler to ensure formation of the G-quadruplex structure is formed which was checked by circular dichroism spectroscopy. The DNA concentrations were determined by UV-visible spectroscopy using a Cary 100 UV-Visible spectrophotometer (Varian, Inc.) at 90°C and a molar extinction coefficient of ε260 = 228,500 M−1cm−1 (25). Actinomycin D was purchased from Sigma-Aldrich and used without further purification. The drug was in the appropriate BPES buffer, dissolved overnight at 4°C and filtered through a Millipore 0.45 μM syringe filter prior to use. Actinomycin D concentrations were determined by UV-visible spectroscopy using a Cary 100 UV-visible spectrophotometer (Varian, Inc.) at 25°C using the extinction coefficient ε440 = 24,500 M−1 cm−1 (23)
Isothermal Titration Calorimetry Studies
ITC experiments were performed using a Microcal VP-ITC at 25°C. All samples were degassed prior to use. The sample cell was filled to capacity ~1.6mL with quadruplex DNA (10 uM, (strand)), and actinomycin D (200 uM) was injected in 25 aliquots of 10 uL each with 250 seconds resting time between injections. Three replicate titrations were performed and the resulting data were integrated and analyzed using the single-site binding model and fit by a non-linear least squares fitting algorithm (Microcal Origin 7.1 software) to yield the relevant thermodynamic parameters.
Differential Scanning Calorimetry Studies
DSC experiments were performed with a Microcal VP-DSC. The concentrations of the DNA and actinomycin D were 125 μM (strand) and 250 μM ligand. Experiments were conducted over the temperature range of 15–100°C with a scan rate of 90°C/h. Multiple heating and cooling scans were conducted in order to determine reversibility. Analyses of DSC data were performed with Microcal Origin 7.1 software in which all data were analyzed with a two transition non-two-state model.
Circular Dichroism Studies
CD experiments were conducted using an AVIV 400 circular dichroism spectrophotometer (Aviv, Inc). All experiments were conducted at 25°C in 1 cm pathlength rectangular cells. The data were collected from 220–350 nm at every 1 nm with a bandwidth of 3 nm. The titration of quadruplex DNA with actinomycin D was performed by injecting 37.5 μL 0.5 mM actinomycin D stock solution into a cell containing 4 μM (strand) quadruplex DNA. Each injection represents a 0.5 molar equivalent of the DNA concentration. After each injection, the solution was stirred and allowed to equilibrate for 10 minutes prior to measuring the CD spectrum. Contributions from the free actinomycin D and buffer solution were subtracted from each subsequent measurement. To measure the induced CD, the samples were prepared at saturating conditions (all actinomycin D is in bound form). The final concentration of actinomycin D and quadruplex DNA is 10 μM and 100 mM (strand), respectively. The CD spectra were collected from 335 to 500 nm at every 1 nm using a bandwith of 3 nm.
Results
CD Studies
CD spectroscopy was used to examine the structural characteristics of the structural features of quadruplex DNA (26). Representative CD spectra for the Na+ and K+ structural conformations of the quadruplex structures can be observed in Figure 1. The Na+ isoform displays a characteristic antiparallel G-quadruplex with maxima at 295 and 245 nm and a minimum at 265 nm (27, 28). In contrast, the K+ structural isoform exhibits markedly different CD spectral characteristics due to the mixed hybrid (both parallel and antiparallel strand orientations) with two maxima at 290 and 265 nm, a trough at 277 and a minimum at 238 nm as previously described by Yang and coworkers (25, 29). The mixed parallel and anti-parallel orientations of the phosphate backbone results in a CD spectrum with both parallel and anti-parallel characteristics and shows a maximum at 295 nm, representing the antiparallel portion, and the shoulder at 265 nm and minimum at 240 nm corresponding to the parallel portions of the quadruplex structure.
Figure 1.
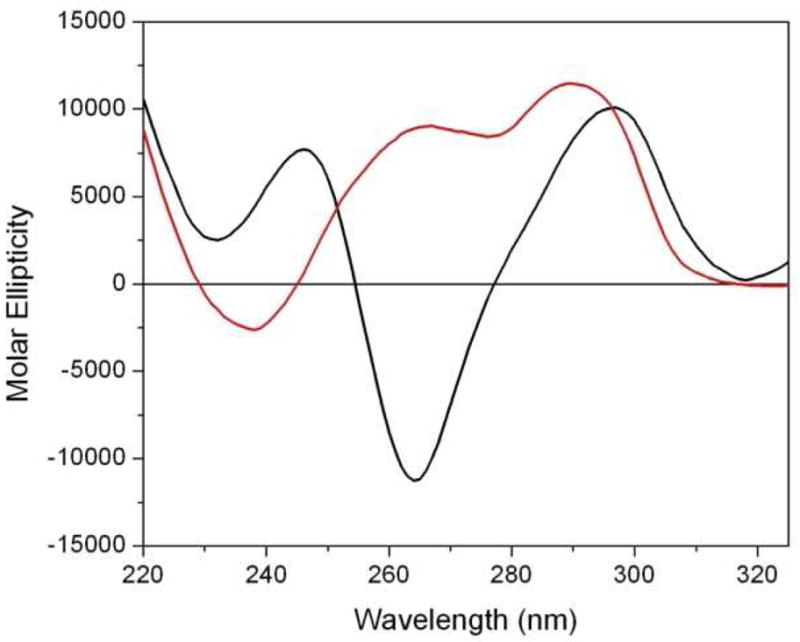
Representative CD spectra of the Na+ (black) and K+ (red) of structural isoforms of quadruplex DNA. CD spectra were recorded on an Aviv 400 CD spectrophotometer at 25°C in 1-cm pathlength cuvettes in 0.01 M (Na or K) phosphate buffer, pH 7.0 and 0.001 M EDTA. The deoxyoligonucleotide concentrations for both DNAs were 12.5 μM (strand). An averaging time of 4 sec at each nm was used over the range of 220 to 320 nm.
CD titration experiments were used to investigate actinomycin D interactions and any subsequent structural perturbations to the quadruplex structures that may result from complex formation. Figure 2A shows the incremental titration of actinomycin D into the Na+ form of the G-quadruplex. As observed from these data, titration of actinomycin D into the quadruplex DNA results in significant changes to the CD spectrum; including the observation of an isoelliptical point at 260 nm, which suggests the presence of both free and bound quadruplex DNA in solution. With increasing actinomycin D binding, the CD signal of the quadruplex DNA is shown to exhibit significant shifts in the maximum from 295 nm to 280 nm, as well a complete loss of positive ellipticity to a negative ellipticity at 245 nm. Similarly, the titration of actinomycin D into the K+ form of the G-quadruplex as monitored by CD is shown in Figure 2B. An isoelliptical point is observed at 265 nm, again suggesting the presence of both free and bound quadruplex DNA in solution. As more actinomycin D binds to the K+ form, the trough at 277 nm disappears and becomes a maximum at 277 nm. The minimum at 238 nm exhibits a red shift to 245nm and becomes more pronounced. Although the Na+ and K+ forms of the quadruplex DNAs have very distinctive CD spectral characteristics, the CD spectra of both quadruplex forms when complexed with actinomycin D converge to very similar CD spectra with maxima ~280 nm and minima ~245–250 nm indicating similarities in structural characteristics.
Figure 2.

Changes to the CD spectra of the Na+ form (panel A) and the K+ form (panel B) of quadruplex DNAs are observed upon binding of actinomycin D. Experiments were performed at 25°C in 0.01 M (Na or K) phosphate buffer, pH 7.0 and 0.001 M EDTA. Half-mole equivalents of actinomycin D were titrated into a 1-cm CD cell containing 12.5 μM (strand) of quadruplex DNA. After each 37.5 μL injection of ligand, the drug-DNA solution was mixed and allowed to equilibrate for 10 minutes prior to measuring each spectrum. An averaging time of 4 sec at each nm was used over the range of 220 to 320 nm. Contributions from free actinomycin D and buffer were subtracted from each subsequent measurement. Scvitzky-Golay smoothing was applied to the raw spectral data. Figure 2C shows the CD spectra of the Na+ (black) and K+ (red) forms of G-quadruplex DNAs at the endpoints of titration (saturation) with actinomycin D.
In order to investigate the mode of binding, CD experiments were designed to discern whether induced CD signals could be observed upon formation of the actinomycin D-G-quadruplex complex. As observed in Figure 3, actinomycin D is shown to have a very weak CD signal (black line) due to the symmetric nature of the molecule. Upon complex formation with duplex DNA, the intercalation of the phenoxazone ring of actinomycin D between the d(GpC) step results in the induction of two negative CD signal at 375 and 440 nm (i.e. induced CD signals). The presences of these signals are indicative of an intercalative mode of binding. In the case of actinomycin D binding to the Na+ form (red line) and K+ form (blue line) quadruplex DNA structures, induced CD signals are observed at both 375 nm and 440 nm; however, while the 375 nm band is negative, the 440 nm band is positive. A positive band at 440 nm indicates that the complexes formed by actinomycin D with both forms of quadruplex DNA are not purely intercalative, but involve end-stacking on the terminal G-tetrad of the quadruplex structures.
Figure 3.
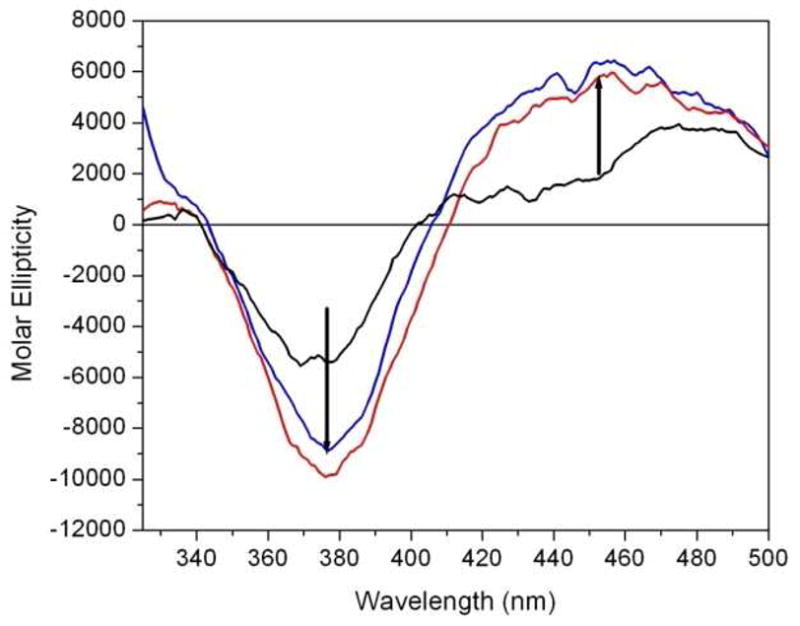
The induced CD spectra of actinomycin D complexed with the Na+ (red) and K+ (blue) forms of quadruplex DNAs. These induced CD signals were obtained by mixing actinomycin D and quadruplex DNA at 25°C (in appropriate Na+ or K+ buffers as described in the legend of Figure 1) and under conditions ensuring that all of the actinomycin in solution is complexed to the DNA. This figure shows the CD spectrum of free actinomycin D (black), actinomycin D bound to the Na+ form of the quadruplex DNA (red), and actinomycin D bound to the K+ form of the quadruplex DNA (blue). Induced CD signals are observed at 380 nm (negative) and 440 nm (positive). An averaging time of 4 sec at each nm was used over the range of 340 to 500 nm.
Isothermal Titration Calorimetry Studies
Thermodynamic and stoichiometric properties associated with the formation of actinomycin D complexes with quadruplex DNAs were determined by isothermal titration calorimetry. Figure 4 shows raw ITC data (panels A and B) as well as the integrated heats of complex formation for both the Na+ and K+ quadruplex DNAs, respectively, upon titration with the DNA binding ligand. The thermodynamic parameters derived from these data are summarized in Table 1. The time between injections was 250 seconds. The geometry of the injection peak revealed that with this resting time, the reaction returned to equilibrium prior to subsequent injections. From these studies, we observe that formation of the actinomycin D-G-quadruplex complex(es) for both the Na+ and K+ forms are enthalpically driven with binding enthalpies (ΔHobs) approximating −7 kcal/mol (−7.3 kcal/mol for the Na+ form and −6.7 kcal/mol for the K+ form). The DNA binding affinities were determined to be 2.1 × 10⁵ M−1 (strand) for interaction of actinomycin D to the Na+ quadruplex structure. Similarly, the binding affinity of actinomycin D to the K+ quadruplex form was found to be 2.3 × 10⁵ M−1 (strand). Interestingly, stoichiometries of approximately 0.5(actinomycin D per quadruplex) were observed for both the Na+ and K+ quadruplex complexes with actinomycin D, indicating that one drug molecule could effectively bridge two quadruplex DNA structures to form a 2:1 complex, supporting our hypothesis of “end-stacking” to the terminal G-tetrad.
Figure 4.

Representative data from ITC experiments showing the titration of actinomcyin D with the Na+ (panel A) and the K+ (panel B) forms of quadruplex DNAs. ITC experiments were performed at 25°C (in appropriate Na+ or K+ buffers as described in the legend of Figure 1). All solutions were degassed using the Microcal thermovac 10 min prior to loading. Injections of 10 μL of stock actinomycin D solution (200 μM) into quadruplex DNA solution (10 μM strand)with 250 seconds resting time between injections. The top panels represent the raw heats of binding generated with each addition of actinomycin D and bottom panels are the integrated heats in kcal/mol of injectant. Thermodynamic parameters were derived from the single site binding model incorporated into the Microcal Origin 7.1 software.
Table 1.
Thermodynamic properties associated with the interactions of actinomycin D with the Na+ and K+ structural isoforms of quadruplex DNA.
| ITC | n (strand) | Kint (M−1) | ΔG° (kcal/mol) | ΔH° (kcal/mol) | TΔS° (kcal/mol) |
|---|---|---|---|---|---|
| Na+ Quadruplex | 0.5 ± 0.03 | 2.1 ± 0.3 × 10⁵ | −7.3 ± 0.1 | −7.3 ± 0.1 | −0.07 |
| K+ Quadruplex | 0.6 ± 0.02 | 2.3 ± 0.1 × 10⁵ | −7.3 ± 0.2 | −6.7 ± 0.1 | 0.60 |
| DSC | Tm1a(°C) | ΔH1b (cal/mol) | ΔHv1c (cal/mol) | Tm2d (°C) | ΔH2e (cal/mol) | ΔHv2f (cal/mol) | |
|---|---|---|---|---|---|---|---|
| Na+ | Quadruplex | 39 | 1.3 × 10³ | 3.9 × 10⁴ | 60 | 2.4 × 10⁴ | 5.2 × 10⁴ |
| Quadruplex +ActD | 65 | 4.9 × 10³ | 1.5 × 10⁴ | 79 | 1.5 × 10⁴ | 9.6 × 10⁴ | |
| K+ | Quadruplex | 60 | 5.6 × 10³ | 4.5 × 10⁴ | 68 | 1.6 × 10⁴ | 6.9 × 10⁴ |
| Quadruplex +ActD | 64 | 7.1 × 10³ | 6.3 × 10⁴ | 79 | 1.1 × 10⁴ | 9.8 × 10⁴ | |
Tm1 is defined as the lower temperature transition;
ΔH1 is defined as the calorimetric enthalpy for the low temperature transition;
ΔHv1 is defined as the van’t Hoff enthalpy of low temperature transition;
Tm2 is is defined as the high temperature transition;
ΔH1 is is defined as the calorimetric enthalpy for the high temperature transition;
ΔHv2 is defined as the van’t Hoff enthalpy of high temperature transition.
Differential Scanning Calorimetry Studies
Thermal melting profiles were obtained for both the free and bound Na+ and K+ forms (Figure 5A and 5C, respectively) of the G-quadruplex DNA structures using differential scanning calorimetry. These studies are used to discern the thermodynamic stabilities of the free and actinomycin D complexed quadruplex structures and are reported in Table 1. Using Origin 7.1, thermograms for the free and complexed DNA structures were analyzed using a two transition non-two state model. These thermograms reveal that both the Na+ and K+ forms of these DNA quadruplexes exhibit two peaks. Replicate heating and cooling scans were conducted in order to demonstrate reversibility of the denaturation of the quadruplex structures. The melting transitions of both the free and bound forms of the Na+ and K+ quadruplex DNAs were shown to be highly reversible (data not shown). The observation of two melting transition peaks has been previously reported by a number of investigators for G-quadruplex structures with base sequences similar to the d[AGGG(TTAGGG)3] used in this study (25, 30, 31). Figure 5A shows the thermogram for the free form of the K+ quadruplex. Panel B shows the concomitant thermogram of the K+ quadruplex DNA when complexed with actinomycin D. In Fig. 5A, the free form of the quadruplex DNA is shown to consist of two transitions; the first transition exhibits a melting temperature at 60°C and the second at 68°C. Upon binding of actinomycin D, both transitions are observed to stabilize to higher temperatures of 64°C and 79°C, respectively. For the Na+ form of the quadruplex DNA, panels C and D in Figure 5 depict the thermograms of the free and bound forms, respectively. As observed for the K+ form, two transitions are evident with melting temperatures of 40°C and 60°C, respectively; however, upon actinomycin D binding, both transitions are stabilized to higher temperatures, 65°C and 79°C, respectively.
Figure 5.
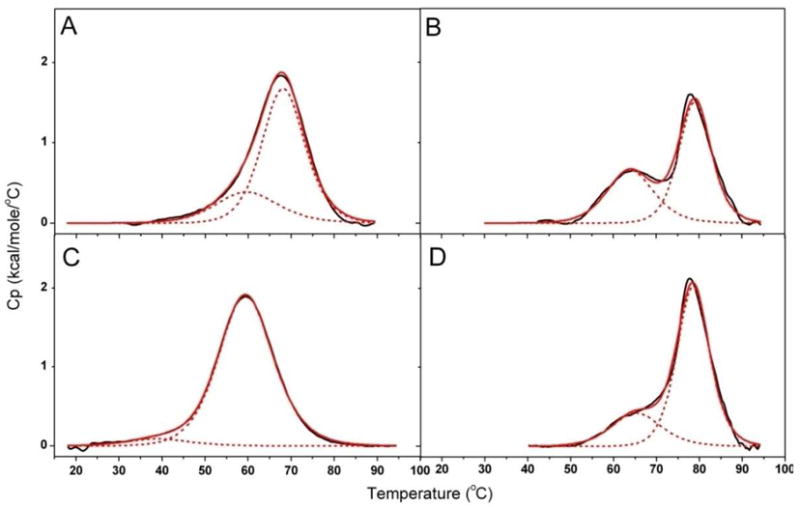
DSC thermograms of the K+ form of quadruplex DNA (panel A, no actinomycin D and panel B, with actinomycin D) and the Na+ form of quadruplex DNA (panel C, no actinomycin D and panel D, plus actinomycin D) Experiments were performed in appropriate (Na or K) 0.01 M phosphate buffer, pH 7.0 and 0.001 M EDTA. Quadruplex DNA concentrations were 125 μM for both the Na+ or K+ forms of quadruplex DNAs. Actinomycin D concentrations were 250 μM. Heating temperatures ranged from 15 to 100 °C with a scan rate of 1.5 °C per min. Buffer-buffer baseline scans were subtracted from DNA and ligand-DNA scans. Progressive baseline subtraction procedures were used to provide the corrected DSC scans for data analyses. The two transition non-two state model (Microcal Origin 7.1) was used to analyze the resultant DSC scans.
Discussion
In this work, we demonstrate the binding of actinomycin D to both the structurally distinct Na+ and K+ forms of quadruplex DNA structural motifs. These binding studies utilized a variety of spectroscopic and calorimetric methods to probe the structural and thermodynamic features associated with complex formation. Upon binding of actinomycin D, significant structural changes to both the Na+ and K+ forms of the DNA quadruplexes are indicated by the change in maxima and minima as well as losses in ellipticity as observed from the CD spectra. Prior to addition of actinomycin D to the Na+ or K+ forms of quadruplex DNA solutions, the two structurally distinct species exhibit unique CD signals. However, upon binding actinomycin D, both species are demonstrated to undergo significant changes as evidenced by their CD spectra, and at saturation both species are shown to converge to very similar CD signals, indicating similarities in the structures of the bound quadruplex DNA species. Although considerable care must be taken in the interpretation of CD spectra from ellipticity wavelengths to unequivocal structural determinations (26), the results observed in this study are indicative that upon formation of a complex with actinomycin D, the two structurally distinct quadruplex species converge into common bound conformations that have markedly similar CD spectra. DNA quadruplexes possess the ability to exist in many isomeric forms that have considerable variation in loop orientation, the number of tetrads, and strand molecularity. Chaires and coworkers have stated that there are at least 26 possible structures that can be formed; however, only 6 have being observed thus far in vitro (15). Current solution structures for the quadruplex exist for the anti-parallel Na+ form as solved by NMR (32). Additionally, the NMR structure of the K+ form of a mixed parallel anti-parallel structure has been reported (33), as well as an X-ray diffraction structure that features a more compacted G-quadruplex consisting of edgewise loop orientations (34).
The characteristic CD signals for different quadruplex structures are thought to arise from alterations of the glycosidic bond angles of guanine and sugar phosphate backbone. The CD spectra presented in Figure 1 are characteristic for the Na+ and K+ forms and reveal typical maxima and minima for the anti-parallel and mixed hybrid parallel structures (25, 26, 33). The observed shift in CD spectra for both the Na+ and K+ forms of the quadruplex from the 295 nm (characteristic of anti-parallel structure) to a lower wavelength centered around 280 nm as well as the observation of negative ellipticity at 245 nm is characteristic of a parallel stranded quadruplex. From the CD data presented here, complex formation with actinomycin D is shown to drive a change in the quadruplex structure. We postulate that the pronounced changes in CD signals, for both the Na+ and K+ forms of the quadruplex DNAs, and convergence to relatively similar spectra arise as a result of the quadruplex DNA structurally rearranging to more favorably accommodate the binding geometry of the actinomycin D. Such phenomena have been observed previously wherein DNA binding ligands were shown to direct the folding of the G-quadruplex into an alternate structure. In these studies, Hurley and coworkers demonstrated the accelerated assembly of intermolecular quadruplex DNA structures by TMPyP4 (35). Similarly, Hurley and coworkers reported the binding of telemostatin to the G-quadruplex in the absence of Na+ and K+ ions that resulted in a structural change to the anti-parallel form of the G-quadruplex (36). Recent studies reported by Chaires et al (37) examining binding kinetics of Na+ and K+ and the ligand to G-quadruplex DNA reveal a rapid phase complete within 5 milliseconds followed by two slower phases of 40–50 seconds and 600–800 seconds. Chaires attributes these relaxation times to a rapid cation binding phase followed by slower kinetics of quadruplex refolding. Binding of the TMPyP4 was postulated to facilitate a conformational switch from the Na+ antiparallel structure to the K+ hybrid. Based on the evidence presented in their manuscript, a complete refolding of the quadruplex DNA requires extended equilibration times. The CD data presented in Figure 2C indicates that the binding of actinomycin D the Na+ form of the G-quadruplex structure induces a structural change to the quadruplex DNA whose CD-spectrum more closely resembles that of the K+ isoform. These data are supportive of Chaires’ hypothesis of a “conformational switch” that is induced by a DNA binding ligand. However, additional structural data are required to discern the exact nature of the actinomycin D-G-quadruplex complexes. Of particular interest and unique to the study that is presented here is that actinomycin D is shown to bind to both the Na+ and K+ forms of the quadruplex and directs both quadruplex structures to converge to unique “complexed” structures that have very similar CD characteristics as shown in Figure 2C. The thermodynamic binding parameters for binding of actinomycin D to both the Na+ and K+ structural isoforms of the G-quadruplex DNAs are quite similar, regardless of the initial starting structural form. From ITC studies, similar binding affinities (2.1 and 2.3 × 10⁵ M−1 (strand)) for the binding of actinomycin D to the Na+ and K+ structural isoforms of G-quadruplex DNAs, respectively, are observed, The binding of actinomycin D to both the Na+ and K+ forms of the quadruplex DNA were shown to exhibit favorable binding energies (ΔG ~ −7.3 kcal/mol). As shown in Table I, parsing of the energetic components reveal that the binding of actinomycin D to both G-quadruplex structures to be enthalpy driven with ΔH ~ −7 kcal/mol. The binding stoichiometries indicate that upon complex formation, actinomycin D is complexed with two quadruplex structures. Literature reports of binding stoichiometries for small molecule interactions with quadruplex DNA are highly varied; however, terminal stacking of heterocyclic planar ligands on the plane of the G-tetrad have been observed for several co-crystal complex structures (38). Indeed, in the case of daunomycin, the anthracycline ring is shown to stack on the terminal G-tetrad and may offer insights into the mode of binding for actinomycin D to the quadruplex DNA (39).
In an effort to discern structural features associated with the actinomycin D-quadruplex DNA complex, experiments were designed to probe the presence of an induced CD signal. In duplex DNA, actinomycin D has been demonstrated to intercalate between adjacent dGpC steps, resulting in an induced CD signal, with negative bands observed at 375 and 440 nm (40). In the case of actinomycin D binding to both the Na+ and K+ forms of quadruplex DNAs, induced CD signals for both complexes are observed. As described above, negative induced CD bands are observed at 375 nm. In contrast to intercalative binding which exhibits an additional negative band at 440 nm, we observe an induced signal at 440 nm; however, this band is now positive. These observations of induced CD signals reveal an atypical binding interaction (i.e., nonintercalative) and supports our premise of “end-stacking” of the phenoxozone to the terminal G-tetrad of the quadruplex DNA. There are several examples of mixed (negative and positive) induced CD signals including the binding of actinomycin D to non-dGpC containing sequences (24) as well as stacking with d(GTP) (41).
The structural stabilities of the quadruplex DNA with and without actinomycin D were probed by differential scanning calorimetry (DSC). Figures 5A and 5C reveals thermograms of the K+ and Na+ structural isoforms of the G-quadruplex DNA, respectively, in the absence of actinomycin D. These melting profiles consist of two transitions for both the K+ and Na+ forms with the predominant melting transition at 60°C for the Na+ and for the K+ form, a more stable transition observed at 68°C. These values are in excellent agreement with previously published results as summarized by Lane et al. (15). Upon binding of actinomycin D to the Na+ and K+ forms of G-quadruplex DNAs, DSC thermograms of both the ligand-DNA complexes are observed to converge with comparable melting transitions at 79 °C. These data provide further evidence that actinomycin D binds to different G-quadruplex structural isoforms (Na+ and K+ forms) and the resulting ligand-DNA complexes that are formed are similar in structure and stability. The presence of two peaks for the melting transitions may be indicative of the existence of different structural isomers in solution (30) or the presence of a stable intermediate that is formed in the unfolding pathway. In 2007, Sheardy and Chaires identified the presence of a stable unfolding intermediate in the human telomeric sequence in K+ solution using the application of singular value decomposition (SVD) to quadruplex unfolding studies (30). The studies presented here suggest that upon binding actinomycin D, both the major and minor DNA components observed in the DSC thermograms form complexes with the ligand and both components are converted to more energetically stable complexes. In the case of the K+ quadruplex DNA, the lower melting transition component is stabilized by 4°C, from 60 to 64°C; however, for the Na+ form, the lower melting transition component is stabilized from 39 to 65°C. Although our data do not differentiate whether this lower melting transition component is a structural isomer or stable unfolding intermediate of the predominant Na+ and K+ quadruplex DNA structure, it is clear that the lower melting transition component for both the Na+ and K+ quadruplex forms are stabilized upon complex formation with actinomycin D. Similarly, the dominant melting transition components observed for both the Na+ and K+ quadruplex forms are shown to be significantly stabilized upon complex formation with actinomycin D. The melting temperatures of the K+ and Na+ G-quadruplexe structural isoforms are determined to be 68°C and 60°C, respectively. DSC thermograms obtained in the presence of actinomycin D reveal both major melting transition components to exhibit significant stabilization; the K+ form is shifted to 79°C (an 11°C stabilization) and the Na+ form to 79°C (a 19°C stabilization). These data are indicative of the strong propensity of actinomycin D to form stable interactions with quadruplex DNAs resulting in the formation of bound complexes whose thermal stabilities are markedly enhanced from native quadruplexes and converge to very similar bound states.
In the data reported here, we present a novel interaction between the antibiotic actinomycin D and both the Na+ and K+ structural isoforms of quadruplex DNA. The CD and calorimetric data demonstrate that actinomycin D forms strong stable complexes with both cationic forms of the quadruplex DNA in a thermodynamic and structurally similar manner. Both the CD and DSC data reveal that initial quadruplex DNA structures that are unique for either Na+ or K+ environments undergo modifications to accommodate the formation of the actinomycin D complex and the resulting complexes that are formed are similar in both structure and enhanced stability. Although the exact structure of the actinomycin D-quadruplex DNA complex(es) remain unknown, the CD data is suggestive of a more parallel stranded quadruplex. The observation of a 2:1 (quadruplex to ligand) binding ratio as well as the induced CD signals upon complex formation provide considerable insights into a proposed binding mechanism for actinomycin D to the quadruplex DNA. Our studies are consistent with a stacking of the phenoxozone ring of actinomycin D to a terminal G-quartet of the quadruplex DNA. We speculate that this interaction is further stabilized by the interaction of the pentapeptide sidechains of actinomycin D with the shallow grooves of the face of the quadruplex DNA formed by the sugar phosphate backbone. It is plausible for the ligand to recruit a second quadruplex structure that would effectively stack its terminal G-quartet to the opposite face of the phenoxozone ring and allow the second pentapeptide sidechain to orient in the grooves of the second quadruplex DNA, resulting in the 2:1 binding stoichiometry.
In 2005, Jovin and coworkers examined the binding of actinomycin D to single stranded DNA and demonstrated several key elements of actinomycin D binding that are pertinent for the binding of this ligand to quadruplex DNA (42); the binding is directed by the stacking of the planar phenoxazone ring with guanine residues. This stacking interaction can occur from either face of the phenoxazone ring, and serves as an anchor for structural rearrangements of the DNA strands which appear to be quite mobile, allowing the DNA to find the most stable conformation around the actinomycin D anchor. The principle driving force for the binding of actinomycin D to a single-stranded deoxyoligonucleotide was postulated to be through an initial stacking and hydrogen bonding between the phenoxazone chromophore and the guanine residue. Jovin observed that the stacked actinomycin D-guanine complex served as an anchor that allowed rearrangements of the DNA strands to orient in an energetically stable conformation with the two pentapeptide sidechains of the actinomycin D. Similarly, we propose that the binding of actinomycin D to quadruplex DNA is facilitated through the stacking of the phenoxazone chromophore to the terminal G-quartet of the quadruplex DNA. This stacked interaction between the ligand and DNA serves as an anchor, allowing the DNA strands to reorient with respect to the rigid cyclic pentapeptide side chains of the actinomycin D and results in an actinomycin D-quadruplex DNA complex whose quadruplex DNA structure has changed to a more energetically stable conformation to accommodate the actinomycin D sidechains.
Acknowledgments
JSH was a trainee under National of Institute of Health grant T32 EB00431A2, SCB funded by Barry M. Goldwater Scholarship.
Abbreviations
- CD
Circular Dichroism
- ITC
isothermal titration calorimetry
- DSC
differential scanning calorimetry
Contributor Information
Jason S. Hudson, Email: jshudson@uab.edu.
Sonja C. Brooks, Email: sbrooks4@uab.edu.
David E. Graves, Email: dgraves@uab.edu.
References
- 1.Han H, Hurley LH. G-quadruplex DNA: a potential target for anti-cancer drug design. Trends Pharmacol Sci. 2000;21:136–142. doi: 10.1016/s0165-6147(00)01457-7. [DOI] [PubMed] [Google Scholar]
- 2.Hurley LH. Secondary DNA structures as molecular targets for cancer therapeutics. Biochem Soc Trans. 2001;29:692–696. doi: 10.1042/0300-5127:0290692. [DOI] [PubMed] [Google Scholar]
- 3.Sun D, Thompson B, Cathers BE, Salazar M, Kerwin SM, Trent JO, Jenkins TC, Neidle S, Hurley LH. Inhibition of human telomerase by a G-quadruplex-interactive compound. J Med Chem. 1997;40:2113–2116. doi: 10.1021/jm970199z. [DOI] [PubMed] [Google Scholar]
- 4.Henderson E, Hardin CC, Walk SK, Tinoco I, Jr, Blackburn EH. Telomeric DNA oligonucleotides form novel intramolecular structures containing guanine-guanine base pairs. Cell. 1987;51:899–908. doi: 10.1016/0092-8674(87)90577-0. [DOI] [PubMed] [Google Scholar]
- 5.Todd AK, Johnston M, Neidle S. Highly prevalent putative quadruplex sequence motifs in human DNA. Nucleic Acids Res. 2005;33:2901–2907. doi: 10.1093/nar/gki553. [DOI] [PMC free article] [PubMed] [Google Scholar]
- 6.Mergny JL, Riou JF, Mailliet P, Teulade-Fichou MP, Gilson E. Natural and pharmacological regulation of telomerase. Nucleic Acids Res. 2002;30:839–865. doi: 10.1093/nar/30.4.839. [DOI] [PMC free article] [PubMed] [Google Scholar]
- 7.Huppert JL, Balasubramanian S. G-quadruplexes in promoters throughout the human genome. Nucleic Acids Res. 2007;35:406–413. doi: 10.1093/nar/gkl1057. [DOI] [PMC free article] [PubMed] [Google Scholar]
- 8.Todd AK, Haider SM, Parkinson GN, Neidle S. Sequence occurrence and structural uniqueness of a G-quadruplex in the human c-kit promoter. Nucleic Acids Res. 2007;35:5799–5808. doi: 10.1093/nar/gkm609. [DOI] [PMC free article] [PubMed] [Google Scholar]
- 9.Eddy J, Maizels N. Conserved elements with potential to form polymorphic G-quadruplex structures in the first intron of human genes. Nucleic Acids Res. 2008;36:1321–1333. doi: 10.1093/nar/gkm1138. [DOI] [PMC free article] [PubMed] [Google Scholar]
- 10.Blackburn EH. Switching and signaling at the telomere. Cell. 2001;106:661–673. doi: 10.1016/s0092-8674(01)00492-5. [DOI] [PubMed] [Google Scholar]
- 11.McEachern MJ, Krauskopf A, Blackburn EH. Telomeres and their control. Annu Rev Genet. 2000;34:331–358. doi: 10.1146/annurev.genet.34.1.331. [DOI] [PubMed] [Google Scholar]
- 12.Maizels N. Dynamic roles for G4 DNA in the biology of eukaryotic cells. Nat Struct Mol Biol. 2006;13:1055–1059. doi: 10.1038/nsmb1171. [DOI] [PubMed] [Google Scholar]
- 13.Burge S, Parkinson GN, Hazel P, Todd AK, Neidle S. Quadruplex DNA: sequence, topology and structure. Nucleic Acids Res. 2006;34:5402–5415. doi: 10.1093/nar/gkl655. [DOI] [PMC free article] [PubMed] [Google Scholar]
- 14.Dai J, Carver M, Yang D. Polymorphism of human telomeric quadruplex structures. Biochimie. 2008;90:1172–1183. doi: 10.1016/j.biochi.2008.02.026. [DOI] [PMC free article] [PubMed] [Google Scholar]
- 15.Lane AN, Chaires JB, Gray RD, Trent JO. Stability and kinetics of G-quadruplex structures. Nucleic Acids Res. 2008;36:5482–5515. doi: 10.1093/nar/gkn517. [DOI] [PMC free article] [PubMed] [Google Scholar]
- 16.Erra E, Petraccone L, Esposito V, Randazzo A, Mayol L, Ladbury J, Barone G, Giancola C. Interaction of porphyrin with G-quadruplex structures. Nucleosides Nucleotides Nucleic Acids. 2005;24:753–756. doi: 10.1081/ncn-200060070. [DOI] [PubMed] [Google Scholar]
- 17.Han H, Langley DR, Rangan A, Hurley LH. Selective interactions of cationic porphyrins with G-quadruplex structures. J Am Chem Soc. 2001;123:8902–8913. doi: 10.1021/ja002179j. [DOI] [PubMed] [Google Scholar]
- 18.Monchaud D, Teulade-Fichou MP. A hitchhiker’s guide to G-quadruplex ligands. Org Biomol Chem. 2008;6:627–636. doi: 10.1039/b714772b. [DOI] [PubMed] [Google Scholar]
- 19.Gellert M, Smith CE, Neville D, Felsenfeld G. Actinomycin Binding to DNA: Mechanism and Specificity. J Mol Biol. 1965;11:445–457. doi: 10.1016/s0022-2836(65)80001-8. [DOI] [PubMed] [Google Scholar]
- 20.Chen FM, Sha F, Chin KH, Chou SH. The nature of actinomycin D binding to d(AACCAXYG) sequence motifs. Nucleic Acids Res. 2004;32:271–277. doi: 10.1093/nar/gkh178. [DOI] [PMC free article] [PubMed] [Google Scholar]
- 21.Wadkins RM, Jares-Erijman EA, Klement R, Rudiger A, Jovin TM. Actinomycin D binding to single-stranded DNA: sequence specificity and hemi-intercalation model from fluorescence and 1H NMR spectroscopy. J Mol Biol. 1996;262:53–68. doi: 10.1006/jmbi.1996.0498. [DOI] [PubMed] [Google Scholar]
- 22.Bailey SA, Graves DE, Rill R, Marsch G. Influence of DNA base sequence on the binding energetics of actinomycin D. Biochemistry. 1993;32:5881–5887. doi: 10.1021/bi00073a022. [DOI] [PubMed] [Google Scholar]
- 23.Bailey SA, Graves DE, Rill R. Binding of actinomycin D to the T(G)nT motif of double-stranded DNA: determination of the guanine requirement in nonclassical, non-GpC binding sites. Biochemistry. 1994;33:11493–11500. doi: 10.1021/bi00204a011. [DOI] [PubMed] [Google Scholar]
- 24.Snyder JG, Hartman NG, D’Estantoit BL, Kennard O, Remeta DP, Breslauer KJ. Binding of actinomycin D to DNA: evidence for a nonclassical high-affinity binding mode that does not require GpC sites. Proc Natl Acad Sci U S A. 1989;86:3968–3972. doi: 10.1073/pnas.86.11.3968. [DOI] [PMC free article] [PubMed] [Google Scholar]
- 25.Antonacci C, Chaires JB, Sheardy RD. Biophysical characterization of the human telomeric (TTAGGG)4 repeat in a potassium solution. Biochemistry. 2007;46:4654–4660. doi: 10.1021/bi602511p. [DOI] [PubMed] [Google Scholar]
- 26.Paramasivan S, Rujan I, Bolton PH. Circular dichroism of quadruplex DNAs: applications to structure, cation effects and ligand binding. Methods. 2007;43:324–331. doi: 10.1016/j.ymeth.2007.02.009. [DOI] [PubMed] [Google Scholar]
- 27.Balagurumoorthy P, Brahmachari SK. Structure and stability of human telomeric sequence. J Biol Chem. 1994;269:21858–21869. [PubMed] [Google Scholar]
- 28.Hardin CC, Henderson E, Watson T, Prosser JK. Monovalent cation induced structural transitions in telomeric DNAs: G-DNA folding intermediates. Biochemistry. 1991;30:4460–4472. doi: 10.1021/bi00232a013. [DOI] [PubMed] [Google Scholar]
- 29.Dai J, Punchihewa C, Ambrus A, Chen D, Jones RA, Yang D. Structure of the intramolecular human telomeric G-quadruplex in potassium solution: a novel adenine triple formation. Nucleic Acids Res. 2007;35:2440–2450. doi: 10.1093/nar/gkm009. [DOI] [PMC free article] [PubMed] [Google Scholar]
- 30.Freyer MW, Buscaglia R, Kaplan K, Cashman D, Hurley LH, Lewis EA. Biophysical studies of the c-MYC NHE III1 promoter: model quadruplex interactions with a cationic porphyrin. Biophys J. 2007;92:2007–2015. doi: 10.1529/biophysj.106.097246. [DOI] [PMC free article] [PubMed] [Google Scholar]
- 31.Haq I, Chowdhry BZ, Jenkins TC. Calorimetric techniques in the study of high-order DNA-drug interactions. Methods Enzymol. 2001;340:109–149. doi: 10.1016/s0076-6879(01)40420-4. [DOI] [PubMed] [Google Scholar]
- 32.Wang Y, Patel DJ. Solution structure of the human telomeric repeat d[AG3(T2AG3)3] G-tetraplex. Structure. 1993;1:263–282. doi: 10.1016/0969-2126(93)90015-9. [DOI] [PubMed] [Google Scholar]
- 33.Ambrus A, Chen D, Dai J, Bialis T, Jones RA, Yang D. Human telomeric sequence forms a hybrid-type intramolecular G-quadruplex structure with mixed parallel/antiparallel strands in potassium solution. Nucleic Acids Res. 2006;34:2723–2735. doi: 10.1093/nar/gkl348. [DOI] [PMC free article] [PubMed] [Google Scholar]
- 34.Parkinson GN, Lee MP, Neidle S. Crystal structure of parallel quadruplexes from human telomeric DNA. Nature. 2002;417:876–880. doi: 10.1038/nature755. [DOI] [PubMed] [Google Scholar]
- 35.Han H, Cliff CL, Hurley LH. Accelerated assembly of G-quadruplex structures by a small molecule. Biochemistry. 1999;38:6981–6986. doi: 10.1021/bi9905922. [DOI] [PubMed] [Google Scholar]
- 36.Rezler EM, Seenisamy J, Bashyam S, Kim MY, White E, Wilson WD, Hurley LH. Telomestatin and diseleno sapphyrin bind selectively to two different forms of the human telomeric G-quadruplex structure. J Am Chem Soc. 2005;127:9439–9447. doi: 10.1021/ja0505088. [DOI] [PubMed] [Google Scholar]
- 37.Gray RD, Li J, Chaires JB. Energetics and Kinetics of a Conformational Switch in G-Quadruplex DNA (dagger) J Phys Chem B. 2009 doi: 10.1021/jp809578f. [DOI] [PMC free article] [PubMed] [Google Scholar]
- 38.Neidle S, Parkinson GN. Quadruplex DNA crystal structures and drug design. Biochimie. 2008;90:1184–1196. doi: 10.1016/j.biochi.2008.03.003. [DOI] [PubMed] [Google Scholar]
- 39.Clark GR, Pytel PD, Squire CJ, Neidle S. Structure of the first parallel DNA quadruplex-drug complex. J Am Chem Soc. 2003;125:4066–4067. doi: 10.1021/ja0297988. [DOI] [PubMed] [Google Scholar]
- 40.Muller W, Crothers DM. Studies of the binding of actinomycin and related compounds to DNA. J Mol Biol. 1968;35:251–290. doi: 10.1016/s0022-2836(68)80024-5. [DOI] [PubMed] [Google Scholar]
- 41.Homer RB. The circular dichroism of actinomycin D and its complexes with DNA and dGMP5′. Arch Biochem Biophys. 1969;129:405–407. doi: 10.1016/0003-9861(69)90193-3. [DOI] [PubMed] [Google Scholar]
- 42.Alexopoulos E, Jares-Erijman EA, Jovin TM, Klement R, Machinek R, Sheldrick GM, Uson I. Crystal and solution structures of 7-amino-actinomycin D complexes with d(TTAGBrUT), d(TTAGTT) and d(TTTAGTTT) Acta Crystallogr D Biol Crystallogr. 2005;61:407–415. doi: 10.1107/S090744490500082X. [DOI] [PubMed] [Google Scholar]