Abstract
Near infrared spectroscopy (NIRS) is an increasingly popular technology for studying brain function. NIRS presents several advantages relative to functional magnetic resonance imaging (fMRI), such as measurement of concentration changes in both oxygenated- and deoxygenated hemoglobin, finer temporal resolution, and ease of administration, as well as disadvantages, most prominently inferior spatial resolution and decreased signal-to-noise ratio (SNR). While fMRI has become the gold standard for in vivo imaging of the human brain, in practice NIRS is a more convenient and less expensive technology than fMRI. It is therefore of interest to many researchers how NIRS compares to fMRI in studies of brain function. In the present study we scanned participants with simultaneous NIRS and fMRI on a battery of cognitive tasks, placing NIRS probes over both frontal and parietal brain regions. We performed detailed comparisons of the signals in both temporal and spatial domains. We found that NIRS signals have significantly weaker SNR, but are nonetheless often highly correlated with fMRI measurements. Both SNR and the distance between the scalp and the brain contributed to variability in the NIRS/fMRI correlations. In the spatial domain, we found that a photon path forming an ellipse between the NIRS emitter and detector correlated most strongly with the BOLD response. Taken together these findings suggest that, while NIRS can be an appropriate substitute for fMRI for studying brain activity related to cognitive tasks, care should be taken when designing studies with NIRS to ensure that: 1) the spatial resolution is adequate for answering the question of interest and 2) the design accounts for weaker SNR, especially in brain regions more distal from the scalp.
Introduction
Cognitive tasks engender local changes in blood flow, volume, and oxygenation in the brain. Functional magnetic resonance imaging (fMRI) and near infrared spectroscopy (NIRS) take advantage of these biophysical phenomena by measuring these hemodynamic correlates of neural activity. fMRI measures the blood oxygen level-dependent (BOLD) response that results from local concentration changes in paramagnetic deoxy-hemoglobin (deoxy-Hb) (Ogawa et al., 1990) and has rapidly become the gold standard for in vivo imaging of human brain activity, due in large part to the relatively high spatial resolution afforded by this technique. However, fMRI also presents several challenges such as high sensitivity to participant motion, a loud, restrictive environment, low temporal resolution, and relatively high cost. Some of these challenges are overcome with optical imaging: NIRS measures changes in oxygenated and deoxygenated hemoglobin (oxy- and deoxy-Hb) from the cortical surface and is less invasive and expensive than fMRI.
NIRS of the human brain is a relatively flexible technology and to date has been successfully applied in several domains. NIRS measures changes in both oxy- and deoxy-Hb and has been used to provide insight into the physiological mechanisms of the BOLD response (Toronov et al., 2003; Hoge et al., 2005; Kleinschmidt et al., 1996; Schroeter et al., 2006; Emir et al., 2008; Malonek et al., 1997; Huppert et al., 2006b; 2009b; 2007). NIRS can be very portable (Atsumori et al., 2009) and has been proposed as a useful technology for non-invasive brain-computer interfaces (Power et al., 2010; Coyle et al., 2004; 2007; Sitaram et al., 2007; Utsugi et al., 2008). NIRS has been used to study brain activity in both active tasks and resting states (Boecker et al., 2007; Herrmann et al., 2005; White et al., 2009; Honda et al., 2010; Zhang et al., 2010; Lu et al., 2010) and may be particularly useful with experimental paradigms that are not well suited to the MRI scanner, such as face-to-face communication (Suda et al., 2010) or driving (Tomioka et al., 2009).
While NIRS presents several advantages, there are also several disadvantages to this technology. Compared to fMRI, the signal-to-noise ratio (SNR) is low and the spatial resolution of NIRS is poor. The trajectory of the photon path from emitter to detector is assumed to be a ‘banana’ shape between the two probes (van der Zee et al., 1990; Okada et al., 1997), but positioning the probes above target brain regions of interest can be challenging (Kleinschmidt et al., 1996). It is also unclear how deeply into the brain NIRS measures in practice.
NIRS signals can be conceptually compared to the BOLD response measured with fMRI using the balloon model (Buxton et al., 1998; Obata et al., 2004), which relates changes in BOLD to changes in deoxy-Hb and regional cerebral blood volume (rCBV). In practice, several studies have used simultaneous measurement of NIRS and fMRI to better understand the generation of the BOLD response. See Steinbrink (Steinbrink et al., 2006) for a review of combined fMRI/NIRS studies. In one of the earliest simultaneous experiments, Kleinschmidt et al. (Kleinschmidt et al., 1996) recorded both fMRI and NIRS signals over ipsi- and contralateral motor cortex during a finger tapping task and confirmed that an increase in BOLD in motor cortex contralateral to the moving hand was correlated with a decrease in deoxy-Hb concentration. Strangman et al. (Strangman et al., 2002) performed a similar motor paradigm and found that oxy-Hb correlated most robustly with the BOLD response. This may be partly attributable to a higher SNR in oxy-Hb. Several other studies have found good correlation between NIRS and fMRI signals (Mehagnoul-Schipper et al., 2002; Kennan et al., 2002; Okamoto et al., 2004; Hoge et al., 2005; Toronov et al., 2001a; 2001a; Huppert et al., 2006b) in both simultaneous and sequential acquisitions on a range of tasks including motor, language, and visual tasks.
It is of great practical interest for cognitive neuroscience researchers considering NIRS as an experimental tool to gain a better understanding of how NIRS compares with fMRI in terms of SNR, spatial resolution, and temporal correspondence. The majority of combined fMRI/NIRS studies to date have been performed using motor (Okamoto et al., 2004; Kleinschmidt et al., 1996; Mehagnoul-Schipper et al., 2002; Toronov et al., 2001a; Strangman et al., 2002; Boas et al., 2003; Hoge et al., 2005; Toronov et al., 2003; Huppert et al., 2006a; 2006b; 2008) or visual (Toronov et al., 2007; Zhang et al., 2006; 2005a; Abdelnour et al., 2009) tasks, and it remains unclear whether one would draw similar conclusions using cognitive tasks with more subtle effects. In this study we address this question by scanning participants simultaneously with NIRS and fMRI on a battery of cognitive tasks. We analyze the data from two perspectives, first investigating the temporal correlation between NIRS and fMRI signals in proximal regions of interest (ROIs) and second, exploring the spatial distribution of fMRI voxels that best correlate with the NIRS signal.
The data presented here are uniquely comprehensive among combined NIRS/fMRI studies to date in that we have included measurements from multiple brain regions, across multiple cognitive domains, and in a relatively large number of participants. The breadth of this data set allows us to make detailed comparisons of NIRS and BOLD signals in terms of SNR and temporal and spatial correspondence. We hypothesized that we would find strong correlations between the NIRS signals and proximal fMRI voxels, but that this correlation might be stronger in tasks with higher SNR, and weaker when the photons travel a larger distance from the scalp to the brain’s surface. In the spatial domain, we explored several possible ROI shapes, to empirically confirm the effective measurement area of NIRS channels.
Methods
Participants
Thirteen healthy young adults (mean age 27.9, age range 21–42, 6 males) participated in this study using simultaneous fMRI and NIRS. Written informed consent was obtained from all participants, and the study protocol was approved by the Stanford University Institutional Review Board.
Experimental procedure
Participants performed four experiments while being scanned by fMRI and NIRS simultaneously: left finger tapping (tap), go/no-go (nog), judgment of line orientation (jlo), and an N-back working memory task using visuospatial stimuli (vis); these tasks are described in detail below and have been used in previous studies from our group (Hoeft et al., 2007; Kesler et al., 2004; Haberecht et al., 2001). Participants were given task instructions verbally before entering the scanner. Eleven participants completed 4 out of 4 tasks, one completed 3, and one completed 2 (Table 1). Two participants did not complete all 4 tasks due to discomfort induced by the NIRS probes. The order of experiments was fixed: tap, nog, jlo, and vis. All experimental stimuli were presented using E-prime software (http://www.pstnet.com/).
Table 1.
Experimental tasks and number of participants.
| Task | Description | Number of participants | Number of NIRS channels per participant | Total number of NIRS time series (# participants × # channels) |
|---|---|---|---|---|
| tap | Tapping of fingers on left hand | 13 | 24 | 312 |
| nog | Go/no-go | 13 | 24 | 312 |
| jlo | Judgment of line orientation | 12 | 24 | 288 |
| vis | Visuospatial N-Back working memory task | 11 | 24 | 264 |
| Total | 1176 |
Task descriptions
Finger tapping (tap)
The finger tapping task consisted of ten alternating tapping and resting epochs. Each tapping epoch lasted 15s and each resting epoch lasted 20s. During the tapping epochs, a circular checkerboard pattern flashed on the screen. During the resting epochs, a fixation cross was displayed on the screen. Participants were instructed to tap the fingers on their left hand vigorously while the checkerboard was flashing and remain still while the fixation cross was displayed.
Go/no-go task (nog)
The go/no-go task consisted of rest, go (G), and no-go (NG) epochs in the following order: Rest–G–NG–G–NG–G–NG–G–NG–G–NG–G–NG–Rest. Each rest epoch lasted 30s, during which subjects passively viewed a blank screen; each task epoch lasted 26s. During the go and no-go epochs, on each trial participants were presented with one of twelve different letters for 500 ms, followed by a 1.5s interstimulus interval. During go epochs, participants were instructed to press a button with their right index finger each time a letter appeared on the screen; at the start of these epochs the instruction, “Push for all letters” was displayed for 2s. During no-go epochs, participants were instructed to push the button for all letters except X, for which they should withhold their response; these epochs began with a 2s display of the instructions, “Push for All Letters Except X.” During no-go epochs, the letter X was presented on 50% of trials.
Judgment of line orientation task (jlo)
The judgment of line orientation task consisted of rest, experimental (E), and control (C) epochs in the following order: Rest–E–C–E–C–E–C– Rest–E–C–E–C–E–C –Rest. Each rest epoch lasted 30s, during which subjects passively viewed a blank screen. Control and experimental epochs consisted of 10 stimuli presented for 2.5s each, with a 300ms interstimulus interval. On all trials two sets of lines appeared on the screen: the top set of purple lines were arranged in the shape of a protractor, and the lower set of lines were either a subset of the angled lines presented above or, during control epochs, simply three parallel lines. Control epochs began with a 4s display of the instructions, “Judge if the colors match”. During these epochs, participants were instructed to press a button if the color of the lines on the lower part of the screen matched the color of the lines on the upper part of the screen. Experimental epochs began with a 4s display of the instructions, “Judge if the line orientations are equal”. Here the task was to respond with a button press if the lines presented on the bottom of the screen were in the same orientation as the two lines highlighted in yellow in the protractor on the upper portion of the screen. There were two levels of difficulty for the experimental epochs: the first three experimental epochs were less difficult, and the final three were more difficult. For the easy experimental task, the protractor on the upper portion of the screen was made up of five lines, while for the difficult task it was made up of eleven lines. In addition, in the difficult task the length of the target lines was shorter.
Visuospatial N-Back working memory task (vis)
During the visuospatial working memory tasks, 1-back (1B), 2-back (2B), and control (C) epochs were presented in the following order: rest-1B-C-1B-C-1B-C-rest-2B-C-2B-C-2B-C-rest. Each rest epoch was 16s long, during which subjects passively viewed a blank screen. Experimental epochs began with a 2s display of the instruction: “Push for 1 Back” in the 1-back task, and “Push for 2 Back” in the 2-back task. Control epochs began with a 2s display of the instruction, “Push for Center”. Each control and experimental epoch consisted of 14 stimuli presented for 1.5s each, with a 1s interstimulus interval. The stimulus was the letter ‘O’ presented in one of nine locations in a 3 × 3 matrix. In the 1-back task, participants were instructed to respond if the stimulus was in the same location as in the previous trial. In the 2-back task, participants were instructed to respond if the stimulus was in the same location as in two trials previously. In the control task, participants were instructed to respond if the stimulus appeared in the center of the screen.
NIRS data acquisition
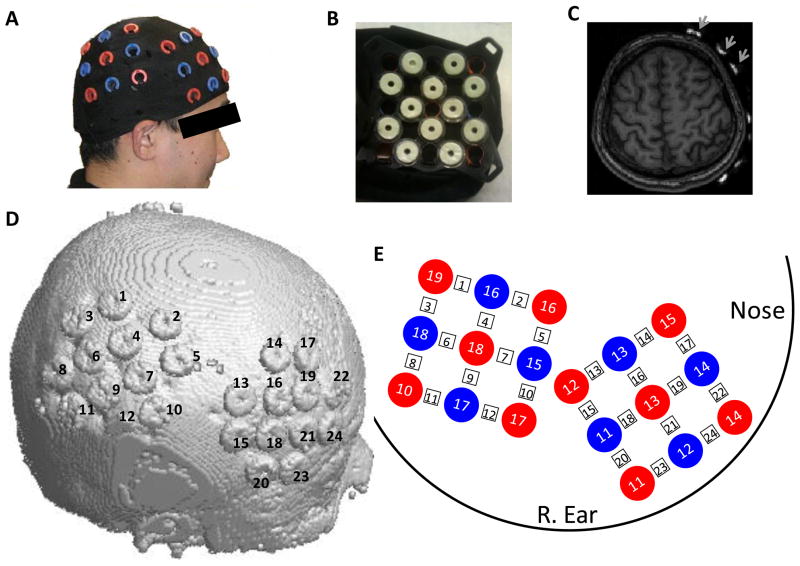
We used an ETG-4000 (Hitachi Medical, Japan) Optical Topography system to measure the concentration change of oxy-Hb and deoxy-Hb at a rate of 10Hz. This device uses the Modified Beer-Lambert law (MBLL) (Cope and Delpy, 1988; Cope, 1991) to calculate changes in chromophore concentrations from the attenuation of light entering the head at multiple wavelengths. Two “3×3” measurement patches provided by Hitachi were attached to a regular swimming cap (Figure 1A), and elastic straps were used to ensure good contact of the measurement probes on the participants’ heads. Five emitters and four detectors were positioned alternatingly in each patch, for a total of 18 probes, resulting in 24 measurement channels (Figure 1A,D,E). The distance between each emitter-detector pair was 3cm. The distance between adjacent channels was thus (e.g. Figure 1E between channel 1 and 3) or 3cm (e.g. between channel 1 and 2). MRI fiducial markers (MRIEquip, SKU: BP-103X, Model: BP-1015, 15-mm outer diameter, 3.5 mm thick, 5-mm central axis hole, https://www.mriequip.com/store/pc/viewPrd.asp?idcategory=72&idproduct=270) were affixed to the inner side of the measurement patch at the location of each of the 24 channels (i.e. between every emitter-detector pair) to identify the positions of NIRS channels in the MRI structural images. The ring-shaped markers allowed us to precisely identify the channel positions. The measurement area covered the right inferior frontal cortex and right parietal cortex (Figure 1A,D,E). The cap remained in the same position on the participant’s head for all 4 experimental tasks.
Figure 1.
NIRS measurement configuration. (A) We used two sets of 3×3 measurement patches, one placed over the right frontal cortex, the other over the right parietal cortex. A swimming cap was used to hold the probes against the scalp. Probes (not shown) were plugged in the red or blue holes on the patches. (B) MRI fiducial markers (in white) were affixed to the inner surface of the measurement patch at the locations of the 24 channels (between every emitter-detector pair). The ring-shaped markers allowed us to precisely identify the channel positions. (C) MRI fiducial markers (indicated by arrows) are easily identified in the structural MRI images. (D) A rendering of the skull surface showing the 24 channel markers in one participant, obtained from the T1-weighted image volume. (E) Schematic of the probe/channel configurations on the head. Red circles indicate the photon emitters; blue circles indicate the photon detectors; measurement channels (numbered in square rectangle) are located between emitter/detector pairs.
The ETG-4000 was located in the control room of the MRI scanning facility. A set of long optical fibers (10m, Hitachi Medical, Japan) were passed through a waveguide in the wall between the control room and the MRI scanner room. At the beginning of each functional scan, the E-prime stimulus program triggered both the ETG-4000 and fMRI scanner simultaneously via serial port.
fMRI data acquisition
Structural and functional MRI images were acquired using a 3T Signa Discovery 750 (GE Medical Systems). The acquisition parameters for axial-oblique 3D T1-weighted structural images were: fast spoiled gradient recalled echo (FSPGR) pulse sequence, inversion recovery preparation pulse TI = 400 ms; repetition time (TR) = 8.5 ms; echo-time (TE) = 3.4 ms; flip angle = 15°; receiver bandwidth ±32kHz; slice thickness = 1.2 mm; 128 slice locations; number of excitations (number of signals averaged) = 1; field-of-view (FOV) = 22cm; Phase FOV 0.75; acquisition matrix = 256 × 192. fMRI data acquisition parameters: T2*-sensitive gradient echo spiral pulse sequence sensitive to BOLD contrast (Glover and Law, 2001), TR = 2000 ms; TE = 30 ms; Flip angle = 80°; FOV= 220 mm × 220 mm; 31 slices. The size of each voxel is 3.4×3.4×4 mm.
Identifying the channel locations
We used the fiducial markers, visually evident in the MRI images, to manually identify the center position of each of the 24 channel markers on each subject (Figure 1B,C,D) and recorded the coordinates using the xjView toolbox (http://www.alivelearn.net/xjview). The probe positions (emitters and detectors) were calculated from the channel positions based on the cap configuration (Figure 1E) using linear interpolation or extrapolation.
Scalp-brain distance
We created a skull-stripped brain mask for each subject. For each channel marker, we projected the marker from the scalp to the brain surface by finding the point on the brain surface which was closest to the marker. The distance between the channel marker and its projected point on the brain surface is what we refer to as the ‘scalp-brain distance’. This distance is determined by the thickness of the skull, but also by hair thickness and cerebrospinal fluid.
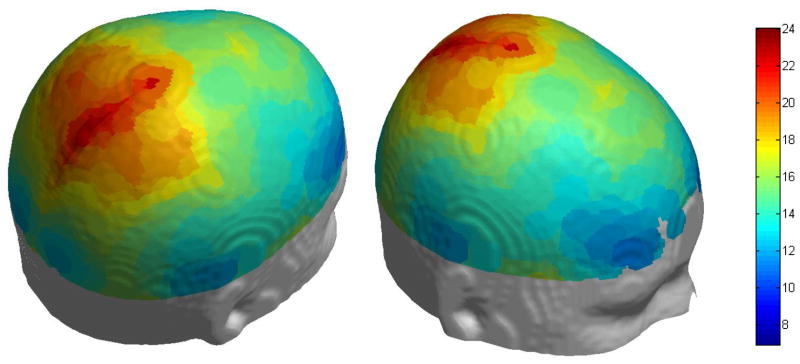
To calculate the scalp-brain distance on the standard template (colin27, the T1.nii template included with SPM, http://www.fil.ion.ucl.ac.uk/spm/) as shown in Figure 8, we generated 2701 points uniformly distributed on the scalp and projected these points on the brain surface. For each point, we calculated the scalp-brain distance using the method described above. We then visualized the distance with colors on the surface of the scalp (Figure 8).
Figure 8.
Scalp-brain distance of a standard brain (colin27). The mean scalp-brain distance is 16.8 mm. The scalp-brain distance is smaller in frontal regions and larger in parietal regions.
Temporal analysis
NIRS data processing
A band pass filter with cutoff frequencies 0.01 and 0.5Hz was applied to the raw NIRS data before any further processing (except when calculating the noise level in NIRS signal) to remove high frequency instrument noise and low frequency drift in oxy-Hb and deoxy-Hb signals. NIRS time courses in each experiment, in each channel, were then temporally aligned with the corresponding fMRI data and resampled at the fMRI sampling rate of 0.5Hz. Total-Hb was calculated as the sum of oxy-Hb and deoxy-Hb. As deoxy-Hb usually decreases during neural activation, the sign of the deoxy-Hb signal was flipped for easier comparison with oxy-Hb and the BOLD signal.
fMRI preprocessing
Functional MRI images were realigned, slice timing corrected, and coregistered to the structural images using SPM software (version 8, http://www.fil.ion.ucl.ac.uk/spm/). The fMRI images were not normalized to a standard template or spatially smoothed. Temporal drift in the fMRI signal was removed by subtracting a moving average with a window size of 50 TRs (100s).
Region of interest (ROI)
We were interested in assessing the correlation between the time series measured with NIRS and the fMRI voxels adjacent to the NIRS recording site. To obtain this correlation, we first identified a region of interest (ROI) for each channel in each subject. This ROI, in theory, should be the path along which photons travel from the emitter to the detector. Without knowing the exact shape of the path, we used a spherical region underneath the channel as an approximation. For each channel, we projected the channel marker from the scalp to the brain surface and grew a spherical region around the projection point with a radius of 5 voxels (~17.5 mm). Then we removed any portion of the sphere that fell outside the brain mask and only kept the voxels inside the brain. fMRI signals from the voxels in this ROI were extracted and averaged. Thus, for each NIRS time course, we obtained a corresponding BOLD fMRI time course. Accounting for all subjects and tasks, we obtained 1176 such pairs in total, and we subsequently refer to each pair as an ‘instance’. Note that this procedure therefore included instances with and without task-related brain activation.
fMRI-NIRS correlation
For each channel and each task in each subject, the Pearson correlation coefficient was calculated between the NIRS time courses (oxy-Hb, deoxy-Hb, and total-Hb) and the fMRI time course in the corresponding ROI. We have 1176 correlation coefficients for each of the oxy-, deoxy-, and total-Hb (Table 1).
Noise level in NIRS signal
To quantify the high-frequency noise level in the NIRS data, we used high-pass filtering to remove the components with frequency less than 2Hz from the raw NIRS signal. We calculated the variance of the remaining signal as an indicator of the noise level.
Contrast-to-noise-ratio (CNR)
We used the contrast-to-noise-ratio (CNR) to quantify the signal-to-noise ratio (Zhang et al., 2005b) in both the fMRI and NIRS time courses. The CNR calculates the amplitude difference between the signal during task blocks and control or rest blocks, divided by the pooled standard deviation. Larger CNR indicates that the ratio of task-related signal to noise is larger.
The term “dur” refers to signal during task blocks, and “pre” refers to signal during the control or rest period before the task blocks. Considering the hemodynamic delay, we chose a time window from 6–12s after the beginning of task blocks as “dur” and 0–5s before task as “pre”.
Spatial analysis
For the spatial analysis we explored the spatial correspondence between NIRS and fMRI measurements. NIRS measures changes in oxy- and deoxy-Hb concentrations along the photon path from emitter to detector. It is generally believed that this path forms a ‘banana’ shape between the emitter and detector. As we were not able to measure the photon paths directly, we approached this question indirectly. We assumed that if the fMRI signal in a voxel or a set of voxels is highly correlated with the NIRS signal, this voxel or set of voxels was likely in the photon path. Thus, we asked, “where are the voxels whose fMRI signal is best correlated to the corresponding NIRS signal?” To answer this question, we tried two approaches. Our first approach was to find the single voxel which best correlated with the NIRS signal for each channel, which we call the local best correlating voxel (LBCV), and then observe the spatial distribution of these voxels. While the photon path covers many more than one voxel, we reasoned that the distribution of LBCVs across all 1176 instances would reflect the photon path pattern in the brain. While the distribution of LBCVs gave us a general idea of where the NIRS measurement occurs, in reality photons always travel through multiple voxels. In the second approach, we systematically varied the shape of the ROI and studied how this affected the correlation with NIRS signals. While there are an infinite number of possible shapes, we chose to focus on three shapes: a sphere, a spherical shell, and a 1-D elliptical ring. We chose these shapes based on previous work examining the photon scattering pattern (Okada et al., 1995; Okada and Delpy, 2003). We systematically varied the size and orientation of the shapes, extracted fMRI signals from the resultant ROIs, and determined the size or orientation which gave the best fMRI-NIRS correlation, for each channel. While these approaches could not decisively determine the photon path, we nonetheless expected to gain some understanding of the corresponding spatial pattern of this path.
Finding the local best correlating voxel (LBCV)
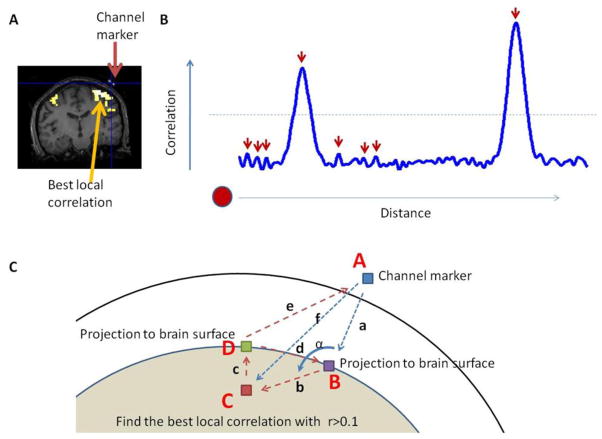
For each channel, we computed the correlation coefficient between the NIRS signals (both oxy-Hb and deoxy-Hb) and the fMRI signal from each voxel in the entire brain to create a correlation image. We then smoothed the correlation image with an 8-mm Gaussian kernel (Figure 2A), which allowed us to be less sensitive to noise in later steps. We identified voxels whose correlations were (1) local maxima and (2) above 0.1 (Figure 2B). If more than one voxel satisfied these conditions, we chose the voxel closest to the channel’s projection point on the brain (based on the assumption that the photon path should be close to the channel).
Figure 2.
Identifying the spatial location of the LBCV. (A) For a given NIRS channel, we calculated the correlation between the measured signal and the BOLD signal at every voxel in the brain. This generated a correlation image which was then smoothed with an 8-mm Gaussian kernel. (B) 1-D schematic demonstrating the identification of the LBCV above a threshold of 0.1. The horizontal dotted line indicates the threshold (0.1). The red arrows indicate the local peaks. The shortest distance (e.g. leftmost) supra-threshold peak is the LBCV. (C) Schematic drawing of the distances and angles to be calculated. Point A is the channel location on the scalp, as identified by the MRI fiducial marker. Projecting point A onto the brain surface we get point B. We find the LBCV, point C, and projecting C onto the brain surface we get point D.
To quantify the spatial location of LBCVs relative to the channels and brain surface, we calculated the distance between every two of the four key points shown in Figure 2C: point A, the channel marker; point B, the projection point of the channel marker (A) on the brain surface; point C, the LBCV; and point D, the shortest path from point C to the brain surface. We also calculated the angle, α, between AB and BC.
Finding the optimal spherical volume
For each channel, we identified the projection point on the brain and grew a spherical ROI around this point into the brain. We varied the radius of this sphere from 1 to 10 voxels (note: in the temporal analysis, the radius was fixed at 5 voxels). We then extracted the fMRI signal from the ROI and calculated the correlation with the oxy-Hb NIRS signal from the corresponding NIRS channel.
Finding the optimal spherical shell
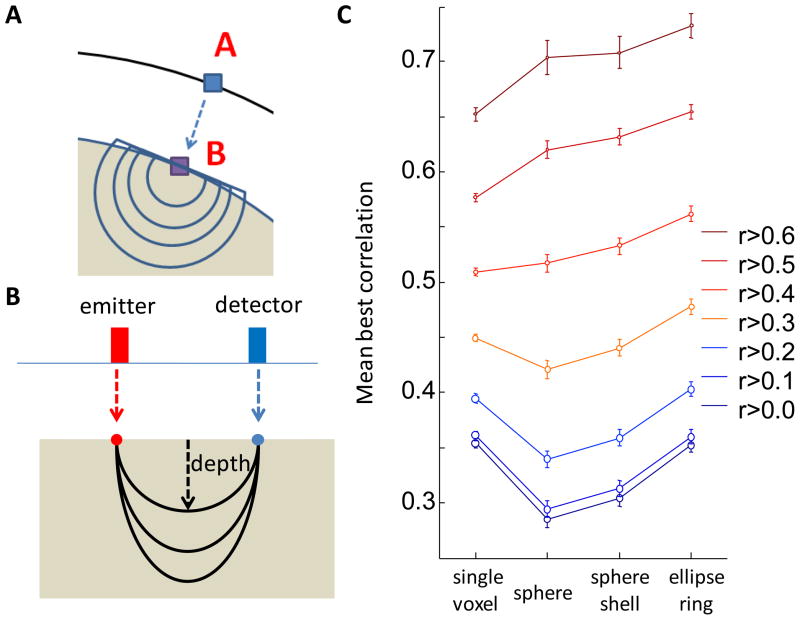
For each channel, we identified the projection point on the brain surface and generated an ROI in the shape of a spherical shell around this point (thickness: 1 voxel; for a schematic, see Results: Figure 13A). We varied the radius of this sphere from 1 to 10 voxels, extracted the fMRI signal from the resulting ROI, and calculated the correlation with the oxy-Hb NIRS signal from the channel.
Figure 13.
BOLD-NIRS correlation as a function of ROI shape. (A) Schematic visualization through a section of the spherical shell ROI. The channel marker (point A) is projected to the brain surface (point B). Spherical or shell-shaped ROIs are grown from point B with different radii; voxels outside the brain are discarded. (B) Schematic visualization of the elliptical ROI. The locations of the emitter (red) and detector (blue) are projected to the brain surface. With the two projection points as antipodal points, elliptical ring-shaped ROIs are generated with 10 different depths (1–10 voxels) and 7 different angles off the vertical plane (−90° to 90° with step size 30°). (C) Comparison of BOLD-oxy-Hb correlations for different shapes. The single-voxel ROI (LBCV) is also plotted for reference. Each color indicates a subset of correlations, with cutoff threshold based on the LBCV correlation. For example, r>0.3 means that we selected all instances whose LBCV correlation is greater than 0.3 and calculated the mean maximum correlation across all shapes. Circle areas are proportional to sample size.
Finding the optimal elliptical ring
For each channel, we identified the position of the corresponding emitter and detector and projected the two points onto the brain surface. We used these as antipodal points and constructed a series of elliptical rings by varying two parameters: depth and angle off the vertical plane (for a schematic, see Results: Figure 13B). The vertical plane is the plane defined by the emitter, the detector, and the channel projection on the brain surface. The depth ranges from 1 to 10 voxels, and the angle ranges from −90° to 90° with a step size of 30°. The thickness of the ring was fixed at 1 voxel. We then extracted the fMRI signal from these ROIs and calculated the correlation with the oxy-Hb NIRS signal from each corresponding channel.
General linear model (GLM)-based analysis in each modality
fMRI
Functional MRI images were realigned, slice timing corrected, coregistered to the structural images, normalized to the standard template and spatially smoothed (8-mm) using SPM software (version 8, http://www.fil.ion.ucl.ac.uk/spm/).
We constructed a general linear model (GLM) in SPM for each subject and for each task. For the tapping task, the design matrix consisted of one regressor with onsets for the tapping blocks (duration 15s), while for the other tasks two regressors were included, one for the onset of all task blocks (including all difficulty levels) and one for control blocks; regressors were convolved with the canonical hemodynamic response function (HRF). Following estimation, we generated a contrast image comparing the task and control conditions (or simply task vs. implicit baseline for the tapping task). Finally, to estimate group level effects, we performed one-sample T-tests on the contrast images across subjects.
NIRS
A band pass filter with cutoff frequencies 0.01 and 0.5Hz was applied to the raw NIRS data. For each task, we generated a similar model, as described above for the fMRI analysis, and entered this into a linear regression for each channel (all regressors were convolved with the canonical HRF). Contrast values were calculated based on the parameter estimates. For the group analysis, channel positions were normalized to a standard template using the transform matrix generated by the normalization procedure in the fMRI data preprocessing. A contrast image was created using the contrast values and their corresponding channel positions on the brain surface. Cubic spline interpolation was applied to estimate the contrast value in voxels between channels. Finally, a T-test was performed on the contrast images across subjects.
Results
Temporal analysis
fMRI-NIRS correlations show wide variability
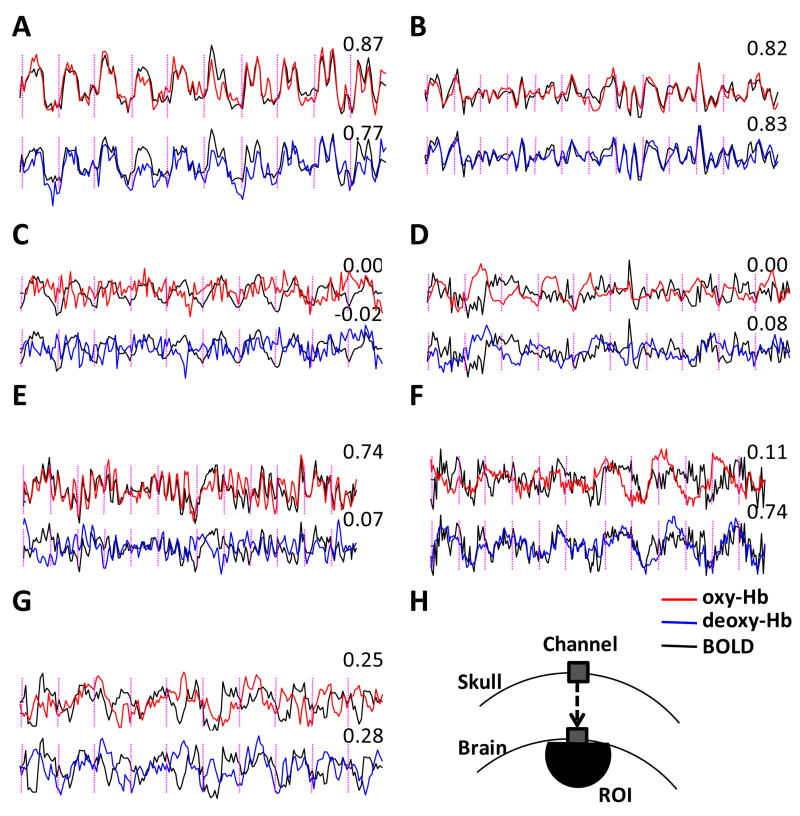
We found a wide range of correlations between signals in our 1176 NIRS-fMRI pairs. To demonstrate this variability we plotted a selection of time courses showing strong and weak correlations (Figure 3). In some panels the NIRS-fMRI correlations are as high as 0.8 (Figure 3A,B), but in others as low as 0 (Figure 3C,D). In some cases oxy-Hb correlates with the BOLD signal better than deoxy-Hb (Figure 3E) and in some other cases, deoxy-Hb and BOLD correlations are higher than those observed with oxy-Hb (Figure 3F). High correlations between BOLD and NIRS sometimes occur in brain areas which respond to the experimental task (high CNR, Figure 3A), but also sometimes in regions which do not correlate well with the task (low CNR, Figure 3B).
Figure 3.
Examples of oxy-Hb, deoxy-Hb, and BOLD fMRI time courses to demonstrate the wide spectrum of NIRS-fMRI correlations. Time courses presented here were normalized to have a standard deviation of 1. Oxy-Hb, deoxy-Hb, and BOLD signals are plotted in red, blue, and black, respectively. As deoxy-Hb usually decreases during neural activation, the sign of the deoxy-Hb signal was flipped for easier comparison with oxy-Hb and the BOLD signal.
(A) An example of high correlation and high CNR (subject: 12, task: tap, channel: 9). (B) An example of high correlation but low CNR (subject: 4, task: nog, channel: 21). (C) An example of high BOLD CNR but low NIRS CNR (subject: 6, task: tap, channel: 4). (D) An example of low BOLD CNR but high NIRS CNR (subject: 7, task: tap, channel: 13). (E) An example of high BOLD-oxy-Hb correlation but low BOLD-deoxy-Hb correlation (subject: 13, task: vis, channel: 24). (F) An example of low BOLD-oxy-Hb correlation but high BOLD-deoxy-Hb correlation (subject: 8, task: vis, channel: 12). (G) An example of low BOLD-oxy-Hb correlation and low BOLD-deoxy-Hb correlation (subject: 6, task: tap, channel: 22). (H) Schematic of the ROI from which the fMRI signal was extracted. Correlation coefficients appear in the top right corner of each panel; vertical dotted lines indicate the onset timing of task or control blocks.
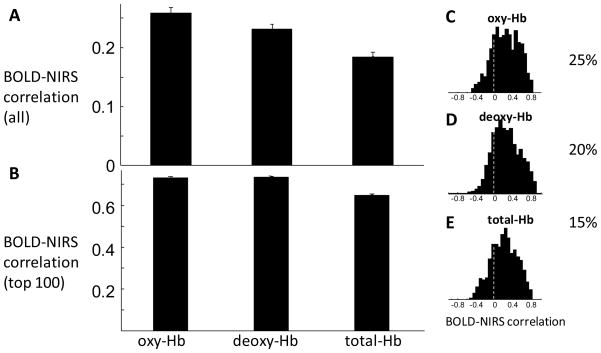
Though NIRS-fMRI correlations show wide variability in magnitude, the mean correlation is significantly higher than 0 (Figure 4A). The average correlation between BOLD and oxy-Hb is 0.26, and between BOLD and deoxy-Hb is 0.23, across all 1176 instances. The BOLD-oxy-Hb correlation is significantly higher than BOLD-deoxy-Hb correlation (p=2.6×10⁻⁴, paired T-test, df=1175) and the BOLD-total-Hb correlation (p<10−10). Total-Hb shows poor correlation with BOLD, compared to oxy-Hb and deoxy-Hb. Due to low SNR, correlations may be low in task-irrelevant channels. Therefore we also plotted the average correlation in the channels that show the highest correlations. Figure 4B shows the mean correlation from the top 100 of the 1176 values (8.5%). Among the instances showing the strongest correlations, both oxy-Hb and deoxy-Hb show a correlation higher than 0.7 with the fMRI signal. The distributions of correlation coefficients are plotted in Figure 4C, D and E for oxy-Hb, deoxy-Hb, and total-Hb, respectively.
Figure 4.
Mean and distribution of fMRI-NIRS correlations. (A) The mean and standard error of correlations between BOLD and oxy-Hb, deoxy-Hb, and total-Hb are 0.26±0.008, 0.23±0.008, and 0.19±0.008, respectively. The BOLD-oxy-Hb correlation is significantly higher than BOLD-deoxy-Hb correlation (p=2.6×10⁻⁴, paired T-test, df=1175) and the BOLD-total-Hb correlation (p<10−10). (B) The mean and standard error of the top 100 values are 0.74±0.006, 0.74±0.005, and 0.66±0.006 for oxy-, deoxy-, and total-Hb, respectively. (C,D,E) The distribution of BOLD-NIRS correlations. The percentage of high correlation (higher than 0.5) instances are 25%, 20%, and 15% for oxy-Hb, deoxy-Hb, and total-Hb, respectively. Vertical dotted lines indicate 0 NIRS-fMRI correlation. Oxy-Hb and deoxy-Hb yield similar correlations with the BOLD signal, while total-Hb shows lower correlations.
Cognitive task does not affect NIRS/BOLD correlations
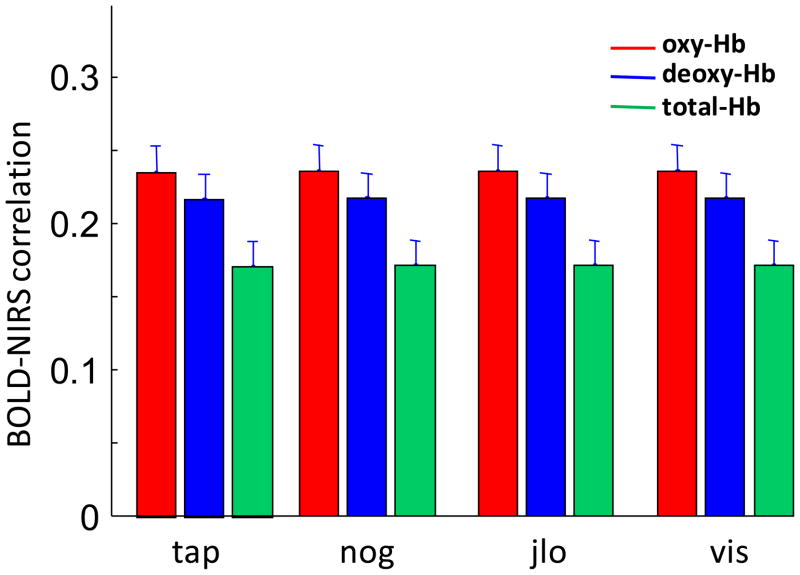
We have shown that NIRS-fMRI correlations are significantly greater than 0, but vary widely. Thus, we asked whether there was a difference in these correlations between the motor task (tap) and the cognitive tasks (nog, jlo and vis). To address this question, we plotted the BOLD-NIRS correlations for the four experimental tasks (Figure 5). Results indicated that there were no significant differences between any of the tasks (two sample T-tests were performed between every pair of tasks for each hemoglobin species; p>0.1 for all comparisons, except the nog and vis comparison in fMRI-total-Hb, where p=0.02).
Figure 5.
Mean and standard error of the BOLD-NIRS correlations for all four tasks. There was no significant difference in the BOLD-NIRS correlations between the tasks. tap - Tapping of fingers on left hand; nog - Go/no-go; jlo - Judgment of line orientation; vis - Visuospatial N-Back working memory task.
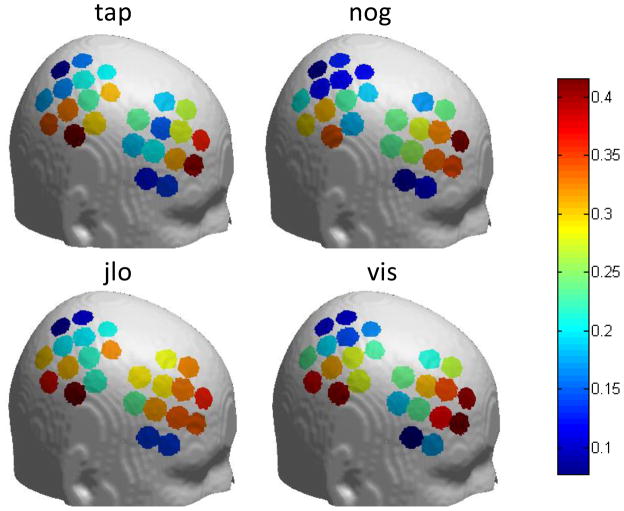
We further found that the spatial pattern of NIRS-fMRI correlations is similar across different experimental tasks. Figure 6 shows the correlation between fMRI and oxy-Hb on a template brain, in each channel, for each of the 4 tasks. The middle frontal area and the inferior parietal area show a higher correlation than other areas, and this is generally true for all tasks.
Figure 6.
fMRI-oxy-Hb correlation for each channel in different tasks. In all four tasks, the correlation is higher in the middle frontal area and the inferior parietal area than other areas. The location of each channel for individual participants was mapped to a standard brain, and then a single position for each channel was calculated by averaging across the 13 participants. tap - Tapping of fingers on left hand; nog - Go/no-go; jlo - Judgment of line orientation; vis - Visuospatial N-Back working memory task.
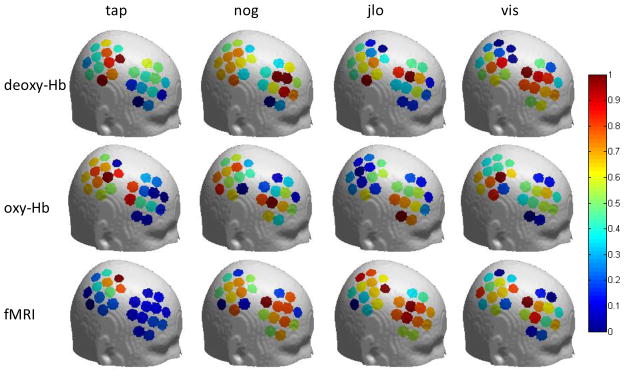
CNR, on the other hand, is highly dependent on the experimental task. Figure 7 shows the color-encoded CNR on a template brain for each task. As expected, the CNR pattern is different for different tasks. In the tap task, the motor area has higher CNR as measured by both fMRI and NIRS, with the fMRI pattern more focal. For the cognitive tasks, fMRI and NIRS CNR maps are less similar; in Figure S1, we show significance levels for the fMRI and NIRS channels.
Figure 7.
CNR in fMRI, oxy-Hb, and deoxy-Hb for each channel in different tasks. CNR values are normalized within each panel so the minimum is 0 and the maximum is 1. Channel significance values are plotted in Figure S1. tap - Tapping of fingers on left hand; nog - Go/no-go; jlo - Judgment of line orientation; vis - Visuospatial N-Back working memory task.
Longer scalp-brain distance degrades NIRS-fMRI correlations
We investigated factors that may contribute to the observed variability in NIRS-fMRI correlations. As NIRS measurements critically depend on the infrared photons passing through the skull and brain tissues, it is likely that the scalp-brain distance, which affects the photon path, also affects the NIRS signal quality and thus the correlation between NIRS and fMRI. To assess this possibility, we calculated the scalp-brain distance for every channel and correlated this distance with a measure of NIRS data quality and the strength of NIRS-fMRI correlations.
The scalp-brain distance varies across brain regions. In Figure 8 we show the scalp-brain distances for a template brain (colin27, the T1.nii template included with SPM, http://www.fil.ion.ucl.ac.uk/spm/). It can be seen that parietal regions have the longest scalp-brain distance (>18 mm), while frontal and temporal regions have the shortest (<16 mm). This difference was confirmed across our subject groups, where longer scalp-brain distances in parietal channels were observed relative to frontal channels (Figure S8).
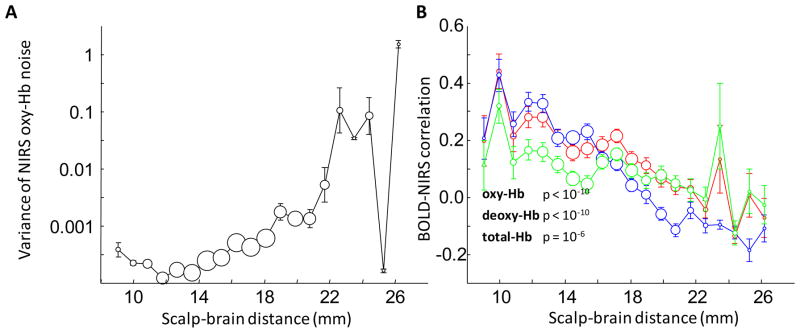
We found that the scalp-brain distance has a direct impact on NIRS data quality as indicated by the noise level in the NIRS data (Figure 9A). For channels where the scalp-brain distance is larger than 22 mm, it is likely that the measured NIRS signals contain increasing high-frequency noise.
Figure 9.
High-frequency noise in NIRS and BOLD-NIRS correlation as functions of scalp-brain distance. (A) High-frequency noise in NIRS signal and scalp-brain distance are correlated. The scalp-brain distances are binned in 1-mm increments. Circle area is proportional to the sample size. Error bars indicate the standard error. The y-axis is on a logarithmic scale. (B) Scalp-brain distance affects BOLD-NIRS correlation. The BOLD-NIRS correlation is more likely to be low in regions where the scalp-brain distance is higher.
Next, we found that the scalp-brain distance affects the NIRS-fMRI correlation. In Figure 9B we plot the BOLD-NIRS correlation as a function of the scalp-brain distance. For all of the measured hemoglobin signals (oxy-, deoxy-, and total-Hb), the NIRS-fMRI correlation is significantly negatively correlated with the scalp-brain distance (p<10−6). The variability of the NIRS-fMRI correlations (Figures 3 and 4) can thus be partly explained by the scalp-brain distance.
Higher CNR yields higher NIRS-fMRI correlations
We have shown that long scalp-brain distances degrade NIRS data quality and reduce the correlation between NIRS and fMRI. Another factor that could affect the NIRS-fMRI correlation is the true signal level in the data. While fMRI and NIRS both measure the hemodynamic response, they are unlikely to be correlated if the underlying hemodynamic signal does not change. For example, if a brain region does not respond to the experimental task, it is likely that the measured data in this region is primarily noise, and thus the NIRS-fMRI correlation may be low. To test this hypothesis, we first calculated the CNR value for each of the 1176 pairs of time courses and next tested how the CNR correlates with the NIRS-fMRI correlations.
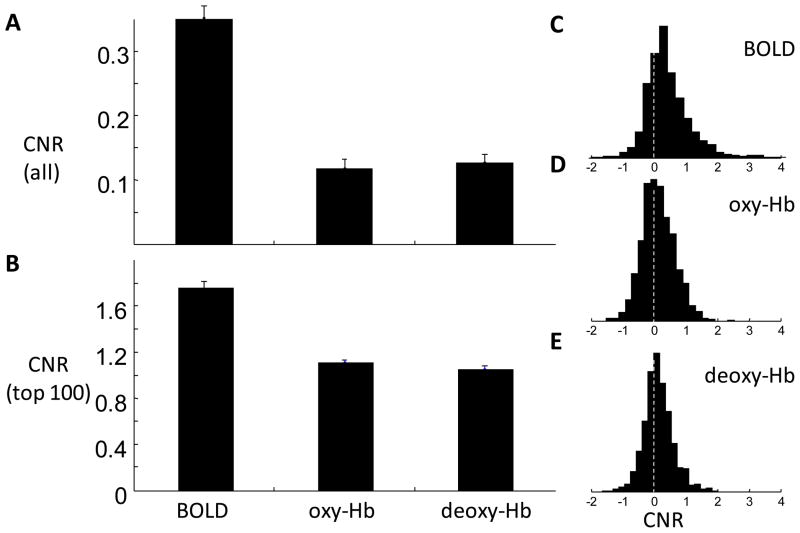
We calculated the CNR of the fMRI and NIRS signals and found that the fMRI CNR is significantly higher than the CNRs of oxy-Hb and deoxy-Hb (p<10−10, paired T-test, df = 1175). In Figure 10 we plot the mean and distribution of the CNR values. In Figure 10A we show the mean CNR for all 1176 instances. We also show that the mean of the 100 largest fMRI CNR values is also significantly higher than the mean of the 100 largest oxy-Hb or deoxy-Hb CNR values. This result indicates that the CNR of fMRI is generally better than that of NIRS.
Figure 10.
Mean and distribution of the CNR in BOLD, oxy-Hb, and deoxy-Hb. (A) Mean CNR of all 1176 pairs of time courses. BOLD signal on average has the highest CNR (0.36±0.02, standard error). The CNR of oxy- and deoxy-Hb are 0.12±0.01 and 0.13±0.01, respectively. The BOLD CNR is significantly higher than that of oxy-Hb (p<10−10, paired T-test, df = 1,175) and that of deoxy-Hb (p<10−10). There is no significant difference between the CNRs of oxy-Hb and deoxy-Hb (p=0.58). (B) The mean and standard error of the top 100 values are 1.75±0.05, 1.11±0.026, and 1.1±0.027 for BOLD, oxy-Hb, and deoxy-Hb, respectively. (C,D,E) The distribution of CNR in BOLD, oxy-Hb, and deoxy-Hb, respectively. Vertical dotted lines indicate CNR=0.
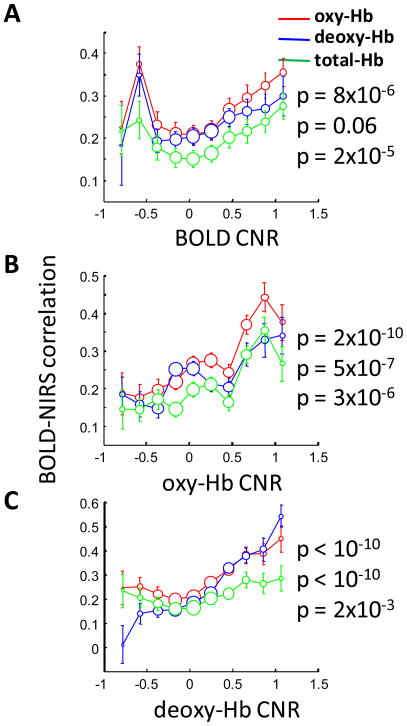
We expected that NIRS-fMRI correlations would be higher for time courses with higher CNR. To test this hypothesis, we plotted the BOLD-NIRS correlations as a function of CNR (Figure 11). We found that the BOLD-NIRS correlation is significantly positively correlated with the CNR. It is notable that the BOLD-NIRS correlation shows some non-linearity as the BOLD CNR becomes increasingly negative (Figure 11A). The variability of the NIRS-fMRI correlation is thus partially explained by the signal level. We also found that, for instances with high BOLD CNR, NIRS CNR is likely to be higher (p<10−10, Figure S2).
Figure 11.
CNR affects fMRI-NIRS correlation. The fMRI-NIRS correlation is more likely to be low when the task-related CNR is low. (A) BOLD-oxy-Hb correlation (red), BOLD-deoxy-Hb correlation (blue), and BOLD-total-Hb correlation (green) as a function of BOLD CNR. (B) BOLD-NIRS correlation as a function of oxy-Hb CNR. (C) BOLD-NIRS correlation as a function of deoxy-Hb CNR.
Spatial analysis
Spatial properties of local best correlating voxels (LBCVs)
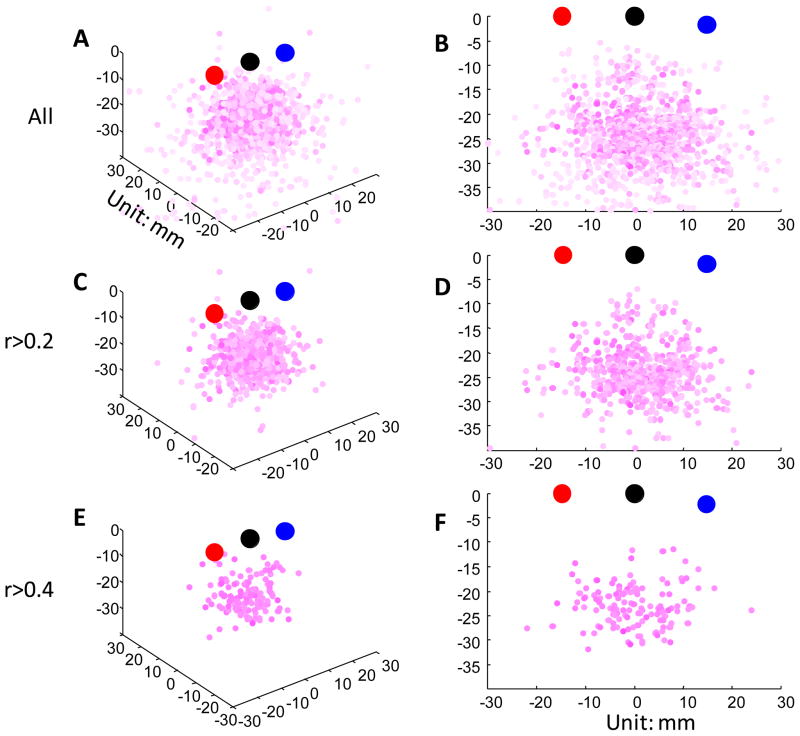
In Figure 12 we show the position of LBCVs relative to the emitter and detector. In Figure 12A, C, and E, we plot the position of LBCVs in 3-dimensional space relative to the emitter, detector, and channel. For easier visualization, in Figure 12B, D, and F, we rotate the voxels into the vertical plane that is defined by the emitter, the detector, and the channel projection onto the brain surface. In Figure 12A and B, we plot LBCVs for all 1176 instances; in Figure 12C–F, we only plot LBCVs which have a BOLD-oxy-Hb correlation above a specified threshold (0.2 for C, D and 0.4 for E, F). We note that the voxels seem to be randomly distributed in this region and do not form a clean path.
Figure 12.
Distributions of LBCVs relative to the probes and channels; each of the 1176 instances is shown (see Table 1 for details on the number of instances). (A) The location of LBCVs in 3-D space. (B) The voxels have been rotated into the plane defined by the probes and the brain projection point. (C,D) The subset of voxels with (BOLD-oxy-Hb) r>0.2. (E,F) The subset of voxels with (BOLD-oxy-Hb) r>0.4. Red circles indicate the emitter, blue indicate the detector, and black indicate the channel. LBCVs were determined based on BOLD-oxy-Hb correlations; darker pink indicates a higher correlation value.
We summarized the spatial distribution of LBCVs relative to the channels in Table 2. The average scalp-brain distance is 15 mm. The average distance between the LBCV and the channel projection on the brain surface is 12 mm. The LBCV is on average 5 mm from the brain surface. However, each of the distances shows considerable variance (Figure S4). We also found that the scalp-brain distance affects the spatial location of LBCVs (Figure S5).
Table 2.
The mean value of the distances and angle of the distribution of the LBCVs. Please refer to Figure 2 for the meaning of symbols. Unit for distance is mm, and unit for angle is degree.
| Sample Size | a | b | c | d | e | f | α | |
|---|---|---|---|---|---|---|---|---|
| oxy | ||||||||
| all | 1160 | 16 | 18 | 7 | 16 | 27 | 31 | 129 |
| >0.4 | 133 | 15 | 12 | 5 | 10 | 20 | 24 | 135 |
| >0.5 | 29 | 14 | 11 | 5 | 10 | 20 | 23 | 132 |
| >0.6 | 4 | 16 | 11 | 6 | 7 | 20 | 25 | 146 |
| deoxy | ||||||||
| all | 1080 | 16 | 21 | 6 | 19 | 31 | 33 | 127 |
| >0.4 | 125 | 14 | 11 | 5 | 9 | 19 | 22 | 132 |
| >0.5 | 39 | 14 | 11 | 5 | 9 | 19 | 23 | 135 |
Determining the optimal ROI shape
While LBCV distribution affords a general idea of NIRS measurement location, in reality photons always travel through multiple voxels. To find the optimal photon path we created ROIs with various shapes and studied how fMRI signals within these regions correlated with NIRS signals. While there are an infinite number of possible shapes, we chose to focus on three: sphere, spherical shell, and elliptical ring.
For spherical ROIs (Figure 13A), we found that the best correlation occurs, on average, when the sphere has a radius of 5 voxels (Figure S6B). For spherical shell-shaped ROIs, the best correlation occurs when the radius is 4 voxels (~14 mm, Figure S6C). This indicates that, on average, voxels along a path 4 voxels away from the center of the channel projection contribute most to the correlation.
We also systematically evaluated the fMRI-oxy-Hb correlation using elliptical rings (Figure 13B). The correlation reaches a peak when the depth is 4 voxels and changes little as depth increases (Figure S7B). The best angle is near 0 (i.e. in the plane of emitter and detector), ranging from −30° to 30° (Figure S7C).
Among the different ROI shapes we studied, which one correlates most strongly with the NIRS signal? For each instance, we calculated correlations between BOLD and oxy-Hb for the range of possible dimensions of each of the shapes. For each instance/shape, we identified the highest correlation, which we refer to as the ‘best correlation’. We then averaged these ‘best correlations’ over all instances (Figure 13C). Subsets of the data were thresholded based on the correlation with the single-voxel ROI. We find that an elliptical ring, on average, is a better shape than shells or spheres, but it is not better for all instances.
GLM-based analyses in each modality
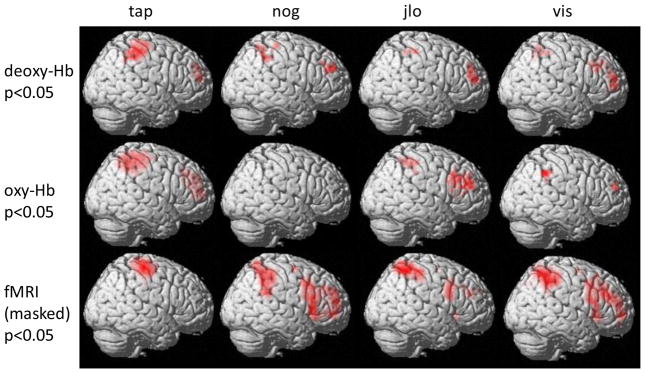
A question of interest to NIRS researchers is whether similar conclusions would be drawn from the same population and task, measured with NIRS or fMRI. To answer this question, we performed standard general linear model analyses on both NIRS and fMRI data (Figure 14). fMRI images are masked to show only locations measured with the NIRS patches (see unmasked activations in Figure S3). We found that for the finger tapping task, in which the active region is on the brain surface, the activation pattern in motor cortex is similar across modalities. For cognitive tasks, the pattern of significant activations is qualitatively similar in some parietal and frontal regions, suggesting that similar conclusions may be drawn, but with inferior resolution in the NIRS data.
Figure 14.
Activation maps measured with fMRI and NIRS. The channel positions projected onto the brain surface were normalized to a standard brain. For NIRS measurements, cubic spline interpolation was applied to estimate the contrast value in voxels between channels. fMRI activations were masked to show only regions covered by the NIRS probes; unmasked activation patterns are shown in Figure S3. tap - Tapping of fingers on left hand; nog - Go/no-go; jlo - Judgment of line orientation; vis - Visuospatial N-Back working memory task.
Discussion
In this study we performed a comprehensive comparison of hemodynamic signals measured with NIRS and fMRI in both temporal and spatial domains, across multiple brain locations, and with a battery of cognitive tasks. We found that, while many channels showed strong correlations between BOLD and oxy- and deoxy-Hb, there was a wide range in correlation values. We identified several factors which contributed to variability of correlations, including scalp-brain distance and CNR. We found that BOLD-NIRS correlations did not depend significantly on the cognitive task. In the spatial domain, we conducted an empirical exploration of the spatial correspondence of NIRS and fMRI and found that, among the shapes we tested, a path traversing an elliptical, annular ring between the emitter and detector generated a time course that correlated most strongly with fMRI-BOLD. We note, however, that this spatial correlation is dependent on the specific probe geometry and placement used in our study.
Previous studies using simultaneous acquisition have mainly focused on motor (Okamoto et al., 2004; Kleinschmidt et al., 1996; Mehagnoul-Schipper et al., 2002; Toronov et al., 2001a; Strangman et al., 2002; Boas et al., 2003; Hoge et al., 2005; Toronov et al., 2003) and visual (Toronov et al., 2007; Zhang et al., 2006; 2005a) paradigms and regions. A strength of the present study is the breadth of both cognitive tasks and brain regions simultaneously recorded with fMRI and NIRS. In particular, we recorded from both lateral frontal and parietal regions with tasks requiring response inhibition, working memory, and visuospatial skills. As a result, we are able to generalize our findings to tasks that typically result in smaller effect sizes than do motor tasks. This is increasingly important as NIRS comes into use for brain mapping studies across a wide range of cognitive domains. Recording during multiple tasks and from multiple locations also meant that we had a large number of instances, or pairs of fMRI/NIRS time courses, to compare. This enabled us to perform higher-powered statistical comparisons than had previously been possible.
NIRS is unique among imaging modalities in that it measures changes in both oxy- and deoxy-Hb concentrations. Kleinschmidt et al. (Kleinschmidt et al., 1996) found that increased BOLD response in motor cortex was accompanied by decreased deoxy-Hb during a motor task. Subsequent studies have found strong correlations between oxy-Hb and fMRI BOLD. Strangman et al. (Strangman et al., 2002) found highly variable correlations with deoxy-Hb and, after accounting for several possible sources of error, found that the strongest correlations were with oxy-Hb. The authors suggest that this may be due to slightly higher signal-to-noise in the oxy-Hb measure. In our data, we find that oxy-Hb has a significant but small advantage over deoxy-Hb in terms of correlation with BOLD, but no significant difference in CNR. A lack of clear difference is perhaps not surprising given that oxy- and deoxy-Hb are highly negatively correlated (Cui et al., 2010).
We found that task-related CNR was one factor which influenced the strength of BOLD-NIRS correlations. Nonetheless, regions showing low task-related CNR also occasionally showed strong correlations. In non-task responsive regions, physiological (cardiac and respiratory functions (Chang et al., 2009)) or thermal processes likely contribute a higher proportion of signal variance. Concurrent measurement of physiological responses could help to reduce such errors (Tachtsidis et al., 2009; Glover et al., 2000); also see Strangman et al. (Strangman et al., 2003) for a discussion of additional sources of error in NIRS signal.
NIRS measurements rely on the relatively low absorption of biological tissue to infrared light and the large difference in the absorption spectra of oxy-Hb and deoxy-Hb in this range. As photons are emitted they enter the head and traverse several layers: skin, skull, and CSF, before penetrating the surface of the brain. Previous empirical and simulation studies have addressed the issue of spatial resolution of NIRS and the most likely shape for the photon path (Okada et al., 1995; Okada and Delpy, 2003; Okada et al., 1997) and estimated the likely contribution of specific brain regions to the NIRS signal (Zhang et al., 2005a). Here, we have adopted a different approach, directly correlating fMRI signals for different ROI shapes with NIRS measurements, in order to perform a quantitative comparison of these two methodologies. With this approach we were able to identify the most likely of several possible path shapes.
One particularly salient finding was that increased scalp-brain distance reduces NIRS CNR and correlation with BOLD and seems to affect NIRS-fMRI correlation more strongly than the experimental paradigm. Variability in scalp-brain distance across individuals may be one factor contributing to variance in signal quality from different individuals. While head shapes will undoubtedly vary, our analysis of the standard template brain indicated that frontal regions have shorter scalp-brain distance than medial parietal regions. This has important implications for the choice of paradigm and recording sites for NIRS studies. Frontal regions that can be recorded by placing NIRS probes on the forehead also have the advantage of being hairless, which allows increased contact of the probes with the scalp. We caution that this does not mean that one cannot obtain reliable measurements from parietal regions, as previous studies have done so (Herrmann et al., 2005), but rather that the likelihood of weakened CNR in some regions should inform the task design and interpretation of results. One may also consider the possibility of altering the emitter-detector distance when recording in certain regions in order to deepen the photon path. We also note that in our data we found qualitatively better correspondence between BOLD and NIRS signals in parietal regions for some tasks, perhaps indicating that despite larger scalp-brain distance, the activated tissue (i.e. with higher BOLD CNR) was closer to the brain surface than in frontal regions.
All of the tasks in the present study were set up as block designs in order to maximize the signal-to-noise ratio. While this was entirely appropriate for a preliminary investigation of fMRI/NIRS correlations, it would also be interesting to compare responses during an event-related design. Given the reduced CNR of NIRS relative to fMRI, it is of interest whether event-related designs are practical. Several studies have successfully reported results from event-related NIRS paradigms (Nishimura et al., 2010; Boecker et al., 2007; Lee et al., 2008). Plichta et al. (Plichta et al., 2006) found strong reproducibility of group-level event-related activations of visual cortex, but poor reproducibility at the single-subject level. A direct comparison of event-related NIRS and fMRI could be informative on this point.
We note that our spatial analysis does not provide a definite description of the photon path, but merely a sense of the spatial correspondence with fMRI. We also note that we did not incorporate information about underlying sulcal geometry into our estimation of the NIRS photon path. Previous studies have used segmented MRI images, combined with Monte Carlo simulations of light transport, to estimate the spatial distribution of the source of the NIRS signal in three dimensions (Zhang et al., 2005a; Toronov et al., 2007). In this study we favored a purely empirical approach, correlating the signal along different paths with the NIRS response. However, a more informed model of the underlying geometry could in principle help constrain the photon path and potentially provide information about the strength of NIRS signals from the surfaces of gyri relative to sulci.
Finally, we analyzed the NIRS and fMRI data separately to establish whether similar conclusions would be drawn from data collected on the same participants and using the same tasks. We found qualitatively similar activations in the NIRS and fMRI analyses, though with higher significance in the fMRI data. This analysis emphasizes the utility of a structural MRI in conjunction with NIRS data, as the activations are much more difficult to localize precisely without this information. We also note that in some instances (e.g. tapping task), NIRS signals show significant activation in regions that do not show significant activations in the fMRI data (e.g. frontal regions). This indicates that, due to lower CNR, NIRS data may be more susceptible to false positives. Correcting for physiological noise (Tachtsidis et al., 2009; Glover et al., 2000) or filtering out global signals using principal components analysis (PCA) (Virtanen et al., 2009) could potentially reduce the occurrence of false positives. However, as the purpose of the present study was a comparison of NIRS and fMRI signals, we chose to apply similar band-pass filtering to data collected from both modalities to correct for physiological noise.
Simultaneous acquisition of NIRS and fMRI has previously been used to elucidate the biophysics of the BOLD response (Hoge et al., 2005; Toronov et al., 2003; Kleinschmidt et al., 1996), to enhance fMRI measurements with information about blood flow (Mehagnoul-Schipper et al., 2002), or to establish correlations between fMRI and NIRS signals in terms of spatial location or amplitude (Toronov et al., 2001a; Strangman et al., 2002; Toronov et al., 2007). A synthesis of the results of these studies indicates that though the SNR of NIRS measurements is lower, there is nonetheless a strong correlation between signals measured with NIRS and fMRI. The present study makes several novel contributions to this literature. First, we demonstrated that this correlation is present during cognitive tasks that generate more subtle activation changes relative to motor or visual tasks. We also established that reduced CNR leads to reduced correlation between NIRS and fMRI signals. We investigated the relationship between head geometry and NIRS-fMRI correlations and found that scalp-brain distance was an important factor in determining the strength of this correlation. We also found that the NIRS signal was most strongly correlated with the fMRI signal along an elliptical path. Since NIRS has become increasingly popular for brain mapping studies across a range of cognitive domains, studies such as this should help to build confidence in NIRS as a complement to fMRI.
Research highlights.
We performed simultaneous NIRS/fMRI recording while 13 participants performed motor and cognitive tasks.
We found that NIRS signals have weaker signal-to-noise ratio, but are nonetheless often highly correlated with fMRI measurements.
Both signal-to-noise ratio and the distance between the scalp and the brain contributed to variability in the NIRS/fMRI correlations.
In the spatial domain, we found that a photon path forming an ellipse between the NIRS emitter and detector, with a depth of ~14 mm, correlated most strongly with the BOLD response.
Supplementary Material
Acknowledgments
This work is supported by S10 RR024657 (ALR PI), P41 RR009874 (GHG), the Stanford Institute for Neuro-Innovation and Translational Neurosciences (SINTN) fellowship (XC and ALR), NARSAD Young Investigator’s Award, and Stanford University Lucas Center Radiology Seed Grant. We thank Dr Fumiko Hoeft for her invaluable assistance in planning the experiments and solving technical issues. We thank Sebastian Heinzel for valuable suggestions and comments on this project. We thank Joerg Schnackenberg and Hitachi Medical Inc., for invaluable assistance with hardware setup for this study.
Footnotes
Publisher's Disclaimer: This is a PDF file of an unedited manuscript that has been accepted for publication. As a service to our customers we are providing this early version of the manuscript. The manuscript will undergo copyediting, typesetting, and review of the resulting proof before it is published in its final citable form. Please note that during the production process errors may be discovered which could affect the content, and all legal disclaimers that apply to the journal pertain.
References
- Abdelnour F, Schmidt B, Huppert TJ. Topographic localization of brain activation in diffuse optical imaging using spherical wavelets. Phys Med Biol. 2009;54:6383–413. doi: 10.1088/0031-9155/54/20/023. [DOI] [PMC free article] [PubMed] [Google Scholar]
- Atsumori H, Kiguchi M, Obata A, Sato H, Katura T, Funane T, Maki A. Development of wearable optical topography system for mapping the prefrontal cortex activation. Review Of Scientific Instruments. 2009;80:043704. doi: 10.1063/1.3115207. [DOI] [PubMed] [Google Scholar]
- Boas DA, Strangman G, Culver JP, Hoge RD, Jasdzewski G, Poldrack RA, Rosen BR, Mandeville JB. Can the cerebral metabolic rate of oxygen be estimated with near-infrared spectroscopy? Physics In Medicine And Biology. 2003;48:2405–2418. doi: 10.1088/0031-9155/48/15/311. [DOI] [PubMed] [Google Scholar]
- Boecker M, Buecheler MM, Schroeter ML, Gauggel S. Prefrontal brain activation during stop-signal response inhibition: an event-related functional near-infrared spectroscopy study. Behavioural brain research. 2007;176:259–66. doi: 10.1016/j.bbr.2006.10.009. [DOI] [PubMed] [Google Scholar]
- Buxton RB, Wong EC, Frank LR. Dynamics of blood flow and oxygenation changes during brain activation: The balloon model. Magnetic Resonance In Medicine. 1998;39:855–864. doi: 10.1002/mrm.1910390602. [DOI] [PubMed] [Google Scholar]
- Chang C, Cunningham JP, Glover GH. Influence of heart rate on the BOLD signal: the cardiac response function. Neuroimage. 2009;44:857–69. doi: 10.1016/j.neuroimage.2008.09.029. [DOI] [PMC free article] [PubMed] [Google Scholar]
- Cope M, Delpy DT. System for long-term measurement of cerebral blood and tissue oxygenation on newborn infants by near infra-red transillumination. Med Biol Eng Comput. 1988;26:289–94. doi: 10.1007/BF02447083. [DOI] [PubMed] [Google Scholar]
- Cope M. The application of near infrared spectroscopy to non-invasive monitoring of cerebral oxygenation in the newborn infant. University College; London: 1991. [Google Scholar]
- Coyle S, Ward T, Markham C, McDarby G. On the suitability of near-infrared (NIR) systems for next-generation brain-computer interfaces. Physiological Measurement. 2004;25:815–822. doi: 10.1088/0967-3334/25/4/003. [DOI] [PubMed] [Google Scholar]
- Coyle SM, Ward TE, Markham CM. Brain-computer interface using a simplified functional near-infrared spectroscopy system. Journal of neural engineering. 2007;4:219–26. doi: 10.1088/1741-2560/4/3/007. [DOI] [PubMed] [Google Scholar]
- Cui X, Bray S, Reiss AL. Functional near infrared spectroscopy (NIRS) signal improvement based on negative correlation between oxygenated and deoxygenated hemoglobin dynamics. Neuroimage. 2010;49:3039–46. doi: 10.1016/j.neuroimage.2009.11.050. [DOI] [PMC free article] [PubMed] [Google Scholar]
- Emir UE, Ozturk C, Akin A. Multimodal investigation of fMRI and fNIRS derived breath hold BOLD signals with an expanded balloon model. Physiological Measurement. 2008;29:49–63. doi: 10.1088/0967-3334/29/1/004. [DOI] [PubMed] [Google Scholar]
- Glover GH, Li TQ, Ress D. Image-based method for retrospective correction of physiological motion effects in fMRI: RETROICOR. Magn Reson Med. 2000;44:162–7. doi: 10.1002/1522-2594(200007)44:1<162::aid-mrm23>3.0.co;2-e. [DOI] [PubMed] [Google Scholar]
- Glover GH, Law CS. Spiral-in/out BOLD fMRI for increased SNR and reduced susceptibility artifacts. Magn Reson Med. 2001;46:515–22. doi: 10.1002/mrm.1222. [DOI] [PubMed] [Google Scholar]
- Haberecht MF, Menon V, Warsofsky IS, White CD, Dyer-Friedman J, Glover GH, Neely EK, Reiss AL. Functional neuroanatomy of visuo-spatial working memory in Turner syndrome. Hum Brain Mapp. 2001;14:96–107. doi: 10.1002/hbm.1044. [DOI] [PMC free article] [PubMed] [Google Scholar]
- Herrmann MJ, Ehlis AC, Wagener A, Jacob CP, Fallgatter AJ. Near-infrared optical topography to assess activation of the parietal cortex during a visuo-spatial task. Neuropsychologia. 2005;43:1713–20. doi: 10.1016/j.neuropsychologia.2005.02.011. [DOI] [PubMed] [Google Scholar]
- Hoeft F, Hernandez A, Parthasarathy S, Watson CL, Hall SS, Reiss AL. Fronto-striatal dysfunction and potential compensatory mechanisms in male adolescents with fragile X syndrome. Hum Brain Mapp. 2007;28:543–54. doi: 10.1002/hbm.20406. [DOI] [PMC free article] [PubMed] [Google Scholar]
- Hoge RD, Franceschini MA, Covolan RJM, Huppert T, Mandeville JB, Boas DA. Simultaneous recording of task-induced changes in blood oxygenation, volume, and flow using diffuse optical imaging and arterial spin-labeling MRI. Neuroimage. 2005;25:701–707. doi: 10.1016/j.neuroimage.2004.12.032. [DOI] [PubMed] [Google Scholar]
- Honda Y, Nakato E, Otsuka Y, Kanazawa S, Kojima S, Yamaguchi MK, Kakigi R. How do infants perceive scrambled face?: A near-infrared spectroscopic study. Brain Res. 2010;1308:137–46. doi: 10.1016/j.brainres.2009.10.046. [DOI] [PubMed] [Google Scholar]
- Huppert TJ, Allen MS, Benav H, Jones PB, Boas DA. A multicompartment vascular model for inferring baseline and functional changes in cerebral oxygen metabolism and arterial dilation. J Cereb Blood Flow Metab. 2007;27:1262–79. doi: 10.1038/sj.jcbfm.9600435. [DOI] [PMC free article] [PubMed] [Google Scholar]
- Huppert TJ, Allen MS, Diamond SG, Boas DA. Estimating cerebral oxygen metabolism from fMRI with a dynamic multicompartment Windkessel model. Hum Brain Mapp. 2009;30:1548–67. doi: 10.1002/hbm.20628. [DOI] [PMC free article] [PubMed] [Google Scholar]
- Huppert TJ, Diamond SG, Boas DA. Direct estimation of evoked hemoglobin changes by multimodality fusion imaging. J Biomed Opt. 2008;13:054031. doi: 10.1117/1.2976432. [DOI] [PMC free article] [PubMed] [Google Scholar]
- Huppert TJ, Hoge RD, Dale AM, Franceschini MA, Boas DA. Quantitative spatial comparison of diffuse optical imaging with blood oxygen level-dependent and arterial spin labeling-based functional magnetic resonance imaging. J Biomed Opt. 2006a;11:064018. doi: 10.1117/1.2400910. [DOI] [PMC free article] [PubMed] [Google Scholar]
- Huppert TJ, Hoge RD, Diamond SG, Franceschini MA, Boas DA. A temporal comparison of BOLD, ASL, and NIRS hemodynamic responses to motor stimuli in adult humans. NeuroImage. 2006b;29:368–82. doi: 10.1016/j.neuroimage.2005.08.065. [DOI] [PMC free article] [PubMed] [Google Scholar]
- Kennan RP, Kim D, Maki A, Koizumi H, Constable RT. Non-invasive assessment of language lateralization by Transcranial near infrared optical topography and functional MRI. Human Brain Mapping. 2002;16:183–189. doi: 10.1002/hbm.10039. [DOI] [PMC free article] [PubMed] [Google Scholar]
- Kesler SR, Haberecht MF, Menon V, Warsofsky IS, Dyer-Friedman J, Neely EK, Reiss AL. Functional neuroanatomy of spatial orientation processing in Turner syndrome. Cereb Cortex. 2004;14:174–80. doi: 10.1093/cercor/bhg116. [DOI] [PMC free article] [PubMed] [Google Scholar]
- Kleinschmidt A, Obrig H, Requardt M, Merboldt KD, Dirnagl U, Villringer A, Frahm J. Simultaneous recording of cerebral blood oxygenation changes during human brain activation by magnetic resonance imaging and near-infrared spectroscopy. Journal Of Cerebral Blood Flow And Metabolism. 1996;16:817–826. doi: 10.1097/00004647-199609000-00006. [DOI] [PubMed] [Google Scholar]
- Lee J, Folley BS, Gore J, Park S. Origins of spatial working memory deficits in schizophrenia: an event-related FMRI and near-infrared spectroscopy study. PloS one. 2008;3:e1760. doi: 10.1371/journal.pone.0001760. [DOI] [PMC free article] [PubMed] [Google Scholar]
- Lu CM, Zhang YJ, Biswal BB, Zang YF, Peng DL, Zhu CZ. Use of fNIRS to assess resting state functional connectivity. J Neurosci Methods. 2010;186:242–9. doi: 10.1016/j.jneumeth.2009.11.010. [DOI] [PubMed] [Google Scholar]
- Malonek D, Dirnagl U, Lindauer U, Yamada K, Kanno I, Grinvald A. Vascular imprints of neuronal activity: relationships between the dynamics of cortical blood flow, oxygenation, and volume changes following sensory stimulation. Proc Natl Acad Sci USA. 1997;94:14826–31. doi: 10.1073/pnas.94.26.14826. [DOI] [PMC free article] [PubMed] [Google Scholar]
- Mehagnoul-Schipper DJ, van Colier WNJM, van Erning LJTO, Thijssen HOM, Oeseburg B, Hoefnagels WHL, Jansen RWMM. Simultaneous measurements of cerebral oxygenation changes during brain activation by near-infrared spectroscopy and functional magnetic resonance imaging in healthy young and elderly subjects. Human Brain Mapping. 2002;16:14–23. doi: 10.1002/hbm.10026. [DOI] [PMC free article] [PubMed] [Google Scholar]
- Nishimura Y, Sugisaki K, Hattori N, Inokuchi Y, Komachi M, Nishimura Y, Ogawa M, Okada M, Okazaki Y, Taki W, et al. An event-related fNIRS investigation of Japanese word order. Experimental Brain Research. 2010;202:239–246. doi: 10.1007/s00221-009-2113-x. [DOI] [PubMed] [Google Scholar]
- Obata T, Liu TT, Miller KL, Luh WM, Wong EC, Frank LR, Buxton RB. Discrepancies between BOLD and flow dynamics in primary and supplementary motor areas: application of the balloon model to the interpretation of BOLD transients. Neuroimage. 2004;21:144–153. doi: 10.1016/j.neuroimage.2003.08.040. [DOI] [PubMed] [Google Scholar]
- Ogawa S, Lee TM, Kay AR, Tank DW. Brain magnetic resonance imaging with contrast dependent on blood oxygenation. Proceedings Of The National Academy Of Sciences Of The United States Of America. 1990;87:9868–9872. doi: 10.1073/pnas.87.24.9868. [DOI] [PMC free article] [PubMed] [Google Scholar]
- Okada E, Firbank M, Schweiger M, Arridge SR, Cope M, Delpy DT. Theoretical and experimental investigation of near-infrared light propagation in a model of the adult head. Appl Opt. 1997;36:21–31. doi: 10.1364/ao.36.000021. [DOI] [PubMed] [Google Scholar]
- Okada E, Firbank M, Delpy DT. The effect of overlying tissue on the spatial sensitivity profile of near-infrared spectroscopy. Physics In Medicine And Biology. 1995;40:2093–2108. doi: 10.1088/0031-9155/40/12/007. [DOI] [PubMed] [Google Scholar]
- Okada E, Delpy DT. Near-infrared light propagation in an adult head model. I. Modeling of low-level scattering in the cerebrospinal fluid layer. Applied Optics. 2003 doi: 10.1364/ao.42.002906. [DOI] [PubMed] [Google Scholar]
- Okamoto M, Dan H, Shimizu K, Takeo K, Amita T, Oda I, Konishi I, Sakamoto K, Isobe S, Suzuki T, et al. Multimodal assessment of cortical activation during apple peeling by NIRS and fMRI. NeuroImage. 2004;21:1275–88. doi: 10.1016/j.neuroimage.2003.12.003. [DOI] [PubMed] [Google Scholar]
- Plichta MM, Herrmann MJ, Baehne CG, Ehlis AC, Richter MM, Pauli P, Fallgatter AJ. Event-related functional near-infrared spectroscopy (fNIRS): are the measurements reliable? Neuroimage. 2006;31:116–24. doi: 10.1016/j.neuroimage.2005.12.008. [DOI] [PubMed] [Google Scholar]
- Power SD, Falk TH, Chau T. Classification of prefrontal activity due to mental arithmetic and music imagery using hidden Markov models and frequency domain near-infrared spectroscopy. Journal Of Neural Engineering. 2010;7:026002. doi: 10.1088/1741-2560/7/2/026002. [DOI] [PubMed] [Google Scholar]
- Schroeter ML, Kupka T, Mildner T, Uludag K, von Cramon DY. Investigating the post-stimulus undershoot of the BOLD signal--a simultaneous fMRI and fNIRS study. NeuroImage. 2006;30:349–58. doi: 10.1016/j.neuroimage.2005.09.048. [DOI] [PubMed] [Google Scholar]
- Sitaram R, Zhang HH, Guan CT, Thulasidas M, Hoshi Y, Ishikawa A, Shimizu K, Birbaumer N. Temporal classification of multichannel near-infrared spectroscopy signals of motor imagery for developing a brain-computer interface. Neuroimage. 2007;34:1416–1427. doi: 10.1016/j.neuroimage.2006.11.005. [DOI] [PubMed] [Google Scholar]
- Steinbrink J, Villringer A, Kempf F, Haux D, Boden S, Obrig H. Illuminating the BOLD signal: combined fMRI-fNIRS studies. Magnetic resonance imaging. 2006;24:495–505. doi: 10.1016/j.mri.2005.12.034. [DOI] [PubMed] [Google Scholar]
- Strangman G, Culver JP, Thompson JH, Boas DA. A quantitative comparison of simultaneous BOLD fMRI and NIRS recordings during functional brain activation. NeuroImage. 2002;17:719–31. [PubMed] [Google Scholar]
- Strangman G, Franceschini MA, Boas DA. Factors affecting the accuracy of near-infrared spectroscopy concentration calculations for focal changes in oxygenation parameters. Neuroimage. 2003;18:865–879. doi: 10.1016/s1053-8119(03)00021-1. [DOI] [PubMed] [Google Scholar]
- Suda M, Takei Y, Aoyama Y, Narita K, Sato T, Fukuda M, Mikuni M. Frontopolar activation during face-to-face conversation: An in situ study using near-infrared spectroscopy. Neuropsychologia. 2010;48:441–447. doi: 10.1016/j.neuropsychologia.2009.09.036. [DOI] [PubMed] [Google Scholar]
- Tachtsidis I, Leung TS, Chopra A, Koh PH, Reid CB, Elwell CE. False positives in functional near-infrared topography. Oxygen Transport To Tissue Xxx Book Series: Advances In Experimental Medicine And Biology. 2009;645:307–314. doi: 10.1007/978-0-387-85998-9_46. [DOI] [PubMed] [Google Scholar]
- Tomioka H, Yamagata B, Takahashi T, Yano M, Isomura AJ, Kobayashi H, Mimura M. Detection of hypofrontality in drivers with Alzheimer’s disease by near-infrared spectroscopy. Neurosci Lett. 2009;451:252–6. doi: 10.1016/j.neulet.2008.12.059. [DOI] [PubMed] [Google Scholar]
- Toronov V, Walker S, Gupta R, Choi JH, Gratton E, Hueber D, Webb A. The roles of changes in deoxyhemoglobin concentration and regional cerebral blood volume in the fMRI BOLD signal. Neuroimage. 2003;19:1521–1531. doi: 10.1016/s1053-8119(03)00152-6. [DOI] [PubMed] [Google Scholar]
- Toronov V, Webb A, Choi JH, Wolf M, Michalos A, Gratton E, Hueber D. Investigation of human brain hemodynamics by simultaneous near-infrared spectroscopy and functional magnetic resonance imaging. Medical Physics. 2001a;28:521–527. doi: 10.1118/1.1354627. [DOI] [PubMed] [Google Scholar]
- Toronov V, Webb A, Choi JH, Wolf M, Safonova L, Wolf U, Gratton E. Study of local cerebral hemodynamics by frequency-domain near-infrared spectroscopy and correlation with simultaneously acquired functional magnetic resonance imaging. Opt Express. 2001b;9:417–27. doi: 10.1364/oe.9.000417. [DOI] [PubMed] [Google Scholar]
- Toronov VY, Zhang X, Webb AG. A spatial and temporal comparison of hemodynamic signals measured using optical and functional magnetic resonance imaging during activation in the human primary visual cortex. NeuroImage. 2007;34:1136–48. doi: 10.1016/j.neuroimage.2006.08.048. [DOI] [PMC free article] [PubMed] [Google Scholar]
- Utsugi K, Obata A, Sato H, Aoki R, Maki A, Koizumi H, Sagara K, Kawamichi H, Atsumori H, Katura T. GO-STOP Control Using Optical Brain-computer Interface during Calculation Task. IEICE Transactions on Communications E91-B. 2008:2133–2141. [Google Scholar]
- Virtanen J, Noponen T, Merilainen P. Comparison of principal and independent component analysis in removing extracerebral interference from near-infrared spectroscopy signals. Journal Of Biomedical Optics. 2009;14:054032. doi: 10.1117/1.3253323. [DOI] [PubMed] [Google Scholar]
- White BR, Snyder AZ, Cohen AL, Petersen SE, Raichle ME, Schlaggar BL, Culver JP. Resting-state functional connectivity in the human brain revealed with diffuse optical tomography. NeuroImage. 2009;47:148–56. doi: 10.1016/j.neuroimage.2009.03.058. [DOI] [PMC free article] [PubMed] [Google Scholar]
- Zhang H, Zhang YJ, Lu CM, Ma SY, Zang YF, Zhu CZ. Functional connectivity as revealed by independent component analysis of resting-state fNIRS measurements. Neuroimage. 2010;51:1150–61. doi: 10.1016/j.neuroimage.2010.02.080. [DOI] [PubMed] [Google Scholar]
- Zhang XF, Toronov VY, Webb AG. Integrated measurement system for simultaneous functional magnetic resonance imaging and diffuse optical tomography in human brain mapping. Review Of Scientific Instruments. 2006;77:114301. doi: 10.1063/1.2364138. [DOI] [PMC free article] [PubMed] [Google Scholar]
- Zhang XF, Toronov VY, Webb AG. Simultaneous integrated diffuse optical tomography and functional magnetic resonance imaging of the human brain. Optics Express. 2005a;13:5513–5521. doi: 10.1364/opex.13.005513. [DOI] [PMC free article] [PubMed] [Google Scholar]
- Zhang Y, Brooks DH, Franceschini MA, Boas DA. Eigenvector-based spatial filtering for reduction of physiological interference in diffuse optical imaging. Journal of biomedical optics. 2005b;10:11014. doi: 10.1117/1.1852552. [DOI] [PubMed] [Google Scholar]
- van der Zee P, Arridge SR, Cope M, Delpy DT. The effect of optode positioning on optical pathlength in near infrared spectroscopy of brain. Adv Exp Med Biol. 1990;277:79–84. doi: 10.1007/978-1-4684-8181-5_11. [DOI] [PubMed] [Google Scholar]
Associated Data
This section collects any data citations, data availability statements, or supplementary materials included in this article.


