Abstract
Mathematical modeling of complex gene expression programs is an emerging tool for understanding disease mechanisms. However, identification of large models sometimes requires training using qualitative, conflicting or even contradictory data sets. One strategy to address this challenge is to estimate experimentally constrained model ensembles using multiobjective optimization. In this study, we used Pareto Optimal Ensemble Techniques (POETs) to identify a family of proof-of-concept signal transduction models. POETs integrate Simulated Annealing (SA) with Pareto optimality to identify models near the optimal tradeoff surface between competing training objectives. We modeled a prototypical-signaling network using mass action kinetics within an ordinary differential equation (ODE) framework (64-ODEs in total). The true model was used to generate synthetic immunoblots from which the POET algorithm identified the 117 unknown model parameters. POET generated an ensemble of signaling models, which collectively exhibited population-like behavior. For example, scaled gene expression levels were approximately normally distributed over the ensemble following the addition of extracellular ligand. Also, the ensemble recovered robust and fragile features of the true model, despite significant parameter uncertainty. Taken together, these results suggest that experimentally constrained model ensembles could capture qualitatively important network features without exact parameter information.
Keywords: Systems biology, mathematical modeling, robustness and fragility
Introduction
Mathematical modeling of signal transduction and gene expression programs is an emerging tool for understanding disease mechanisms. Kitano suggested that analysis of molecular networks using predictive computer models will play an increasingly important role in biomedical research [1]. However, conventional wisdom suggests that the data requirement to identify and validate complex mechanistic models is too large. Molecular network models often exhibit complex behavior [2]. Typically, it is not possible to uniquely identify model parameters, even with extensive training data and perfect models [3]. Thus, despite identification standards [4] and the integration of model identification with experimental design [5], parameter estimation remains challenging even with structurally complete models. This reality has brought into the foreground a number of interesting questions. For example, do we actually need exact parameter knowledge to predict qualitatively important properties of a molecular network? Or can we estimate which components and connections are central to network function given only limited parameter information?
Two schools of thought have emerged on how uncertain models can be used to understand molecular network function. Bailey hypothesized that qualitative properties of metabolic or signaling networks could be determined using network structure without parameter knowledge [6]. Certainly, there is literature evidence supporting the Bailey hypothesis in metabolic networks [7]. Studies exploring network modularity [8] have also identified recurrent motifs that betray natural design principles. Alternatively, ensemble approaches, which use uncertain model families have also emerged, to deal with uncertainty in systems biology and other fields like weather prediction [9-13]. Their central value has been the ability to quantify simulation uncertainty and to constrain model predictions. For example, Gutenkunst et al. showed that predictions were possible using ensembles of signal transduction models despite sometimes only order of magnitude parameter estimates [14]. Beyond their ability to robustly describe data, uncertain deterministic ensembles might be a course-grained strategy to explore population dynamics when stochastic simulation is too expensive. There are several techniques to generate parameter ensembles. Battogtokh et al. and later Brown et al. generated experimentally constrained parameter ensembles using a Metropolis-type random walk through parameter space [10, 12]. Moles et al. contrasted evolutionary and deterministic optimization techniques [15], any one of which could be adapted for ensemble generation. However, the unifying component of these previous identification strategies has been the minimization of a single objective function.
In this study, we used Pareto Optimal Ensemble Techniques (POETs) to identify a family of proof-of-concept signal transduction models. Our objectives were to test a modification to the original POET algorithm published by Song et al. [9] and to more deeply explore the properties of model ensembles. The motivation for POETs is practical. The identification of models with hundreds, thousands or even tens of thousands of parameters requires that we use measurements from multiple laboratories or even different cell-lines. These training data can contain conflicts or can sometimes even be contradictory. Thus, a central challenge when identifying large models is the ability to balance conflicts in diverse training data. POETs, which integrate simulated annealing and multiobjective optimization through the notion of Pareto rank find solutions, which optimally balance these trade-offs. The modified POETs strategy described here improved the performance of the original algorithm using a local parameter refinement step. Interestingly, the model ensemble generated using POET exhibited coarse-grained heterogeneity, suggesting that deterministic ensembles could perhaps be used to model heterogeneous populations. A secondary challenge was the subsequent characterization of network features in a family of models, using sensitivity analysis. Sensitivity analysis has enabled the investigation of robustness and fragility in molecular networks; see [9, 16-19]. Sensitivity analysis has also been crucial to model identification, discrimination and experimental design [3, 20-23]. However, sensitivity analysis, using first-order sensitivity coefficients, is a function of the model parameters. Thus, another open question explored here was whether qualitative properties estimated by sensitivity analysis were recovered by the ensemble. We demonstrate that model ensembles recovered highly robust and fragile features of the true model, despite significant parameter uncertainty.
Materials and Methods
Formulation, solution and analysis of the model equations
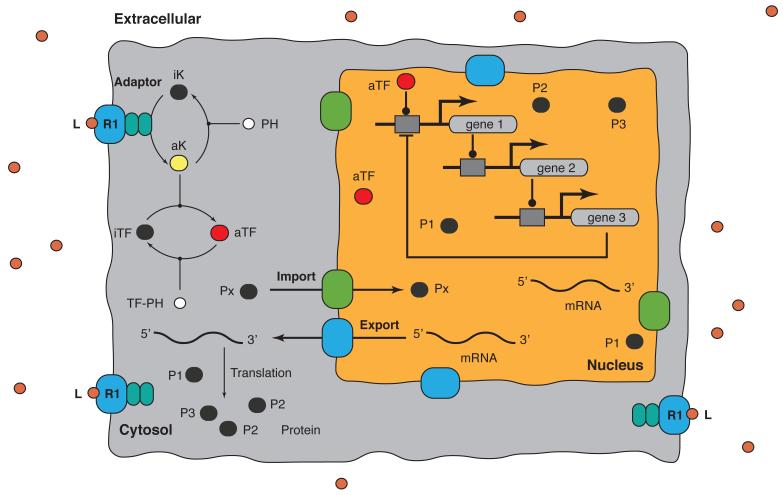
We identified a family of models describing a growth factor induced three-gene transcriptional program (Fig. 1). The model is available in SBML format in the supplemental materials. The model was formulated as a set of coupled Ordinary Differential Equations (ODEs):
| (1) |
where x denotes the species concentration vector (64 × 1), k denotes the parameter vector (117 × 1) and r(x,k) denotes the vector of reaction rates (117 × 1). The symbol S denotes the stoichiometric matrix (64 × 117). The (i,j) element of S, denoted by σij, described the relationship between protein i and rate j. If σij < 0, then protein i was consumed in rj. Conversely, if σij > 0, protein i was produced by rj. Lastly, if σij = 0, protein i was not involved in rate j. The symbol y denotes the model output vector, where Y denotes the measurement selection matrix.
Fig. 1.
Schematic of the prototypical signaling network used in this study. Extracellular ligand L binds surface receptor R1 driving the phosphorylation of transcription factor TF. TF up-regulates gene 1 expression. Gene 1 then initiates a cascade resulting in the expression of gene 2 and gene 3. Gene 3 down-regulates the expression of gene 1. The model is available in SBML format in the supplemental materials.
We assumed mass-action kinetics for each interaction in the network. The rate expression for reaction q was given by:
| (2) |
The quantity {Rq} denotes the set of reactants for reaction q, while kq denotes the rate constant governing reaction q. The symbols σjq denote the stoichiometric coefficients (elements of S) for the reactants involved with reaction q. All reversible interactions were split into two irreversible steps, thus, every interaction in the model was non-negative. Inactive or infrastructure proteins and macromolecules (R1, A1, A2, iTF, iK, EXPORT, IMPORT, PH and PH-TF), RNAP and ribosomes were assumed to have zero-order production rates and first-order degradation rates. These rate constants were estimated along with the binding and catalytic model parameters. All initial conditions were zero except Gene 1, 2, and 3 (1 if present, 0 if absent). We accounted for membrane, cytosolic and nuclear proteins and mRNA by explicitly defining separate species in each of these compartments.
Mass-action kinetics, while expanding the dimension of the model, regularized its mathematical structure. This allowed automatic generation of the model code using the UNIVERSAL code generation tool. UNIVERSAL, an open source J ava code-generator, supports the generation of model code from text and SBML files. UNIVERSAL currently supports multiple code types (Matlab/Octave-M, Octave-C,Sundials-C, GSL-C and Sci-lab) and it is extensible with a simple plugin API. UNIVERSAL is freely available as a Google Code project. Model code was generated as a C++ Octave module and solved using the LSODE routine of Octave (www.octave.org). When calcul ating the response of the model to ligand, we ran the model to steady-state and then simulated the addition of ligand. The steady-state was estimated numerically by repeatedly solving the model equations and estimating the difference between subsequent time points:
| (3) |
The quantities x(t) and x(t +Δt) denote the simulated concentration vector at time t and t +Δt, respectively. The L2 vector-norm was used as the distance metric. We used Δt = 100s and γ = 0.01 for all simulations.
Sensitivity analysis was used to estimate which network components were fragile or robust. First-order sensitivity coefficients at time tq:
| (4) |
were computed by solving the kinetic-sensitivity equations [24]:
| (5) |
subject to the initial condition sj(t0)= 0. The quantity j denotes the parameter index, P denotes the number of parameters in the model, A denotes the Jacobian matrix, and bj denotes the j th column of the matrix of first-derivatives of the mass balances with respect to the parameters. Sensitivity coefficients were calculated by repeatedly solving the extended kinetic-sensitivity system for each parameter using the LSODE routine of OCTAVE (www.octave.org) over a sparse sampling (approximately 10%) of the ensemble (Fig. 3). The Jacobian A and the bj vector were calculated at each time step using their analytical expressions generated by UNIVERSAL. The resulting sensitivity coefficients were then scaled and time-averaged (Trapezoid rule):
| (6) |
where T denotes the final simulation time and αij = 1 (unscaled) or αij(t) = kj/xi(t) (scaled). The scaled time-averaged sensitivity coefficients were then organized into an array for each ensemble member:
| (7) |
where ε denotes the index of the ensemble member, P denotes the number of parameters, Nε denotes the number of ensemble samples and M denotes the number of model species. The matrix contained the time-averaged sensitivities for a single species for each parameter (rows) as a function of the ensemble (columns):
| (8) |
To estimate the relative fragility or robustness of species and reactions in the network, we decomposed the or the matrices using Singular Value Decomposition (SVD):
| (9) |
Coefficients of the left (right) singular vectors corresponding to largest β singular values of were rank-ordered to estimate important species (reaction) combinations. Only coefficients with magnitude greater than a threshold (δ = 0.1) were considered. The fraction of the β vectors in which a reaction or species index occurred was used to rank its importance. Similarly, the left singular vectors of showed which reaction combinations were important for species i while the right singular vectors rank-ordered which ensemble members contributed most significantly to the sensitivity of species i.
Fig. 3.
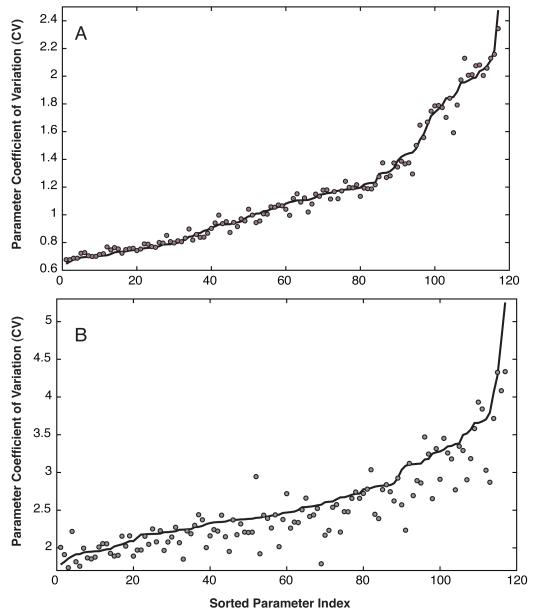
Coefficient of variation (CV) of model parameters estimated using POET with local parameter refinement (A) and the original implementation (B). The solid line denotes the mean CV calculated over the entire ensemble while the points denote the CV of the ensemble sample used in the sensitivity analysis calculations. Approximately 47% or 55 of 117 parameters had CV ≤ 1 for POET with local refinement. The minimum CV obtained using the original POET implementation was 1.7.
Pareto Optimal Ensemble Techniques (POETs)
POETs integrate Simulated Annealing (SA) with Pareto optimality to estimate parameter sets on or near the optimal tr a-deoff surface between competing training objectives (Fig. S1). Here, we modified the original algorithm [9] to improve its convergence properties. Denote a candidate parameter set at iteration i +1 as ki+1. The squared error for ki+1 for training set j was defined
| (10) |
as: The symbol denotes scaled experimental observations (from training set j) while the symbol denotes the scaled simulation output (from training set j). The quantity i denotes the sampled time-index and denotes the number of time points for experiment j. We assumed only immunoblots were available for training with the exception of a single qRT-PCR or ELISA measurement of the highest intensity band. T he first-term in the objective function quantified the relative simulation error. The read-out from the training immunoblots was band intensity where we assumed intensity was only loosely proportional to concentration. Suppose we have the intensity for species x at time i = {t1,t2,..,tn} in condition j. The scaled-value measurement would then be given by:
| (11) |
Under this scaling, the lowest intensity band equaled zero while the highest intensity band equaled one. A similar scaling was defined for the simulation output. The second-term in the objective function quantified the error in the estimated concentration scale. We assumed only the highest intensity bands were quantified absolutely (denoted by ) and compared with the simulation. However, if these measurements were not available, the second term could be adjusted to ensure the model operated on physiologically relevant concentration scales.
We computed the Pareto rank of ki+1 by comparing the simulation error at iteration i +1 against the simulation archive Ki. We used the Fonseca and Fleming ranking scheme [25]:
| (12) |
where p denotes the number of parameter sets that dominate parameter set ki+1. Parameter sets on or near the optimal trade-off surface have small rank (< 2). Sets with increasing rank are progressively further away from the optimal trade -off surface. The parameter set ki+1 was accepted or rejected by the SA with probability:
| (13) |
where T is the computational annealing temperature. The initial temperature To = n/log(2), where n is user defined (n = 4 for this study). The final temperature was Tf = 0.1. The annealing temperature was discretized into 10 quanta between To and Tf and adjusted according to the schedule Tk = βk T0 where β was defined as:
| (14) |
The epoch-counter k was incremented after the addition of 50 members to the ensemble. Thus, as the ensemble grew, the likelihood of accepting parameter sets with a large Pareto rank decreased. To generate parameter diversity, we randomly perturbed each parameter by ≤ ± 50%. However, in addition to a random-walk strategy (previous algorithm), we performed a local pattern-search every q steps to minimize the residual for a single randomly selected objective. The local pattern-search algorithm has been described previously [26, 27]. The parameter ensemble used in the simulation and sensitivity studies was generated from the low-rank parameter sets in Ki.
Results
We identified and analyzed a family of canonical signal transduction models using Pare- to Optimal Ensemble Techniques (POETs) and sensitivity analysis. POET has previously been used to identify molecular models of pain signaling [9]. We modified the original algorithm by integrating a local pattern-search routine, which better controlled the absolute error in the ensemble identification. The original and modified algorithms were used to estimate an ensemble of signaling models. The model, which was assumed to have a known network structure, described the integration of extracellular signals with kinase activation, the phosphorylation of transcription factors and the up-regulation of an associated transcriptional program (Fig. 1). Thus, while not specific to a particular growth factor, signaling cascade or expression program, it contained many of the general features encountered when identifying specific models. We modeled the molecular interactions in the prototypical-signaling network using mass action kinetics within an ordinary differential equation (ODE) framework. ODEs and mass-action kinetics are common methods of modeling biological pathways [9, 16-18, 28-32]. We assumed spatial homogeneity but differentiated between cytosolic, membrane and nuclear localized processes. The true model (known parameters) was used to generate synthetic data from which we tested the POET algorithm. Each synthetic measurement was assumed to be a Northern or Western blot. Thus, we knew only relative amounts of protein or mRNA for any specific condition or time. To constrain the absolute concentration scale, we assumed a single ELISA or qRT-PCR measurement for the highest intensity band in each case. Lastly, we limited our training data to 20 samples per experiment (an upper limit on the lanes available on a Western blot).
The modified POET algorithm performed better than the original implementation and generated an ensemble, which collectively exhibited population-like behavior. First, the ODE model used here was deterministic and did not describe stochastic gene expression fluctuations. However, because many different parameter sets were sampled, the deterministic ensemble exhibited population-like behavior. For example, scaled gene expression levels were approximately normally distributed following the addition of extracellular ligand. Thus, while gene expression was not described at a single-cell level, the ensemble captured coarse-grained expression heterogeneity. This suggested that deterministic ensembles could perhaps be used to model heterogeneous populations. Second, the model ensemble captured the robust and fragile features of the true model, despite significant parameter uncertainty. Edge (interactions between species) and node (species) ranks computed over the ensemble using sensitivity analysis were consistent with the true rankings, at least for highly fragile and robust network components. This suggested that, in practice, results from sensitivity analysis obtained by analyzing model ensembles could represent true behavior to a high degree of certainty, at least for highly fragile or robust network features. The true model is available in SBML format in the supplemental materials.
Estimating an ensemble of models using multiobjective optimization
We estimated an ensemble of signal transduction models from synthetic data sets using POET (Fig. S1). The canonical model had 117 unknown kinetic constants, primarily of three types (association, dissociation or catalytic rate constants). Because we used mass-action kinetics, every network interaction was governed by a single parameter. Using the true model, we generated 24 synthetic data sets using a (3,2,2,2)-level factorial design. The design variables considered were the level of ligand stimulation (L =0, L = 10 and L = 50) and the presence and absence of Gene 1, 2 and 3. In each data set, we assumed inactivated/activated kinase (cytosol), inactivated/activated transcription factor (cytosol), mRNA for protein 1 (cytosol) and the cytosolic level of protein 1 were measured at 20 points equidistant over the time-course of the experiment (approximately 3 hours). Each synthetic dataset became an objective in the optimization calculation from which we estimated the model ensemble (24 objectives in total).
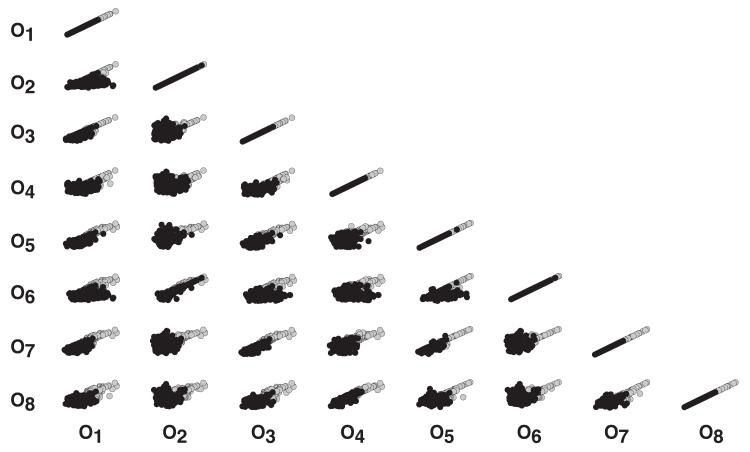
The POET algorithm with local parameter refinement performed better than the original implementation (Fig. 2). Both implementations started from the same randomized parameter seed, used the same software libraries and were run over a 72-hour period on the same hardware. Both implementations used a maximum acceptable Pare- to rank of three or less. The modified algorithm generated 2882 ranked sets, of which 1062 had a Pareto rank equal to zero (Fig. 2, black circles). On the other hand, the original POET implementation generated 20,645 ranked sets, where 1538 had a Pareto rank equal to zero (Fig. 2, grey circles). While local refinement required additional function evaluations, the median training residuals were less than the original implementation (Fig. S2). The quality of the resulting ensemble generated with local refinement was also higher. Approximately 47% of the model parameters (55 of 117) were constrained with a coefficient of variation (CV) of less than or equal to one (Fig. 3A). In comparison, the minimum CV produced by the original implementation was ≥ 1.7 (Fig. 3B). The top five constrained parameters were protein 1 (cytosol), RNAP and EXPORT degradation (all 0.64), the degradation of mRNA for gene 3 (0.65; negative regulator of P1 expression) and the constitutive expression of gene 1 (0.67). The top five least constrained parameters were associated with kinase regulation or regulated gene 1 expression (CV > 2). Well-constrained parameters were pseudo-normally distributed with a strong positive-skew, while parameters with a high CV were approximately exponentially distributed (Fig. S3). Analysis of the residuals produced by POET gave insight into relationships in the training data (Fig. 2). For example, O6 × O2 and similarly O8 × O4 were strongly correlated. This suggested that parameter sets that performed well for one objective had similar performance on the other. Other objectives showed no relationship (O8 × O2) or had strong fronts, for example O2 × O1.
Fig. 2.
Objective function array for parameter sets with Pareto rank = 0 for the original POET implementation (gray circles) and POET with local parameter refinement (black circles). Eight objectives are shown from the 24-objectives used in the model identification. The symbol Oj indicates the jth objective function. Points indicate the error associated with ensemble parameter sets. Objectives were defined using a (3,2,2,2)-level factorial design (ligand,gene1,gene2,gene3): O1 = (2,2,1,1),O2 = (2,2,1,2),O3 = (2,2,2,1),O4 = (2,2,2,2),O5 = (3,2,1,1),O6 = (3,2,1,2),O7 = (3,2,2,1) and O8 = (3,2,2,2). Design levels: Ligand (1,2,3) = (0,10,50) and gene j (1,2) = (deleted,present).
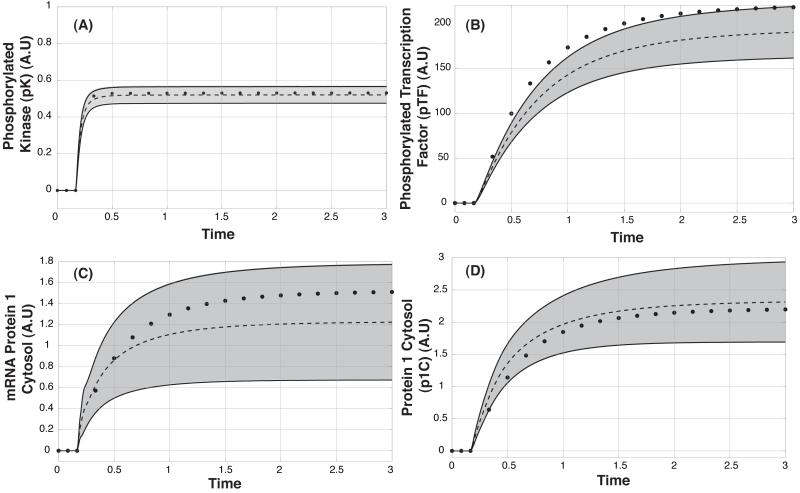
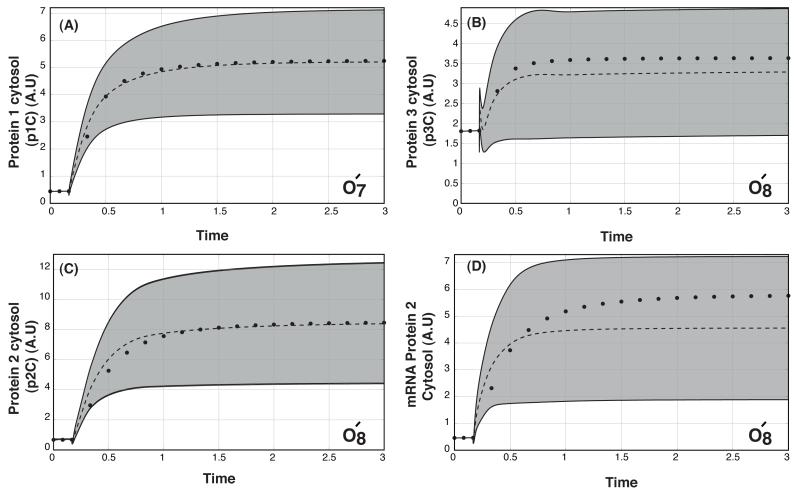
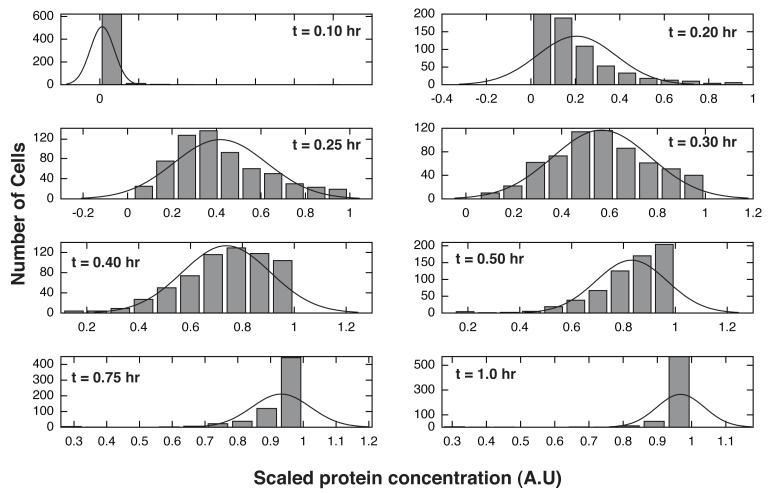
A key question is whether deterministic ensembles can describe heterogenous populations. We have suggested that ensembles represent the averaged behavior of different cellular subpopulations. To test this idea, we explored the overall and individual behavior of the ensemble models relative to the training data. Overall, the ensemble recapitulated the mean activation of key network species following ligand addition (Fig. 4). Beyond describing the data, the ensemble predicted the cytosolic levels of unmeasured species (protein/mRNA for protein 2 and 3) for an experimental design not used for training (Fig. 5). Different network components had varying levels of uncertainty. For example, the levels of activated kinase (Fig. 4A) were well constrained, while the cytosolic level of mRNA for protein 1 (Fig. 4C) had significant uncertainty. The ensemble captured the correct trend for the level of activated transcription factor but was not absolutely correct (Fig. 4B). The scaled levels of different model components were normally distributed across the ensemble. For example, the scaled levels of protein 1 in the cytosol were normally distributed during the expression phase of the network response (Fig. 6). Directly after ligand addition (t = 0.1 hr), the majority of cells were not expressing protein 1. However, after some time (t = 0.3 hr) the population of protein 1 expressing cells was normally distributed. After approximately t = 1 hr, the majority of cells had reached their maximum cytosolic level of protein 1. Interestingly, the correspondence between mRNA and protein levels varied significantly over the ensemble (Fig. S4). The mRNA-protein distribution shifted as a function of time to higher signal (Fig. S4, grey versus red circles) and became more biased toward protein.
Fig. 4.
Model performance following the addition of Ligand L for the O8 = (3,2,2,2) synthetic data set. A: Cytosolic levels of phosphorylated kinase versus time. B: Cytosolic levels of phosphorylated transcription factor versus time. C: Cytosolic levels of protein 1 mRNA versus time. D: Cytosolic level of protein 1 versus time. Dashed-lines denote the mean simulated value over the ensemble while the gray region denotes the 95% confidence interval. Points denote the mean synthetic data used to train/validate the model.
Fig. 5.
Model predictions following the addition of Ligand L versus modified synthetic data. The dashed-lines denote the mean simulated value over the ensemble while the gray region denotes the 95% confidence interval. The points denote the mean synthetic data used to validate the model. The validation data was generated from the training data by adding a background level of the ligand (L = 1) and by considering species not used for training (with the exception of protein 1). A: Cytosolic levels of protein 1 versus time. Points denote the O7 = (3,2,2,1) data set in the presence of background ligand (L = 1). B: Cytosolic levels of protein 2 versus time. Points denote the O8 = (3,2,2,2) data set in the presence of background ligand (L =1). C: Cytosolic levels of protein 3 versus time. Points denote the O8 = (3,2,2,2) data set in the presence of background ligand (L = 1). D: Cytosolic levels of mRNA for protein 2 versus time. Points denote the O8 = (3,2,2,2) data set in the presence of background ligand (L = 1).
Fig. 6.
Distributions for the scaled cytosolic protein 1 concentration as a function of time following the addition of extracellular ligand L. Bars denote expression bins for protein 1 (expression levels were sub-divided into 10 bins). The solid line denotes a normal distribution fit to the histogram (histfit function of Octave). Initially, the ensemble was synchronized with low scaled protein 1 expression (upper left-hand plot). After the addition of the ligand L the distribution of cells expressing protein 1 shifted to the right (progressing through an approximately normal distribution during active expression of protein 1). After t = 1.0 hr the bulk of the cells reached their maximum cytosolic levels of protein 1 (lower right-hand corner).
A criticism of mass-action kinetics is that they increase the number of parameters and species in network models. Alternatively, Michaelis–Menten kinetics (which are a realization of the law of mass action) or Hill kinetics are often used to reduce model dimension. However, Michaelis–Menten kinetics rely on the assumption that product formation is rate limiting (kcat << koff). We explored the parameter ensemble for two key catalytic reactions in our network, namely, the activation of kinase by activated receptor and the phosphorylation of transcription factor by activated kinase to determine if the Michaelis–Menten assumption was valid. We considered parameter sets from the locally refined parameter ensemble with Pareto rank ≤ 3. For these reactions, the on and catalytic rate constants had a CV ~ 1 while the off-rates were not well-constrained (CV > 2). On average, the Michaelis-Menten assumption was violated by ~ 35% of the ensemble suggesting that we could possibly reduce model complexity by changing the kinetics. However, mass-action kinetics have the advantages of regularized mathematical structure and simplicity, that offsets the added complexity.
Rank-based assessment of nodes and edges was conserved by the ensemble
A key question when using model ensembles is whether the rank-based assessment of critical network components is correct, given significant parametric diversity. Previously, we approached this question by comparing the nodes or edges predicted to be important in a variety of models with literature [9, 17, 19, 33]. However, these comparisons were imperfect. Many factors were likely different between the experimental and modeling studies. Moreover, these comparisons were only as reliable as the underlying literature search, which was not exhaustive. In this study, we validated the classification of nodes and edges as fragile or robust by comparing the true model with models from the ensemble.
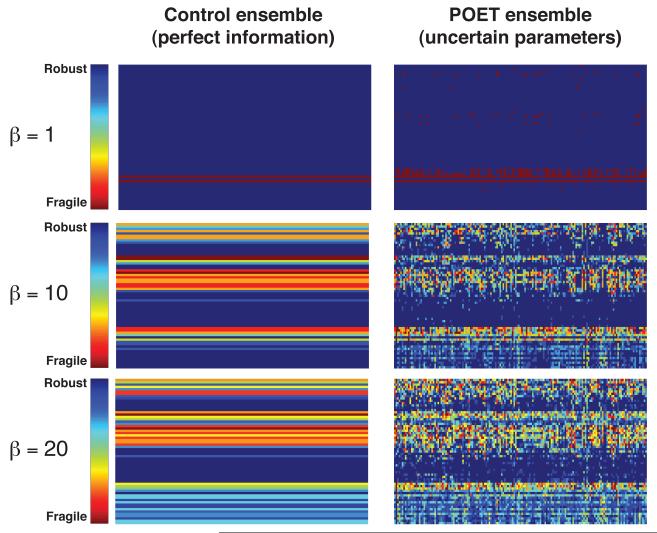
Local processes such as transcription factor regulation and global infrastructure like RNAP, nuclear transport and translation were the most fragile components of the prototypical-signaling network. First-order sensitivity coefficients were computed for the true parameters and the ensemble. These coefficients were then time-averaged to form the and arrays (materials and methods). The magnitude of the coefficients of the left (right) singular vectors corresponding to largest β singular values of were used to rank-order the importance of the nodes (edges) in the model (Fig. 7). The most sensitive node combinations with β =1 involved the regulation of activated transcription factor (aTF) and the transport of aTF into the nucleus (Fig. 7, top). Similarly, the most sensitive edges involved PH-TF regulation of aTF, the production, degradation and regulation of the specific kinase for TF (iK/aK), the production and degradation of iTF and the production/degradation of PH-TF. Analysis of additional singular vectors (increased β) highlighted the role of global infrastructure like RNAP, nuclear transport (IMPORT/EXPORT) and translation (Fig. 7, middle and bottom). Analysis of the left singular vectors of the matrix also supported these findings. On the other hand, the most robust species and reaction combinations involved the assembly of the adaptor complex and the basal expression of Gene 1, 2 and 3. Subpopulations in the ensemble behaved differently. Analysis of the right singular vectors of suggested which ensemble elements most influenced a particular species. For example, examination of the top and bottom three ranked ensemble members, estimated from the right singular vectors of , showed the highest ranked ensemble members had similar aTF trajectories (Fig. S5, solid-lines). Conversely, the lowest three had widely varying aTF levels (Fig. S5, dashed-lines). Thus, subpopulations with qualitatively distinct behavior were present in the ensemble and decomposing the array could identify these elements.
Fig. 7.
Comparison of the species (node) fragility estimated from the ensemble versus the true parameter set for different β values (δ = 0.1). The fraction of the top-β modes in which a species was present was calculated for the true model (left) and the model ensemble (right).
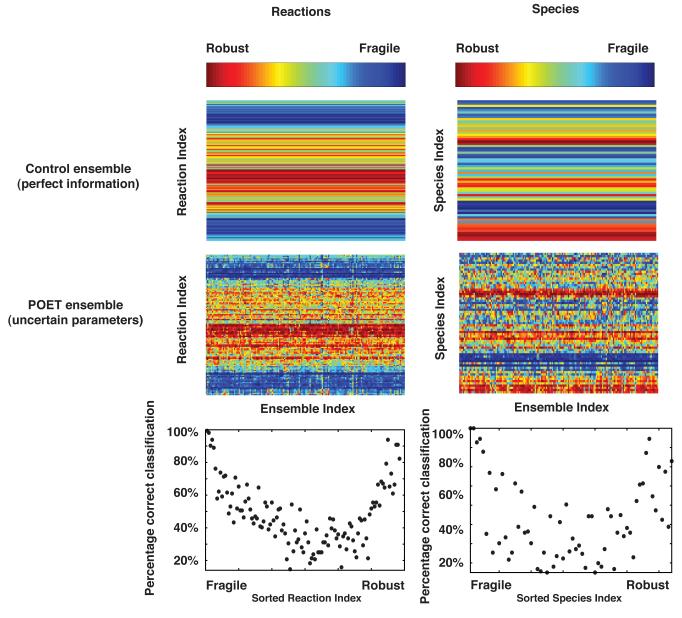
Edge and node ranks computed over the ensemble recovered the true rankings for highly fragile and highly robust network components (Fig. 8). We compared the node (species) and edge (interaction) ranks computed using sensitivity analysis for the true parameter set with the ensemble (β =1). The Kendall and Spearman rank correlations were used to quantify the agreement between the true and estimated ranked lists (Table 1). The Spearman and Kendall correlation coefficients were approximately normally distributed for both node and edge fragility over the model ensemble (data not shown). Ranks estimated using unscaled sensitivity coefficients gave the best correlation with the true parameter values. The Kendall correlation between the true node rank and that estimated from the ensemble was 0.57 ± 0.15 while the mean edge rank correlation was 0.72 ± 0.09. The mean Spearman rank correlation for node rank was 0.73 ± 0.16, while the mean correlation for edge rank was 0.87 ± 0.08. Additionally, if we computed the correlation between the true rank and the mean node/edge rank (mean rank calculated over the ensemble before the rank correlation test) the Spearman correlation for nodes and edges increased to 0.91 and 0.97, respectively. Both correlation metrics and visual inspection (Fig. 8, control versus POET) suggested that edge rank was recovered better than node rank. In addition to the rank correlation, we calculated the fraction of the ensemble in which an edge or node was ranked the same as the true parameter set (Fig. 8, bottom). Interestingly, both highly fragile and highly robust network features were recovered for edges (Fig. 8, bottom left) and nodes (Fig. 8, bottom right). For example, the highest and lowest ranked edges were recovered in more than 95% of the ensemble. However, minor network features were not similarly recovered (worst case recovery of only 20%). This suggested that we could expect to recover at least highly fragile or robust network features when using parametrically uncertain ensembles.
Fig. 8.
Comparison of the reaction (edge) and species (node) rank estimated from the ensemble versus the true parameter set for β =1. The ordinal-rank of the magnitude of the left (right) singular vector corresponding to the largest singular value was computed for true model (top) and the model ensemble (middle). The fraction of trials a species or reaction was ranked exactly correctly was used to calculate the correct classification percentage.
Table 1.
Summary of the rank-correlation for node and edge ranking between the ensemble and true parameter set
| Scaled | ||
| Method | Node | Edge |
| Kendall | 0.51 ± 0.18 | 0.36 ± 0.11 |
| Spearman | 0.65 ± 0.22 | 0.51 ± 0.15 |
| Unscaled | ||
| Kendall | 0.57 ± 0.15 | 0.72 ± 0.09 |
| Spearman | 0.73 ± 0.16 | 0.87 ± 0.08 |
Discussion
Mathematical modeling of complex gene expression programs is an emerging tool for understanding disease mechanisms. However, identification of large models with many unknown parameters requires that we use diverse training data. Training data taken from many sources can contain conflicts, for example different time-scales, or can sometimes even be contradictory. Parameter estimation techniques that balance these conflicts might lead to robust model performance. POET has previously been used to identify molecular models of pain signaling [9]. We modified the original algorithm by incorporating a local parameter refinement step which generated candidate parameter sets with better error properties. Using the modified POET algorithm, we identified an ensemble of parameter sets from synthetic data generated using the true parameters. We assumed immunoblot training data (Western or Northern blots) was available to estimate the model ensemble. We introduced a systematic procedure to incorporate these types of experimental measurements into model identification. We characterized the parameter ensemble generated by POET by exploring the behavioral diversity of models in the ensemble and by examining how the fragility of nodes or edges varied over the ensemble.
The deterministic ensemble exhibited heterogeneous population-like behavior. In this study, we suggested that deterministic ensembles could be used to model heterogeneous populations in situations where stochastic computation was not feasible. There is a rich and growing literature exploring the role of stochastic fluctuations in biological processes such as gene expression [34]. Today, stochastic gene expression models are not computationally feasible except for small networks. However, as stochastic simulation algorithms continue to improve, for example with hybrid [35] or leaping strategies [36], then fully stochastic simulations will become tractable. Currently, the simulation of moderate to large problems typically relies on the population-averaged descriptions provided by ODEs. Within an ODE framework, we showed population-like effects using model ensembles. Population heterogeneity using deterministic model families was also recently explored for bacterial growth in batch cultures [37]. Distributions were generated because the model parameters varied over the ensemble, i.e., extrinsic noise led to population heterogeneity. Parameters controlling physical interactions such as disassociation rates or the rate of assembly or degradation of macromolecular machinery such as ribosomes were widely distributed over the ensemble. However, population heterogeneity can also arise from intrinsic noise [38]. Thus, deterministic ensembles, which do not capture intrinsic thermal fluctuations, provide a coarse-grained or extrinsic-only ability to simulate population diversity. Taken together, these studies motivate a deeper question as to whether a unique parameter set exists in biology. These results suggest that not just variation in the copy number of infrastructure like ribosomes or RNAP but rather distributions in the strength of biophysical interactions could also drive population heterogeneity. More studies are required to explore these questions and to test the notion that ensembles can model population heterogeneity. One concrete next step could be to try and recapitulate experimentally measured distributions, for example, flow cytometry measurements of protein markers. Longer term, coarse-grained deterministic ensembles might be a strategy to explore drug effects across cell populations [1].
Sensitivity-based metrics, calculated from uncertain models, are often used to estimate which components of networks are fragile or robust. Thus, a reasonable question is whether the classification of nodes (species) and edges (interactions) as fragile or robust in uncertain models is correct. We explored this question by comparing nodes or edges estimated to be fragile or robust in the true model with those of the model ensemble. We showed that both locally and globally important network features were conserved across the ensemble. The most important local feature of our canonical network was transcription factor activation. Transcription factor regulation is a well-known integration layer in gene-expression architectures. For example, Bhardwaj et al. showed in a range of networks that midlevel regulators such as transcription factors have the highest collaborative propensity [39]. Thus, transcription factor regulation is perhaps one of the bow-ties described by Csete and Doyle [40]. Sensitivity analysis suggested that global infrastructure such as RNAP, nuclear transport and translation initiation were also fragile. The fragility of transcription and translation infrastructure has also been reported by Stelling et al. exploring the robustness properties of Drosophila clock architectures [16], in cell-cycle architectures [19], in growth factor signaling in LNCaP sub-clones [33] to cite just a few examples. Interestingly, highly fragile or robust network features were conserved across the ensemble. This suggested, as Bailey hypothesized, that analysis of experimentally constrained model ensembles could generate a reasonable estimate of what was important in a network without detailed parametric knowledge [6]. However, sensitivity analysis does not evaluate network performance following structural or operational perturbations [41]. Thus, an open question (yet to be explored) is whether an ensemble of models captures the fault tolerance or disturbance rejection properties of molecular networks.
Supplementary Material
Acknowledgements
The project described was supported by Award Number #U54CA143876 from the National Cancer Institute. The content is solely the responsibility of the authors and does not necessarily represent the official views of the National Cancer Institute or the National Institutes of Health. We also acknowledge the generous support of the Office of Naval Research #N000140610293 to J.V. for the support of S.S.
Footnotes
Conflict of Interest: The authors have declared no conflict of interest.
References
- 1.Kitano H. A robustness based approach to systems-oriented drug design. Nat Rev Drug Discov. 2007;6:202–210. doi: 10.1038/nrd2195. [DOI] [PubMed] [Google Scholar]
- 2.Hornberg JJ, Binder B, Bruggeman FJ, Schoeberl B, Heinrich R, et al. Control of mapk signalling: from complexity to what really matters. Oncogene. 2005;24:5533–42. doi: 10.1038/sj.onc.1208817. [DOI] [PubMed] [Google Scholar]
- 3.Gadkar KG, Varner J, Doyle FJ. Model identification of signal transduction networks from data using a state regulator problem. Syst Biol (Stevenage) 2005;2:17–30. doi: 10.1049/sb:20045029. [DOI] [PubMed] [Google Scholar]
- 4.Gennemark P, Wedelin D. Benchmarks for identification of ordinary differential equations from time series data. Bioinformatics. 2009;25:780–6. doi: 10.1093/bioinformatics/btp050. [DOI] [PMC free article] [PubMed] [Google Scholar]
- 5.Bandara S, Schlöder J, Eils R, Bock HG, Meyer T. Optimal Experimental Design for Parameter Estimation of a Cell Signaling Model. PLoS Comput Biol. 2009;5:e1000558. doi: 10.1371/journal.pcbi.1000558. [DOI] [PMC free article] [PubMed] [Google Scholar]
- 6.Bailey JE. Complex biology with no parameters. Nat Biotechnol. 2001;19:503–504. doi: 10.1038/89204. [DOI] [PubMed] [Google Scholar]
- 7.Covert M, Knight E, Reed J, Herrgard M, Palsson B. Integrating high-throughput and computational data elucidates bacterial networks. Nature. 2004;429:92–96. doi: 10.1038/nature02456. [DOI] [PubMed] [Google Scholar]
- 8.Shen-Orr SS, Milo R, Mangan S, Alon U. Network motifs in the transcriptional regulation network of Escherichia coli. Nature. 2002;31:64–68. doi: 10.1038/ng881. [DOI] [PubMed] [Google Scholar]
- 9.Song SO, Varner J. Modeling and analysis of the molecular basis of pain in sensory neurons. PLoS One. 2009;4:e6758. doi: 10.1371/journal.pone.0006758. [DOI] [PMC free article] [PubMed] [Google Scholar]
- 10.Battogtokh D, Asch DK, Case ME, Arnold J, Schuttler HB. An ensemble method for identifying regulatory circuits with special reference to the qa gene cluster of neurospora crassa. Proc Natl Acad Sci U S A. 2002;99:16904–16909. doi: 10.1073/pnas.262658899. [DOI] [PMC free article] [PubMed] [Google Scholar]
- 11.Kuepfer L, Peter M, Sauer U, Stelling J. Ensemble modeling for analysis of cell signaling dynamics. Nat Biotech. 2007;25:1001–1006. doi: 10.1038/nbt1330. [DOI] [PubMed] [Google Scholar]
- 12.Brown KS, Sethna JP. Statistical mechanical approaches to models with many poorly known parameters. Phys Rev E Stat Nonlin Soft Matter Phys. 2003;68:021904. doi: 10.1103/PhysRevE.68.021904. [DOI] [PubMed] [Google Scholar]
- 13.Palmer T, Shutts G, Hagedorn R, Doblas-Reyes F, Jung Y, et al. Representing model uncertainty in weather and climate prediction. Ann Rev Earth and Planetary Sci. 2005;33:163–193. [Google Scholar]
- 14.Gutenkunst RN, Waterfall JJ, Casey FP, Brown KS, Myers CR, et al. Universally sloppy parameter sensitivities in systems biology models. PLoS Comput Biol. 2007;3:1871–78. doi: 10.1371/journal.pcbi.0030189. [DOI] [PMC free article] [PubMed] [Google Scholar]
- 15.Moles CG, Mendes P, Banga JR. Parameter estimation in biochemical pathways: a comparison of global optimization methods. Genome Res. 2003;13:2467–2474. doi: 10.1101/gr.1262503. [DOI] [PMC free article] [PubMed] [Google Scholar]
- 16.Stelling J, Gilles ED, Doyle FJ. Robustness properties of circadian clock architectures. Proc Natl Acad Sci U S A. 2004;101:13210–13215. doi: 10.1073/pnas.0401463101. [DOI] [PMC free article] [PubMed] [Google Scholar]
- 17.Luan D, Zai M, Varner JD. Computationally derived points of fragility of a human cascade are consistent with current therapeutic strategies. PLoS Comput Biol. 2007;3:e142. doi: 10.1371/journal.pcbi.0030142. [DOI] [PMC free article] [PubMed] [Google Scholar]
- 18.Chen WW, Schoeberl B, Jasper PJ, Niepel M, Nielsen UB, et al. Input-output behavior of erbb signaling pathways as revealed by a mass action model trained against dynamic data. Mol Syst Biol. 2009;5:239. doi: 10.1038/msb.2008.74. [DOI] [PMC free article] [PubMed] [Google Scholar]
- 19.Nayak S, Salim S, Luan D, Zai M, Varner JD. A test of highly optimized tolerance reveals fragile cell-cycle mechanisms are molecular targets in clinical cancer trials. PLoS One. 2008;3:e2016. doi: 10.1371/journal.pone.0002016. [DOI] [PMC free article] [PubMed] [Google Scholar]
- 20.Kholodenko BN, Kiyatkin A, Bruggeman FJ, Sontag E, Westerhoff HV, et al. Untangling the wires: a strategy to trace functional interactions in signaling and gene networks. Proc Natl Acad Sci USA. 2002;99:12841–12846. doi: 10.1073/pnas.192442699. [DOI] [PMC free article] [PubMed] [Google Scholar]
- 21.Kremling A, Fischer S, Gadkar KG, Doyle FJ, Sauter T, et al. A Benchmark for Methods in Reverse Engineering and Model Discrimination: Problem Formulation and Solutions. Genome Res. 2004;14:1773–1785. doi: 10.1101/gr.1226004. [DOI] [PMC free article] [PubMed] [Google Scholar]
- 22.Gutenkunst RN, Waterfall JJ, Casey FP, Brown KS, Myers CR, et al. Universally Sloppy Parameter Sensitivities in Systems Biology. PLoS Comput Biol. 2007;3:e198. doi: 10.1371/journal.pcbi.0030189. [DOI] [PMC free article] [PubMed] [Google Scholar]
- 23.Casey FP, Baird D, Feng Q, Gutenkunst RN, Waterfall JJ, et al. Optimal experimental design in an EGFR signaling and down-regulation model. IET Syst Biol. 2007;1:190–202. doi: 10.1049/iet-syb:20060065. [DOI] [PubMed] [Google Scholar]
- 24.Dickinson RP, Gelinas RJ. Sensitivity analysis of ordinary differential equation systems -a direct method. J Comp Phys. 1976;21:123–143. [Google Scholar]
- 25.Fonseca C, Fleming PJ. Genetic Algorithms for Multiobjective Optimization: Formulation, Discussion and Generalization; Proceedings of the 5th International Conference on Genetic Algorithms; 1993.pp. 416–423. [Google Scholar]
- 26.Gadkar KG, Doyle FJ, 3rd, Crowley TJ, Varner JD. Cybernetic model predictive control of a continuous bioreactor with cell recycle. Biotechnol Prog. 2003;19:1487–97. doi: 10.1021/bp025776d. [DOI] [PubMed] [Google Scholar]
- 27.Varner JD. Large-scale prediction of phenotype: concept. Biotechnol Bioeng. 2000;69:664–78. doi: 10.1002/1097-0290(20000920)69:6<664::aid-bit11>3.0.co;2-h. [DOI] [PubMed] [Google Scholar]
- 28.Fussenegger M, Bailey J, Varner J. A mathematical model of caspase function in apoptosis. Nat Biotechnol. 2000;18:768–774. doi: 10.1038/77589. [DOI] [PubMed] [Google Scholar]
- 29.Schoeberl B, Eichler-Jonsson C, Gilles ED, M̈uller G. Computational modeling of the dynamics of the map kinase cascade activated by surface and internalized egf receptors. Nat Biotechnol. 2002;20:370–5. doi: 10.1038/nbt0402-370. [DOI] [PubMed] [Google Scholar]
- 30.Li H, Ung CY, Ma XH, Liu XH, Li BW, et al. Pathway sensitivity analysis for detecting pro-proliferation activities of oncogenes and tumor suppressors of epidermal growth factor receptor-extracellular signal-regulated protein kinase pathway at altered protein levels. Cancer. 2009;115:4246–4263. doi: 10.1002/cncr.24485. [DOI] [PubMed] [Google Scholar]
- 31.Stites EC, Trampont PC, Ma Z, Ravichandran KS. Network analysis of oncogenic ras activation in cancer. Science. 2007;318:463–467. doi: 10.1126/science.1144642. [DOI] [PubMed] [Google Scholar]
- 32.Helmy M, Gohda J, Inoue JI, Tomita M, Tsuchiya M, et al. Predicting novel features of toll-like receptor 3 signaling in macrophages. PLoS One. 2009;4:e4661. doi: 10.1371/journal.pone.0004661. [DOI] [PMC free article] [PubMed] [Google Scholar]
- 33.Tasseff R, Nayak S, Salim S, Kaushik P, Rizvi N, et al. Analysis of the molecular networks in androgen dependent and independent prostate cancer revealed fragile and robust subsystems. PLoS One. 2010;5:e8864. doi: 10.1371/journal.pone.0008864. [DOI] [PMC free article] [PubMed] [Google Scholar]
- 34.Elowitz MB, Levine AJ, Siggia ED, Swain PS. Stochastic gene expression in a single cell. Science. 2002;297:1183–6. doi: 10.1126/science.1070919. [DOI] [PubMed] [Google Scholar]
- 35.Iyengar KA, Harris LA, Clancy P. Accurate implementation of leaping in space: the spatial partitioned-leaping algorithm. J Chem Phys. 2010;132:094101. doi: 10.1063/1.3310808. [DOI] [PubMed] [Google Scholar]
- 36.Cao Y, Petzold LR, Rathinam M, Gillespie DT. The numerical stability of leaping methods for stochastic simulation of chemically reacting systems. J Chem Phys. 2004;121:12169–78. doi: 10.1063/1.1823412. [DOI] [PubMed] [Google Scholar]
- 37.Lee MW, Vassiliadis VS, Park JM. Individual-based and stochastic modeling of cell population dynamics considering substrate dependency. Biotechnol Bioeng. 2009;103:891–9. doi: 10.1002/bit.22327. [DOI] [PubMed] [Google Scholar]
- 38.Swain PS, Elowitz MB, Siggia ED. Intrinsic and extrinsic contributions to stochasticity in gene expression. Proc Natl Acad Sci U S A. 2002;99:12795–800. doi: 10.1073/pnas.162041399. [DOI] [PMC free article] [PubMed] [Google Scholar]
- 39.Bhardwaj N, Yan KK, Gerstein MB. Analysis of diverse regulatory networks in a hierarchical context shows consistent tendencies for collaboration in the middle levels. Proc Natl Acad Sci U S A. 2010;107:6841–6. doi: 10.1073/pnas.0910867107. [DOI] [PMC free article] [PubMed] [Google Scholar]
- 40.Csete M, Doyle J. Bow ties, metabolism and disease. Trends Biotechnol. 2004;22:446–450. doi: 10.1016/j.tibtech.2004.07.007. [DOI] [PubMed] [Google Scholar]
- 41.Shoemaker JE, Doyle FJ. Identifying fragilities in biochemical networks: Robust performance analysis of fas signaling-induced apoptosis. Biophys J. 2008;95:2610–2623. doi: 10.1529/biophysj.107.123398. [DOI] [PMC free article] [PubMed] [Google Scholar]
Associated Data
This section collects any data citations, data availability statements, or supplementary materials included in this article.


