

Abstract
During needle-based procedures, transitions between tissue layers often lead to rupture events that involve large forces and tissue deformations and produce uncontrollable crack extensions. In this paper, the mechanics of these rupture events is described, and the effect of insertion velocity on needle force, tissue deformation, and needle work is analyzed. Using the J integral method from fracture mechanics, rupture events are modeled as sudden crack extensions that occur when the release rate J of strain energy concentrated at the tip of the crack exceeds the fracture toughness of the material. It is shown that increasing the velocity of needle insertion will reduce the force of the rupture event when it increases the energy release rate. A nonlinear viscoelastic Kelvin model is then used to predict the relationship between the deformation of tissue and the rupture force at different velocities. The model predicts that rupture deformation and work asymptotically approach minimum values as needle velocity increases. Consequently, most of the benefit of using a higher needle velocity can be achieved using a finite velocity that is inversely proportional to the relaxation time of the tissue. Experiments confirm the analytical predictions with multilayered porcine cardiac tissue.
Keywords: Cutting, fracture, highly deformable bodies, needle insertion, surgical robotics, tissue dynamics
I. Introduction
MEDICAL needle interventions are a common technique for accessing tissue structures that would be otherwise difficult or impossible to reach. In these procedures, needles are used, for example, to insert catheters, to place radioactive seeds at tumor sites, to extract biopsy samples, and to inject drugs.
Needle insertion into biological tissues often leads to sudden tissue rupture or uncontrollable crack extensions due to tissue inhomogeneity and changes in structure that affect the flow of energy into the tissue cracks [1]-[3]. A rupture event occurs when excessive tissue deformation is followed by the sudden propagation of a crack or cracks inside the tissue. During rupture, strain energy is suddenly released to the cracks (or micro cracks) inside the tissue causing them to extend.
Rupture events with excessive strain energy can produce dangerous penetration of sensitive tissue regions. For example, during fetal cardiac interventions, needle insertion into the left ventricle can cause collapse of the chamber such that the subsequent rupture penetrates the rear wall of the ventricle [4].
Rupture events can also increase the position error of robotic needle steering inside inhomogeneous tissues. In robotic needle steering [5]-[10], a robot is used to control the position and orientation of the base of a stiff symmetric needle, or a flexible bevel-tip needle to guide the tip of the needle to a desired target inside the tissue. Real-time image-based control is used to guide the needle tip along a trajectory that avoids obstacles and converges to the desired target [11]. The inhomogeneity of the tissue produces rupture events along the trajectory. Thus, the large transient deformations and uncontrollable crack extensions associated with rupture are likely to increase position error during needle steering in inhomogeneous tissues.
It is commonly known that faster motions of a sharp tool or needle cause less tissue deformation during cutting or penetration of a biological material. This effect should be partly due to the viscoelastic properties of the material. For example, it was demonstrated in [12] that ultrasonic surgical cutting instruments can cut tissue without any significant tissue deformation partly due to the high-frequency periodic velocity of the instrument tip. It is likely that both robotic and manual needle insertions can also benefit through control of velocity to produce less deformation, uncontrolled crack extension, and tissue damage.
In this paper, we analyze rupture events that can occur during needle insertion inside multilayered biological materials. We develop a qualitative fracture model that relates rupture force to contact area and to the material properties of tissues. The fracture model explains why the rupture force decreases with increasing insertion velocity for some tissue structures. We then develop a contact model to predict the effect of needle velocity on the deformation, and work of rupture. Our contact model predicts that rupture deformation and work asymptotically approach minimum values as needle velocity increases. Then, we define a saturation velocity that provides most of the benefit of using a higher needle velocity. Needle insertion experiments performed on pig heart support analytical observations.
This paper is arranged as follows. Related work on modeling and simulating needle insertion is described in the Section II. Section III presents the qualitative fracture model and analytical contact model and derives predictions of force and deformation work at the moment of rupture. It also includes derivation of a saturation velocity for achieving most of the benefit of high insertion velocity. Needle insertion experiments are presented and related to the observation in Section IV. Conclusions appear in Section V.
II. Related Work
The modeling of needle insertion has been studied for developing surgical training simulators, surgical planning simulators, and for robotic needle steering [6], [13], [14]. Finite-element models [6], [14], [15], empirical models [16], and fracture-mechanics analytical models [4] have been used to predict needle force and its relation to either global deformation, the body geometry, boundary conditions surrounding the body, or insertion velocity.
Finite elements have been used to build contact models for needle insertion. The focus of this work has been to predict tissue and needle deformation for the purpose of needle steering. For example, DiMaio et al. [6] used a 2-D finite-element model to relate needle forces to the global deformation of a body. Alterovitz et al. [14] applied the finite-element method to obtain a dynamic contact model for needle insertion. They showed by simulation that faster needle insertion reduces the position error for reaching a target inside tissue. Nienhuys et al. [17] used a 3-D finite-element method to simulate needle insertion. In all of these papers, rupture at the needle tip was not modeled. Instead, it was assumed that rupture forces were given. In contrast, Misra et al. [15] used 2-D finite elements with a cohesive zone model for tissue fracture.
As an alternative to finite elements, some researchers have developed empirical models for reproducing the force versus displacement characteristics of needle insertion. For example, Okamura et al. [16] developed a measurement-based model for quasistatic insertion of a needle into soft tissue. They modeled needle force as a combination of deformation force, cutting force, and friction force.
The effect of velocity on needle insertion in biological materials has been empirically studied in [18], [19]. Brett et al. [18] measured needle cutting force in porcine samples and cadavers to build a surgical simulator for needle-based epidural procedures. They found that the overall force profile does not change with insertion velocity, while the peak force decreases for faster insertions. Their force profiles include the events enumerated earlier, and their peak force is comparable to the rupture force described here. Hing et al. [19] measured needle insertion force in liver samples and observed that the average puncture force decreases with increasing insertion velocity.
Models motivated by fracture mechanics have been proposed in several papers. For example, prior work by Heverly and Dupont employed an energy approach from fracture mechanics to describe the effect of velocity on needle insertion [4]. In contrast with the approach proposed in this paper, needle insertion was modeled as a cutting event whose force depends on the fracture toughness of the tissue. The observed decrease in rupture force with increasing velocity was modeled by assuming a negatively velocity-dependent fracture toughness in the outer tissue layer. As a second example, Azar and Hayward [20] developed a fracture mechanics model to predict the penetration force during quasi-static needle insertion into soft tissue. As in this paper, the needle insertion process was modeled as a sequence of four events: deformation, rupture, cutting, and relaxation. The effect of insertion velocity was not studied in their work.
Of the papers cited previously, only those employing fracture mechanics models specifically attempt to produce predictive models of rupture and only [4] attempts to include the effect of velocity. In contrast to [4], the model proposed here does not need to assume a large negative dependence of fracture toughness on velocity. Instead, it is shown that increasing the velocity of needle insertion increases the energy release rate to the extended cracks, and therefore, reduces the force of the rupture event. The analytical assumptions used in this paper are partly based on Atkins and Mai’s work on fracture mechanics of highly deformable bodies [2, Sec. 2.10].
III. Dynamic Modeling of Needle Insertion
To explain the proposed models, it is necessary to define the sequence of events associated with needle insertion and rupture. These are first described using the force–displacement response associated with needle insertion in a porcine heart. Fracture and contact models are then developed to predict the relationship between force, deformation, and velocity of a rupture event. These relationships are then used to derive the saturation velocity for a rupture event.
A. Force–Displacement Characteristics
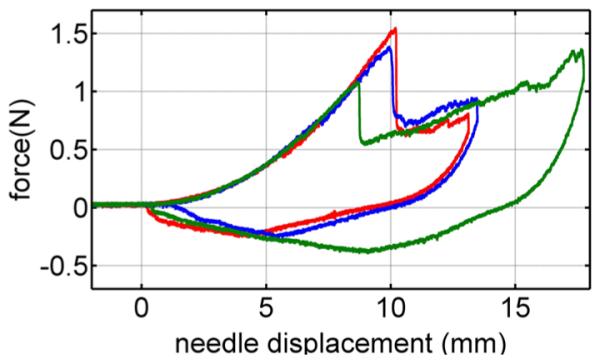
Fig. 1 displays typical force–displacement responses during the insertion and removal of a rigid trocar (three-sided tip) into a pig heart. Details of these tests are presented in Section IV. The process of each needle insertion can be divided into several events [1], which are as follows.
Loading deformation (from 0 to 1): This is a deformation event that starts at 0 mm and continues until a deformation (i.e., a deformation depth at the tip of the needle) at which the needle force reaches its maximum.
Rupture (from 1 to 2): This is a rupture event when a crack suddenly propagates into the tissue right after the force reaches its maximum.
Cutting (from 2 to 3): This is a cutting event that starts after rupture such that the crack propagates in the body in a controlled fashion in response to needle displacement.
Unloading deformation (from 3 to 4): This is a second deformation event that starts when the needle is stopped and continues as the needle is removed.
Fig. 1.
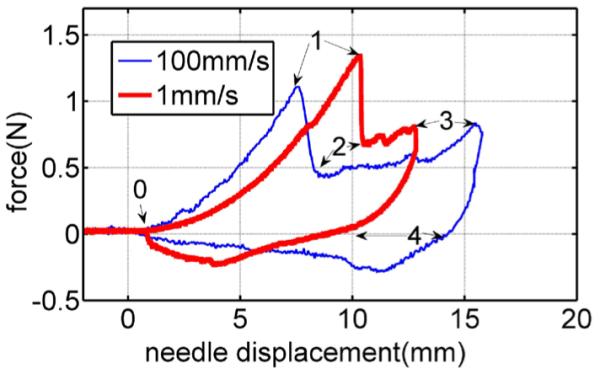
Force versus displacement curves for needle insertion into and removal from a pig heart at two velocities: 1 and 100 mm/s.
Needle force also includes friction force during events 1–2, 2–3, 3–4, and 4–0, when the needle is inside the tissue. Friction force can be separately modeled as a function of crack length [16] and insertion velocity [4]. For clarity of presentation, friction is not considered in the analyses that follow. It is straight-forward, however, to extend our analyses to include a desired friction model.
Comparison of the force–deformation curves for the two velocities during loading deformation (0–1) suggests two hypotheses—that both the deformation and the force at rupture decrease with increasing velocity. In the combined model proposed next, the qualitative fracture model explains this rupture force–velocity relationship, while the contact model reproduces the observed force–displacement relationship.
B. Fracture Model
Our fracture model is derived from the J integral method of fracture mechanics [21] that is used to predict crack extension inside a stiff material under uniform loading [2], [21], [22]. The method calculates the energy release of crack extension by integrating the change of the energy field during extension. If this J integral exceeds the energy required to break the bonds of the material around the crack, then the method predicts that the crack will be extended [21].
Cracks are regional energy intensifiers with energy-intensification factors that depend on their tip sharpness, i.e., tip curvature [21]. The sharpness of cracks will remain unchanged for stiff materials during deformation, but it will vary for highly deformable bodies. For the latter, crack sharpness, and thus, energy-intensification factor decrease with internal deformation [23]. To extend the J integral method to biological materials, we define crack energy-intensification factor as a function of deformation. Then, we relate the J integral of the crack extended during the needle insertion to the intensification factor of the crack and the contact pressure caused by the needle. We conclude that reducing the deformation of the body prior to the crack extension for a certain needle force increases the crack energy factor and the energy release rate for the crack, and consequently, reduces the force of rupture.
Fig. 2 shows two sequential time steps, t and t + dt, of a needle insertion process inside a nonlinear elastic body. During dt, the needle moves from x to x + dx under application of a force fn and the crack with initial area A extends, and therefore, increases in area by a differential amount dA inside the body. Crack A extends either when its sharp tip moves or when sharp microcracks in the neighborhood of its tip extend.
Fig. 2.

Two time steps of a needle insertion. Microcracks are shown distributed throughout the tissue. In this idealization, a single microcrack close to the needle tip and of initial area A extends to produce an increase in area of dA.
Following the J integral method of [22] to calculate needle force fn that causes crack extension, we first compute the energy term ∏ as the difference of the strain energy of the body U and the external work applied by the needle We [21] as
| (1) |
The nonlinear energy release rate J for the needle insertion is then defined as [21], [22]
| (2) |
where J represents the stored energy that the needle system can release per unit area of crack extension. This energy rate depends on needle force, needle sharpness, deformation properties of the body, and the size and configuration of crack A (or microcracks in the neighborhood of the tip of crack A).
In contrast, fracture toughness is defined as the energy required per unit area to extend a crack inside a body [23]. This is the energy expended to separate the bonds between the surfaces of the crack. Fracture toughness is a material property that is commonly denoted by R or Jc for nonlinear materials and by G for linear elastic materials. Here, we will use R to denote fracture toughness. The J integral method predicts that crack extension will occur when the energy released through extension equals or exceeds the energy necessary to extend the crack. This inequality can be written as
| (3) |
In order to apply (3) to needle insertion, we consider two special cases. In the first, dx = 0, while in the second, dU = 0. Recalling the four events of needle insertion described previously, these cases can be seen to correspond to the events of rupture and cutting. During idealized rupture, the needle is stationary, i.e., dx = 0, and the crack extends entirely by relaxation of the tissue around it. Also, the needle remains in contact with the tissue, and therefore, needle force is nonzero. During idealized cutting, crack tip extension exactly follows needle displacement and the deformation energy of the body is constant, dU = 0. Each of these cases is described next.
1) Crack Extension During Rupture, dx = 0
In this case, the external work by the needle during crack extension is zero, dWe = 0, and the energy rate J is
| (4) |
The strain energy U is calculated by
| (5) |
where σi,j and εi,j are the components of stress and strain of the body, and V represents the volume of the body. The energy release rate is then obtained by
| (6) |
It is difficult to calculate (6) exactly for needle insertion due to the change of crack curvature during tissue deformation, the proximity of the needle tip to the tip of the crack, and because the fracture is multiaxial. An approximate analysis can be applied here, however, to evaluate J.
As an approximation, it is assumed that the pressure over the contact area Ac between the needle and tissue is constant (see Fig. 2)
| (7) |
where p is the contact pressure, Ac is the size of the contact area, and fn is the needle force. With this assumption, stress in the body will be proportional to the contact pressure. Strain is related to stress by the constitutive equation of the material. Due to the sharp tip of the crack A or the existence of microcracks, the stress at the tip of crack A is intensified by a factor that depends on the structure of crack A and the microcracks [2].
Defining the crack energy-intensification factor as Kc, the energy release rate J can be related to contact pressure by
| (8) |
where m depends on the nonlinearity of the material. The energy release rate J also depends on the location and orientation of the crack with respect to needle tip location, but this does not need to be considered here. Combining (7) and (8) yields
| (9) |
By (3), the crack will extend if J = R. Substituting this value into (9) and rearranging yields the needle force necessary to initiate rupture as
| (10) |
2) Crack Extension During Cutting, dU = 0
Now, we consider a second form of crack extension in which the deformation energy of the body does not change during extension and crack tip location exactly follows needle tip displacement. We idealize the shape of the crack extension dA as rectangular prior to deformation with wc as the width of the crack (see Fig. 2)
| (11) |
For this form of crack extension, the energy release rate J for crack extension dA is given by
| (12) |
Substituting the crack extension condition of (3), J = R, yields the needle force for cutting as
| (13) |
The two forms of crack extension defined previously can be used to model the rupture and cutting events that occur during needle insertion. During a rupture event, a crack can extend unstably such that the energy release rate exceeds the fracture toughness, J > R. At the beginning and end of the rupture event (points 1 and 2 in Fig. 1), however, needle force is predicted by (10). During a cutting event, needle force always satisfies (13).
3) Drop in Needle Force During Rupture
Equation (10) can be used to explain the sudden decrease in needle force during rupture. The decrease is generally due to one or both of the following conditions.
A reduction in fracture toughness as the needle passes from one tissue layer with fracture toughness R1 to another layer with reduced fracture toughness R2.
An increase of energy release rate J, when the shape of a crack changes from blunt to sharp during its extension. This causes the energy-intensification factor of the crack to change from Kc1 to Kc2.
To relate these conditions to (10), consider the ratio of needle force at the beginning and end of rupture (points 1 and 2 in Fig. 1). Assuming that both conditions occur and using subscripts of 1 and 2 to indicate values at those points, the ratio is given by
| (14) |
in which Ac1 and Ac2 are contact areas between the needle and tissue.
A rupture event can also transition to a cutting event as in Fig. 1. In this situation, needle force at the end of the rupture (point 2) is calculated by (13). This force is the minimum needle force that can extend the crack. The cutting force is independent of crack geometry and insertion velocity.
4) Dependence of Rupture Force on Velocity
Rupture force fr is defined as needle force fn1 that extends the crack inside the first layer. For insertion velocity v, fr (v) is calculated from (10) as
| (15) |
where Kc1 (v) is the energy intensification of cracks of the first layer for insertions with velocity v. The energy-intensification factor will depend on velocity Kc1 (v) for those viscoelastic biological materials for which the internal crack structure depends significantly on the internal deformation of the body. This follows since the internal deformation of a body of viscoelastic materials depends on velocity [24]. For all viscoelastic biological materials, regardless of velocity dependence, the following inequalities summarize our results for two insertion velocities v1 and v2, and the same needle force
| (16) |
Contact area Ac also depends on needle velocity at the beginning of the deformation event [24]. However, prior to the rupture event, contact area generally reaches to a constant size. Therefore, we assume that Ac is independent of the velocity in (15).
Combining (15) and (16) indicates that the force needed to initiate the rupture event exhibits a negative dependence on needle velocity
| (17) |
By introducing a specific contact model, this nonincreasing trend in force can be related to a reduction in deformation, as is done in the following sections.
C. Contact Model
The classical model used to predict the deformation of a biological material under uniform tension is the Kelvin model (the standard linear solid model) [25]. We employ a modified Kelvin model here to calculate the force–deformation response of a sharp needle in contact with a biological organ. The modified Kelvin model (see Fig. 3) has the same architecture as the standard Kelvin model, but its components are functions of deformation depth δ and are specific to a particular needle shape. We use deformation-dependent parameters for the modified Kelvin model to include:
the effect of contact area size, that generally increases with the deformation, on needle force [24]
nonlinear constitutive behavior of the material during large displacements prior to fracture [2].
Fig. 3.
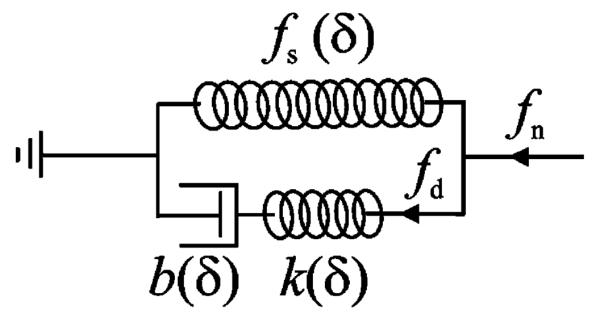
Modified Kelvin model to represent needle interaction with a viscoelastic body.
A nonlinear force–deformation function fs (δ) defines the force response of the spring of the modified Kelvin model that calculates the static component of the needle force (see Fig. 3). The series connection of a nonlinear spring k(δ) and a nonlinear damper b(δ) calculates the dynamic component of the needle force. Here, we assume that k(δ) and b(δ) depend on the same function of δ with different ratios. Thus, the relaxation time of the model, τs, becomes independent of δ
| (18) |
From the modified Kelvin model (see Fig. 3), the contact force is given by
| (19) |
where fn is the needle force, and fd (δ, t) is the force of the dynamic part of the model defined as a function of time t and deformation δ.
The dynamic force fd is calculated using
| (20) |
| (21) |
| (22) |
where δk is the displacement of the spring and δb is the displacement of the damper.
Combining (20), (21), and (18) yields spring deformation
| (23) |
Taking the time derivative of (22) and combining the result with (23) yields
| (24) |
This linear differential equation for spring displacement can be contrasted with the linear differential equation for spring force produced by the standard Kelvin model.
The general solution for (24) is obtained by a convolution integral as
| (25) |
The dynamic force fd is then obtained as
| (26) |
For a constant needle velocity v, (26) yields
| (27) |
Substituting (27) into (19) gives the force–deformation response of the model for insertion velocity v and relaxation constant τs as
| (28) |
It can be shown for force–deformation response (28) that increasing the insertion velocity always increases the needle force for a given deformation. (This can be done by plotting v (1 − exp(−δ/ψτs)) versus v.)
The relationship between rupture deformation δr and insertion velocity can now be obtained by substituting rupture force fr (v) into (28) as
| (29) |
Assuming that fs (δr) and k(δr) are increasing functions, and that fr (v) is a nondecreasing function, (29) indicates that rupture deformation is a decreasing function of insertion velocity.
Needle work prior to rupture can be obtained from the integral of (28) as
| (30) |
It can also be shown that increasing needle velocity v decreases needle work prior to rupture. While some of this work corresponds to recoverable elastic deformation of the tissue, the remainder is absorbed by the tissue both prior to rupture and during rupture. The energy absorbed prior to rupture can cause tissue damage, while that absorbed during rupture goes to crack extension. During needle insertion, rupture generates uncontrolled crack extension that can reach to sensitive tissues. Also, since an uncontrolled crack does not necessarily follow the intended trajectory of the needle for the entire length of its extension, it can generate position error during either manual or robotically controlled needle steering.
D. Saturation Velocity
At high velocity, v ⪢ δ/τs, the dynamic part of needle force (27) can be approximated using a Taylor series as
| (31) |
For v → ∞, the dynamic part of the force–deformation response converges to
| (32) |
and thus the total needle force versus deformation converges to a finite stiffness at infinite velocity as
| (33) |
For any given displacement δ, of interest, it is possible to compute the velocity vp for which the dynamic force is p% of its maximum value. Here and for the experiments mentioned shortly, we select p = 90%, vs = v90 as
| (34) |
Saturation velocity for rupture is then defined as
| (35) |
where δr is rupture deformation for insertion velocity vs and can be approximated by the rupture deformation of any velocity higher than vs.
As an example, if the relaxation time of a tissue is 1 s and a rupture deformation of interest is 10 mm, then the saturation velocity is 50 mm/s. We can conclude that if insertion velocity vs is used instead of an infinite velocity for the needle insertion, the force–deformation curve, tissue deformation, crack energy factor kc, rupture force, and rupture deformation will not change significantly. Therefore, saturation velocity can be used as a practical target value for minimizing tissue deformation.
IV. Experimental Results
A series of needle insertion experiments were performed on pig tissue to:
statistically validate dependency of rupture force on velocity as predicted by (17)
validate contact model (28)
validate dependency of rupture deformation and work on velocity as predicted by (29) and (30)
evaluate saturation velocity (35).
A. Materials and Methods
A linear actuator instrumented with a Sensotec model 31, 22 N tension/compression load cell was used to perform all needle insertions (see Fig. 4). The needle was controlled such that its velocity remained constant from the time the needle made contact with the tissue until the time of rupture. To accomplish this, the linear actuator was commanded through a trapezoidal velocity profile with maximum commanded acceleration of 10 m/s2. Needle motion was initiated more than 1 cm from the tissue surface to ensure that it had reached its commanded velocity at tissue contact.
Fig. 4.

Needle insertion experiment.
Fig. 5 demonstrates this performance for a commanded velocity of 200 mm/s. As shown, needle velocity is very close to this value (between 197.3 and 209.4 mm/s) and acceleration is close to zero (between −2.0 and 1.5 m/s2) from t = 0.1 s when contact is made through t = 0.13 s when rupture occurs. Further insertion tests showed that the needle more accurately tracks commanded velocity for insertion velocities less than 200 mm/s.
Fig. 5.
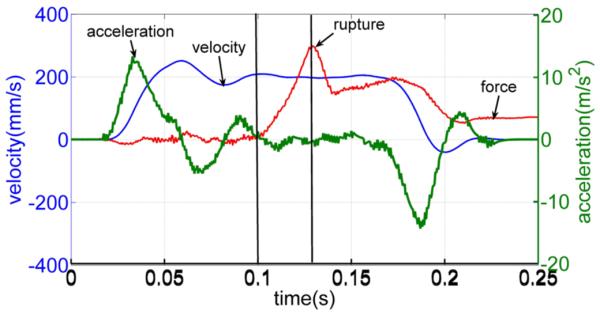
Velocity, acceleration, and force responses of a needle during an insertion with commanded velocity of 200 mm/s. Note that the force scale is not shown.
Even though acceleration was small during the tests, inertial forces experienced by the load cell were compensated for in order to obtain more accurate values of needle force. The inertial force was estimated by fa = ma, where a is the acceleration of the needle, and m is the total mass of the needle and its attachment. The acceleration of the needle was calculated from the position of the needle. The compensated contact force was obtained by subtracting estimated inertia force from load cell force. After compensation, the maximum noncontact disturbance force due to inertia is 0.07 N, which is negligible for this study. Inertia compensation was performed for all reported forces in this paper.
In addition to inertial compensation, low-pass moving-average filters were employed to remove high-frequency noise in the force measurements. Care was taken in designing the filters to ensure that force and deformation values during rupture (points 1 and 2 in Fig. 1) were not corrupted significantly. For example, considering peak force at the moment of rupture, assume that the actual amplitude of the rupture force is 1 and the slope of the force–time response is α at the moment of rupture. The filtered force value at this moment, assuming α is constant within k samples, is given by
| (36) |
where T is sampling period. The filtered rupture force is equal to the actual force at kT/2 s before the time of rupture. For all insertion tests of this study, we use the sampling rate of 2 kHz and an average filter with k = 10. For these values, filtered rupture force is equal to the actual needle force at 2.5 ms before its peak. For this short period of time, the force difference is small (up to 0.05 N) for all measured data and can be ignored.
Needle insertion tests were performed on two pig hearts and two pig livers. Fresh pig tissues were obtained from a grocery store, refrigerated for less than 1 h, and the tests were performed over a period of less than 2 h for each tissue sample and needle. Two types of needles were used: 1) a 19-gauge trocar needle (three-sided tip) and 2) an 18-gauge bevel-tip needle. Both needles can be considered rigid. For each needle and tissue type, the insertions were performed only in one organ within a rectangular surface area of almost 2 cm × 3 cm. The distance between insertion holes ranged from 1.5 to 2.5 mm. A force threshold was used to determine the displacement at which initial needle–tissue contact was made. The threshold values employed were 0.05 N for the bevel needle and 0.1 N for the trocar needle.
Insertion tests were performed ten times at velocities of 1, 5, 10, 50, 100, 150, 200, and 250 mm/s with each needle and tissue sample. For each test, the location of the needle on the pig tissue was first selected and then the desired insertion velocity was chosen using a random number generator to avoid operator bias.
B. Results and Validations
1) General Characteristics of Force–Displacements
Fig. 6 displays the force–displacement trajectory of an insertion into a liver with a bevel needle for a needle velocity of 1 mm/s. The trajectory contains five rupture events. In general, needle insertion into a liver includes two to five rupture events, and the displacement and force of the rupture events significantly vary among the trails for the same needle and velocity. This makes it difficult to analyze the characteristics of rupture events in liver without knowing the exact location of the inhomogeneities inside the liver.
Fig. 6.
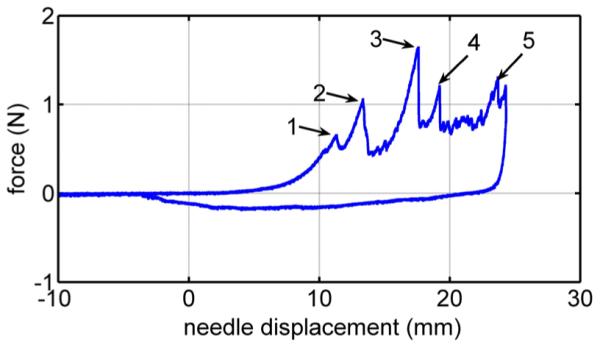
Force versus deformation for needle insertion into a pig liver. The numbers 1–5 label rupture events.
Fig. 7 presents three overlaid force–displacement trajectories for trocar needle insertion into a heart with a needle velocity of 1 mm/s. Each trajectory includes only one rupture event. The needle force prior to the rupture does not vary among trials, but there is variation in rupture force. These observations hold for all trials made with the trocar and bevel needles in porcine hearts.
Fig. 7.
Force versus deformation for three of the ten trials on a heart at velocities of 1 mm/s.
Fig. 8 compares the force–displacement trajectories in heart tissue of the trocar and bevel needles for a velocity 1 mm/s. While the rupture force of the bevel needle is smaller than that of the trocar needle, the loading curves are comparable and the rupture produced by each is distinct. To validate and evaluate our model, we consider only needle insertions into heart tissue in the remainder of this paper.
Fig. 8.
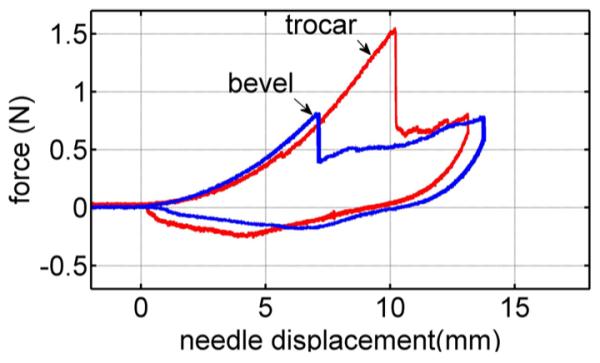
Needle force versus displacement of bevel and trocar needles at 1 mm/s velocity.
2) Rupture Force Versus Velocity
Fig. 9 displays the mean rupture force over the ten trials at each velocity versus velocity for the trocar and bevel needles. As predicted by (17), average rupture force is a decreasing function of velocity. The results also show that the bevel needle produces smaller rupture forces than the trocar needle. This is likely due to the sharper bevel tip producing a smaller tissue contact area than the trocar needle.
Fig. 9.
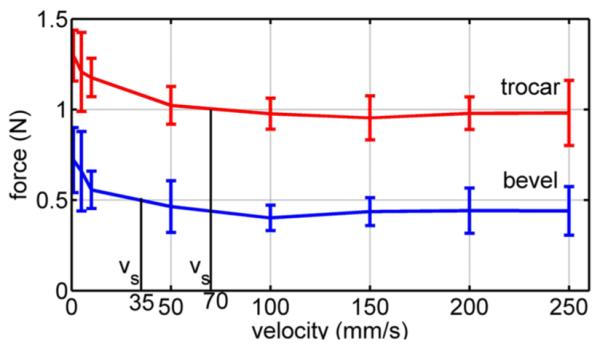
Mean peak rupture force versus velocity for pig heart insertion. Error bars denote standard deviation.
To evaluate the statistical significance of the experiments in confirming (17), 28 statistical hypotheses were defined for each needle that compare mean force at two values of velocity. The hypotheses state that mean rupture force at the smaller velocity is larger than mean rupture force at the larger velocity. The results of one-tailed t-tests are given for both needles in Table I.
TABLE I.
p-Values for Velocity Pair Hypotheses That Rupture Force Is Decreasing Function of Velocity
| v/p | 1 | 5 | 10 | 50 | 100 | 150 | 200 | 250 |
|---|---|---|---|---|---|---|---|---|
| 1 | 0.17 | 0.03 | 2E-4 | 2E-5 | 4E-5 | 3E-5 | 2E-5 | |
| 5 | 0.26 | 0.36 | 0.02 | 6E-3 | 5E-3 | 7E-3 | 7E-3 | |
| 10 | 0.01 | 0.1 | 5E-3 | 4E-4 | 6E-4 | 5E-4 | 4E-4 | |
| 50 | 2E-3 | 0.02 | 0.07 | 0.18 | 0.12 | 0.19 | 0.18 | |
| 100 | 1E-4 | 2E-3 | 8E-4 | 0.12 | 0.33 | 0.52 | 0.5 | |
| 150 | 2E-4 | 5E-3 | 5E-3 | 0.3 | 0.8 | 0.68 | 0.66 | |
| 200 | 6E-4 | 0.01 | 0.02 | 0.36 | 0.79 | 0.54 | 0.47 | |
| 250 | 7E-4 | 0.01 | 0.02 | 0.36 | 0.77 | 0.53 | 0.49 |
Values above the diagonal correspond to the trocar needle and those below correspond to the bevel needle.
Concluding statistical significance for p ≤ 0.05, it can be seen that the hypotheses are satisfied for velocity pairs in the upper right and lower left corners of the table. This trend reflects the shape of the curves in Fig. 9. The larger slope at low velocities produces statistically significant differences in force when comparing low velocities with other low velocities and high velocities. The asymptotic shape at high velocities, however, makes it difficult to show statistical differences between rupture forces at two high velocities.
3) Contact Model
To evaluate the modified Kelvin model (28), its parameters τs, fs (δ), and k(δ) were separately obtained for each needle by performing additional experiments. These experiments were designed to make the identification process less sensitive to the error of finding the displacement at which the needle first contacts the tissue.
The relaxation time constant τs was determined using a tissue relaxation experiment with the trocar needle. The needle was brought into contact at high velocity. After 6 mm of tissue deformation, but before puncture, the needle was rapidly stopped so as to approximate a step change in velocity [25]. When the needle stops, the tissue relaxes and the needle force decreases. The resulting relaxation profile is shown in Fig. 10. As shown, the force measurements include both tissue force and inertia force caused by the acceleration of the needle and its attachment. An exponential force–time response was fit to that portion of the data for which the acceleration and inertia force were zero resulting in a time constant of τs = 0.5 s.
Fig. 10.
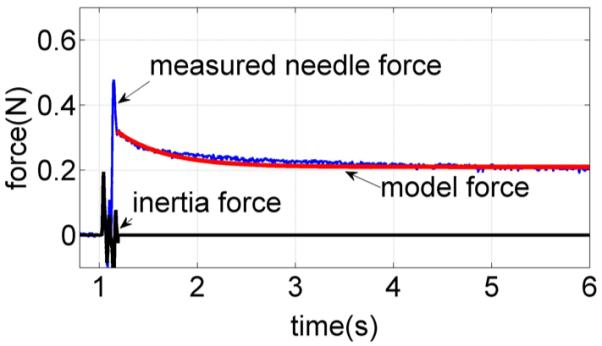
Needle force versus time for a needle that is stopped suddenly prior to puncture. Relaxation response is compared with an exponential curve fit.
The static and dynamic stiffnesses of the model fs (δ) and k(δ) were estimated from two penetration experiments performed on a flat part of the tissue surface at approximately 2 mm distance from each other. This small separation distance ensures the same initial contact displacement values for the pair of tests. The first test, conducted at a velocity of 1 mm/s, was used to approximate the static stiffness. A polynomial curve fit to the measured force–deformation data yields the following:
| (37) |
Fig. 11 shows the force–displacement curve for this test along with the polynomial approximation.
Fig. 11.
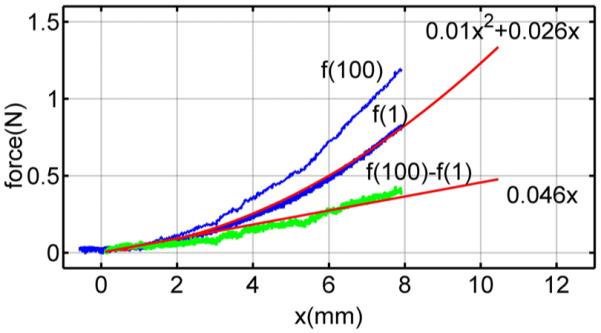
Needle force versus deformation for closely spaced penetrations at velocities of 1 and 100 mm/s. Also shown are a quadratic curve fit for the 100 mm/s data and a linear fit for the difference between the datasets.
The second penetration test conducted at a high velocity, 100 mm/s, is also shown. The dynamic part of needle force at 100 mm/s is obtained by the difference between two measured force responses, as shown in Fig. 11
| (38) |
By (32), fd (v = 100) can be approximated by k(δ)δ at high velocity, and therefore, we estimate k(δ) using
| (39) |
A linear curve fit to (39) yields k(δ) = 0.046. The same approach was used to estimate the contact model parameters for the bevel needle. Table II lists the parameters for both needle types.
TABLE II.
Estimated Modified Kelvin Model Parameters for Bevel and Trocar Needles
| needle | fs(δ (mm)) | k(δ (mm)) | τs(s) |
|---|---|---|---|
| trocar | 0.01δ2 + 0.026δ | 0.046 | 0.5 |
| bevel | 0.0115δ2 + 0.0114δ | 0.0375 | 0.5 |
To evaluate how well the parameters of Table II can predict the 80 datasets recorded for each needle type, the rms error of needle force was computed. To perform this computation, each curve was shifted along the horizontal axis such that zero deformation corresponded to a force of 0.1 N for the trocar needle and a force of 0.05 N for the bevel needle. An example for the trocar needle is shown in Fig. 12. The error as a function of needle displacement is also shown. The rms needle force error for the 80 trials was computed from
| (40) |
in which δc is a prerupture displacement valid for all datasets of a needle. Using values of δc = 4 mm for the bevel needle and δc = 6 mm for the trocar needle yields rms needle force errors of 0.02 and 0.07 N, respectively.
Fig. 12.
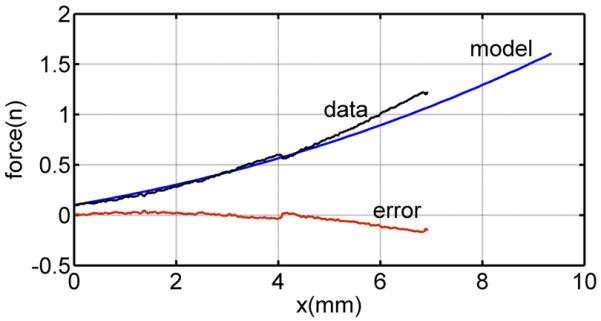
Comparison of the Kelvin model with the measured force for the bevel needle and velocity of 10 mm/s.
4) Rupture Deformation and Work Versus Deformation
Figs. 13 and 14 display average rupture deformation and work versus velocity for each needle. Both curves exhibit the decrease in value with increasing velocity as predicted by (29) and (30). To evaluate the statistical significance of the depicted results, sets of one-tailed t-tests were performed similar to those described earlier for rupture force. While there is insufficient space to present these results in the form of Table I, the values and conclusions are very similar to those reported for rupture force.
Fig. 13.
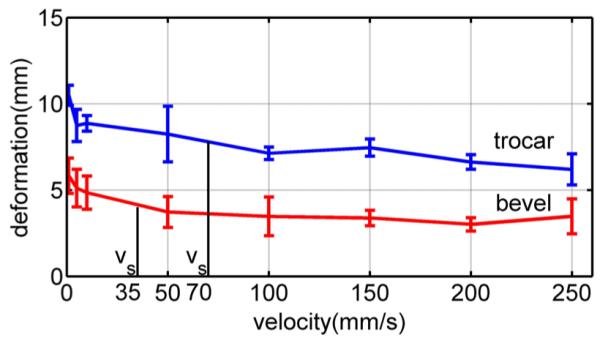
Average rupture deformation versus needle velocity for pig heart. Error bars indicate standard deviation.
Fig. 14.
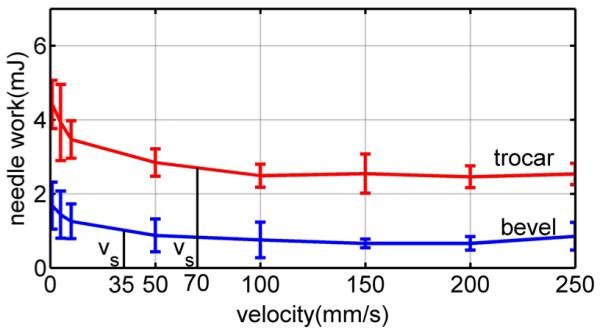
Average needle work versus velocity for pig heart. Error bars indicate standard deviation.
5) Saturation Velocity
To calculate saturation velocity (35), the rupture deformation and relaxation time constant are needed. These can be obtained from two simple tests: one to measure the relaxation time and one high-velocity insertion to measure rupture deformation. Here, we use τs of the modified Kelvin model given in Table II and mean rupture deformation at 100 mm/s from Fig. 13. From the figure, δr = 7 mm for the trocar needle and δr = 3.5 mm for the bevel needle. These values yield saturation velocity values of vs = 70 mm/s for the trocar needle and vs = 35 mm/s for the bevel needle.
The computed values of saturation velocity are noted in the plots of Figs. 9, 13, and 14. It is clear from the figures that they successfully divide the plot into regions of high and low slope. In doing so, they provide a good estimate of the minimum velocity needed to take advantage of the effects of high-velocity insertions. Note that this is true for the average rupture forces of Fig. 9 even though our qualitative fracture model did not explicitly calculate such a velocity.
V. Conclusion
Needle insertion into biological materials includes rupture events during transitions between tissue layers that produce sudden uncontrolled crack propagations. A qualitative fracture model was used to related the rupture force to fracture toughness, and deformation characteristics of the tissue including contact area and internal deformation of cracks inside tissue. A modified Kelvin model was used to relate the force of rupture to tissue deformation and needle work. The model shows that a nonpositive dependence of rupture force on needle velocity produces a negative dependence of rupture deformation and needle work on velocity. We conclude that faster needle insertions can be employed to decrease rupture values. The model also successfully predicts and calculates a finite-insertion velocity that can be employed to achieve most of the benefit of increased velocity.
Acknowledgment
The authors would like to thank N. Steiger and P. Russo for their help performing experiments, and M. Heverly who designed the experimental apparatus.
This work was supported by the National Institutes of Health under Grant R01HL073647 and Grant R01HL087797.
Biography

Mohsen Mahvash (M’05) received the Ph.D. degree in electrical engineering from McGill University, Montreal, QC, Canada, in 2002.
For two years, he was a Postdoctoral Fellow with Johns Hopkins University, Baltimore, MD, where he was also an Assistant Research Professor. Subsequently, he was an Assistant Research Professor in the Department of Mechanical Engineering, Boston University, Boston, MA. He is now with the Cardiovascular Surgery Department of Children’s Hospital Boston and Harvard Medical School, Boston, MA. His research interests include medical robotics, physics-based modeling, haptics, and control.

Pierre E. Dupont (M’99–SM’03) received the B.S., M.S., and Ph.D. degrees in mechanical engineering from Rensselaer Polytechnic Institute, Troy, NY, in 1982, 1984, and 1988, respectively.
From 1988 to 1990, he was a Postdoctoral Fellow in the School of Engineering and Applied Sciences, Harvard University, Cambridge, MA. He was a Professor of mechanical engineering and biomedical engineering at Boston University, Boston, MA. He is currently the Director of Pediatric Cardiac Bio-engineering at Children’s Hospital Boston, Harvard Medical School, Boston, where he is engaged in developing instrumentation and imaging technology for minimally invasive surgery.
Contributor Information
Mohsen Mahvash, M. Mahvash was with Mechanical Engineering, Boston University, Boston, MA 02215 USA. He is now with Cardiovascular Surgery, Children’s Hospital Boston, Harvard Medical School, Boston, MA 02115 USA.
Pierre E. Dupont, P. E. Dupont was with Mechanical Engineering, Boston University, Boston, MA 02215 USA. He is now with Cardiovascular Surgery, Children’s Hospital Boston, Harvard Medical School, Boston, MA 02115 USA (pierre.dupont@childrens.harvard.edu).
References
- [1].Mahvash M, Hayward V. Haptic rendering of cutting, a fracture mechanics approach. Haptics-e, Electron. J. Haptics Res. 2001 Nov;2(3):1–12. [Google Scholar]
- [2].Atkins AG, Mai Y-W. Elastic and Plastic Fracture: Metals, Polymers, Ceramics, Composites, Biological Materials. 1st ed. Halsted; Chichester, U.K.: 1985. [Google Scholar]
- [3].Lathrop A, Smith R, Webster R. Needle-membrane puncture mechanics; presented at Needle Steering Workshop Int. Conf. Med. Image Comput. Comput. Assist. Intervention (MICCAI); NY. 2008. [Google Scholar]
- [4].Heverly M, Dupont P, Triedman J. Trajectory optimization for dynamic needle insertion; Proc. IEEE Int. Conf. Robot.; Barcelona, Spain. 2005.pp. 1658–1663. [Google Scholar]
- [5].Glozman D, Shoham M. Image-guided robotic flexible needle steering. IEEE Trans. Robot. 2007 Jun;23(3):459–467. [Google Scholar]
- [6].DiMaio SP, Salcudean SE. Interactive simulation of needle insertion models. IEEE Trans. Robot. 2005 Jul;52(7):1167–1179. doi: 10.1109/TBME.2005.847548. [DOI] [PubMed] [Google Scholar]
- [7].Webster RJ, Kim JS, Cowan NJ, Chirikjian GS, Okamura AM. Nonholonomic modeling of needle steering. Int. J. Robot. Res. 2006;25(5/6):509–525. [Google Scholar]
- [8].Duindam V, Alterovitz R, Sastry S, Goldberg K. Screw-based motion planning for bevel-tip flexible needles in 3d environments with obstacles; Proc. IEEE Int. Conf. Robot. Autom.; Pasedina, CA. May 2008; pp. 2483–2488. [DOI] [PMC free article] [PubMed] [Google Scholar]
- [9].Kallem V, Cowan N. Image guided control of flexible bevel-tip needles; Proc. IEEE Int. Conf. Robot. Autom.; Rome, Italy. Apr. 2007; pp. 3015–3020. [DOI] [PMC free article] [PubMed] [Google Scholar]
- [10].Webster RJ, III, Memisevic J, Okamura AM. Design considerations for robotic needle steering; Proc. IEEE Int. Conf. Robot. Autom.; 2005.pp. 3599–3605. [Google Scholar]
- [11].Alterovitz R, Branicky M, Goldberg K. Constant-curvature motion planning under uncertainty with applications in image-guided medical needle steering; Proc. Algorithmic Found. Robot. VII; 2008; pp. 319–334. [DOI] [PMC free article] [PubMed] [Google Scholar]
- [12].Chan KK, Watmough DJ, Hope DT, Moir K, Chan F. The mode of action of surgical tissue removing devices; Proc. IEEE 1985 Ultrason. Symp.; 1985.pp. 855–859. [Google Scholar]
- [13].Abolhassani N, Patel R, Moallem M. Needle insertion into soft tissue: A survey. Med. Eng. Phys. 2007;29:413–431. doi: 10.1016/j.medengphy.2006.07.003. [DOI] [PubMed] [Google Scholar]
- [14].Alterovitz R, Goldberg K, Pouliot J, Taschereau R, Hsu I-C. Needle insertion and radioactive seed implantation in human tissues: Simulation and sensitivity analysis; Proc. IEEE Int. Conf. Robot. Autom.; May 2003.pp. 1793–1799. [Google Scholar]
- [15].Misra S, Macura K, Ramesh K, Okamura A. The importance of organ geometry and boundary constraints for planning of medical interventions. Med. Eng. Phys. 2009;31(2):195–206. doi: 10.1016/j.medengphy.2008.08.002. [DOI] [PMC free article] [PubMed] [Google Scholar]
- [16].Okamura AM, Simone C, O’Leary MD. Force modeling for needle insertion into soft tissue. IEEE Trans. Biomed. Eng. 2004 Oct;51(10):1707–1716. doi: 10.1109/TBME.2004.831542. [DOI] [PubMed] [Google Scholar]
- [17].Nienhuy H-W, van der Stappen FA. A computational technique for interactive needle insertions in 3d nonlinear material; Proc. IEEE Int. Conf. Robot. Autom.; 2004.pp. 2061–2067. [Google Scholar]
- [18].Brett P, Parker T, Harrison A, Thomas T, Carr A. Simulation of resistance forces acting on surgical needles. Proc. Inst. Mech. Eng. 1997;211:335–347. doi: 10.1243/0954411971534467. [DOI] [PubMed] [Google Scholar]
- [19].Hing J, Brooks A, Desai J. A biplanar fluoroscopic approach for the measurement, modeling, and simulation of needle and soft-tissue interaction. Med. Image Anal. 2007;11(1):62–78. doi: 10.1016/j.media.2006.09.005. [DOI] [PubMed] [Google Scholar]
- [20].Azar T, Hayward V. In: Bello F, Edwards E, editors. Estimation of the fracture toughness of soft tissue from needle insertion; Proc. 4th Int. Symp. Biomed. Simul. (ISBMS 2008). Lecture Notes in Computer Science; Berlin, Germany: Springer-Verlag. 2008.pp. 166–175. [Google Scholar]
- [21].Anderson TL. Fracture Mechanics: Fundamentals and Applications. 2nd ed. CRC Press; Boca Raton, FL: 1994. [Google Scholar]
- [22].Rice JR, Rosengren GF. Plane strain deformation near a crack tip in a power law hardening material. J. Mech. Phys. Solids. 1968;16:13–31. [Google Scholar]
- [23].Atkins AG, Xu X, Jeronimidis G. Cutting, by pressing and slicing, of thin floppy slices of materials illustrated by experiments on cheddar cheese and salami. J. Mater. Sci. 2004;39(8):2761–2766. [Google Scholar]
- [24].Johnson KL. Contact Mechanics. Cambridge Univ. Press; Cambridge, U.K.: 1987. [Google Scholar]
- [25].Fung YC. Biomechanics, Mechanical Properties of Living Tissues. Springer-Verlag; New York: 1981. [Google Scholar]