

Abstract
Objective
Identifying adults' physical activity patterns across multiple life domains could inform the design of interventions and policies.
Design
Cluster analysis was conducted with adults in two US regions (Baltimore-Washington DC, n = 702; Seattle-King County, n = 987) to identify different physical activity patterns based on adults' reported physical activity across four life domains: leisure, occupation, transport, and home. Objectively measured physical activity, and psychosocial and built (physical) environment characteristics of activity patterns were examined.
Main Outcome Measures
Accelerometer-measured activity, reported domain-specific activity, psychosocial characteristics, built environment, body mass index (BMI).
Results
Three clusters replicated (kappa = .90-.93) across both regions: Low Activity, Active Leisure, and Active Job. The Low Activity and Active Leisure adults were demographically similar, but Active Leisure adults had the highest psychosocial and built environment support for activity, highest accelerometer-measured activity, and lowest BMI. Compared to the other clusters, the Active Job cluster had lower socioeconomic status and intermediate accelerometer-measured activity.
Conclusion
Adults can be clustered into groups based on their patterns of accumulating physical activity across life domains. Differences in psychosocial and built environment support between the identified clusters suggest that tailored interventions for different subgroups may be beneficial.
Keywords: cluster analysis, exercise, built environment, social environment, accelerometer
Ecological and economic models indicate that physical activity occurs across at least four life domains: leisure, occupation, transport, and home (Pratt, Macera, Sallis, O'Donnell, & Frank, 2004; Sallis et al., 2006). Although adults' frequency of physical activity in specific life domains has been investigated (Knuth & Hallal, 2009), little research has explored if subgroups of adults have identifiable ways of organizing, or patterning their physical activity across multiple life domains. A more comprehensive understanding of how adults pattern their activity across multiple life contexts may be beneficial, as the proportion of US adults meeting physical activity guidelines is 49% based on self-report, and 5% based on objective measures (Centers for Disease Control [CDC], 2008; Troiano et al., 2008). Understanding types of physical activity patterns across multiple life domains, and factors related to such patterns, may help identify strategies to tailor interventions and policies to diverse subgroups.
Cluster analysis, a statistical technique that groups individuals into categories based on their similarity (Hair & Black, 2000), may be used to identify physical activity patterns across life domains. Cluster analysis has been used to identify patterns of sedentary behaviors (Zabinski, Norman, Sallis, & Calfas, 2007), multiple health risk behaviors (Poortinga, 2006), active transport (Huang, Stinchcomb, Pickle, Dill, & Berrigan, 2009), psychosocial correlates of physical activity (Norman & Velicer, 2003), and neighborhood characteristics (Nelson, Gordon-Larsen, Yan, & Popkin, 2006). Some previous cluster analyses have also explored cluster pattern replication, as cluster subgroups showing evidence of stability may be targeted by interventions and policies. To our knowledge, no study has used cluster analysis to explore whether adults have identifiable and replicable patterns of accumulating physical activity across multiple life domains. Furthermore, no studies to our knowledge have assessed whether modifiable built environment and psychosocial characteristics differ between clusters of adults' activity patterns.
Built environment and psychosocial characteristics have been shown to be important predictors of physical activity (Sallis et al., 2006). The built environment, the part of the physical environment constructed by humans, includes factors such as the number of residents per land unit (residential density), access to neighborhoods with mixed residential and commercial purposes (land-use mix access and diversity), grid-like streets (street connectivity), neighborhood appeal (aesthetics), safety, and access to recreational facilities. Psychosocial characteristics refer to psychological and social influences on behavior including physical activity-related social support, benefits, barriers, and enjoyment. Existing research suggests that built environment and psychosocial characteristics are associated with total physical activity (Sallis, Bowles, et al., 2009; Wen & Zhang, 2009), specific modes of activity such as walking (Saelens & Handy, 2008; Titze, Stronegger, Janschitz, & Oja, 2008), and activity in specific life domains (Cerin, Vandelanotte, Leslie, & Merom, 2008; Huang et al., 2009). However, it is not known if built environment and psychosocial characteristics differ between groups varying in their patterning of physical activity across multiple life contexts. Understanding the relation between built environment and psychosocial characteristics and adults' activity patterns may suggest ways to tailor these characteristics to increase the activity of different subgroups.
In sum, the present study aims to contribute to the limited research on adults' physical activity patterns across ecological contexts, by exploring: (1) If adults form identifiable physical activity clusters across leisure, occupation, transport, and home domains; and (2) Objectively-measured physical activity, psychosocial, and built environment differences between members of different physical activity clusters.
Method
Design
Participants were recruited between 2002 and 2005 through the Neighborhood Quality of Life Study, an observational epidemiologic study designed to increase understanding of factors that explain variation in population-level physical activity. The study was conducted in the Seattle, WA (King County) and Baltimore-Washington DC metropolitan areas. These two US regions were selected because they had detailed land use Geographical Information System (GIS) databases, variability in walkability across neighborhoods, and provided an opportunity to test generalizability by studying regions on opposite coasts of the US.
Participants were selected from 32 neighborhoods (16 in each region). Neighborhoods were defined as a cluster of contiguous census block groups. The neighborhoods were systematically selected to represent high and low categories of both walkability and neighborhood income, creating four neighborhood “types”: high walkable/high income, high walkable/low income, low walkable/high income, and low walkable/low income.
Neighborhood walkability describes the ability of a resident to walk from home to nearby destinations. A multi-component walkability index was derived from GIS based on features such as mixed-use neighborhoods, street connectivity, and residential density (Frank et al., 2009).
Neighborhood income was determined for each neighborhood block group using US census median household income. Census block groups with median household income values <$15,000 or >$150,000 were excluded to avoid income outliers. The second, third, and fourth deciles within a region constituted the “low income” category, and the seventh, eighth, and ninth deciles constituted the “high income” category. The fifth and six deciles were omitted. More details about the study design are reported in Sallis, Saelens, et al. (2009) and Frank et al. (2009).
Procedure
Participants were randomly selected from commercial marketing records linked to individual household addresses within the study neighborhoods, and recruited by telephone and mail. Up to 8 callbacks were made to recruit one adult per household. Inclusion criteria were: ages 20-65; not residing in group living establishments; and able to walk, wear an accelerometer, and complete written surveys in English. Of 8504 eligible adults contacted, 2551 (30%) provided signed informed consent, and 26% returned complete survey and accelerometer data. Upon receipt of these data, a $20 incentive payment was mailed to each participant. The study was approved by the Institutional Review Board at San Diego State University and the Cincinnati Children's Hospital Medical Center.
Measures
Physical activity measures
The International Physical Activity Questionnaire (IPAQ) self-administered long version was used to assess physical activity in the leisure, occupation, transport, and home domains (Craig et al., 2003). Participants reported the days per week and minutes per day of moderate- and vigorous-intensity physical activity (MVPA) in each life domain over the past seven days. Daily hours of sitting were also reported. In a 12-country study, one-week test retest reliability of the IPAQ was good (Spearman r = 0.70 - 0.88), and criterion validity for the IPAQ total minutes per week was acceptable as measured against accelerometer total counts (pooled Spearman r = 0.33) (Craig et al., 2003).
Participants were asked to wear an accelerometer (Actigraph, Manufacturing Technology Incorporated, model 7164 or 71256; Fort Walton, FL) for seven consecutive days for at least ten hours per day. The Actigraph records movement due to physical activity as activity counts (current study epoch period was set to aggregate counts to ‘per minute’) and has been extensively validated (Freedson & Miller, 2000; Welk, 2002). A valid accelerometer hour was defined as having no more than 30 consecutive ‘zero’ values and a valid day consisted of 10 valid hours. If there were not at least 5 valid days or a minimum of 66 valid hours across 7 days, the participant was asked to re-wear the accelerometer. MVPA was determined by using activity count “cut points” established for the Actigraph when assessing adult physical activity in free living conditions (Freedson & Miller, 2000). These activity count cut-points were applied to raw accelerometer data and total minutes at or above the MVPA threshold were obtained for each participant. Total minutes of MVPA per week were then divided by the number of valid days to obtain the average number of MVPA minutes per day.
Demographic and health-indicator variables
Age, sex, race/ethnicity, annual household income (11 categories, response range of <$10,000 to >$100,000), highest education (7 categories, response range of less than 7th grade to completed graduate degree), marital status, number of children under 18 years, owning vs. renting a home, number of drivable motor vehicles in the household, and height and weight were self-reported. Body mass index (BMI) was computed as weight in kilograms divided by height in meters squared. Adults' reports of weight and height are routinely used in epidemiological research (Stewart, 1982) and are strongly correlated with objectively measured values; r >.90; (Stewart, 1982; Wing, Epstein, Ossip, & LaPorte, 1979). Self-rated overall health was assessed on a 5-point Likert-scale (1 = poor; 5 = excellent) from the National Health Interview Survey (U.S. Department of Health and Human Services [USDHHS], 1989). Self-rated health is a significant predictor of mortality and health-care utilization (Salomon, Nordhagen, Oza, & Murray, 2009).
Psychosocial characteristics
Family and friend support for physical activity were each measured with 3 items from a shortened version of a previously-validated scale (Sallis, Grossman, Pinski, Patterson, & Nader, 1987). Participants separately rated how often (1 = none; 5 = very often) over the last three months their friends and family had supported their physical activity (e.g., “did physical activities with me”). Internal consistency (alpha) in the present study was good (family support: α = 0.85; friend support: α = 0.88).
Perceived benefits of exercise (e.g., “I will meet new people”) were measured by assessing agreement (1 = strongly disagree; 5= strongly agree) with 10 previously validated items (Hovell et al., 1989). Perceived barriers of exercise (e.g., “lack of time”) were measured by assessing frequency (1 = never; 5 = very often) of 15 previously validated items (Hovell et al., 1989). Enjoyment of MVPA was assessed with six items adapted from Kendzierski & DeCarlo (1991) that measured enjoyment of feelings overall, during exercise, and after exercise (1 = strongly disagree; 5 = strongly agree). Internal consistency in the present study for the perceived benefits, barriers, and enjoyment scales was good (α = 0.88 for each scale, respectively).
Built environment characteristics
The validated Neighborhood Environment Walkability Scale (NEWS; Saelens, Sallis, Black, & Chen, 2003) assessed perceived built environment characteristics theoretically associated with increased physical activity: (a) residential density; (b) proximity and ease of access to nonresidential land uses such as restaurants and stores (land use mix-access and diversity); (c) street connectivity; (d) walking or cycling facilities, such as sidewalks and bike trails; (e) neighborhood aesthetics; (f) pedestrian traffic safety; and (g) crime safety. With the exception of the residential density and land use mix-diversity subscales, participants' self-reported responses for all items were scaled from 1 (strongly disagree) to 4 (strongly agree). Residential density items asked about the frequency of various residence types, from single-family detached homes to 13-story or higher apartments/condominiums, with a response range of 1 (none) to 5 (all). Land use mix-diversity was assessed by the walking time from home to 23 types of stores and facilities, with responses ranging from 1- to 5-min walking time (coded as 5) to 30-min or more walking time (coded as 1). Higher scores on all subscale items indicated a more favorable environment for physical activity. Scoring information is available at www.drjamessallis.sdsu.edu. Test-retest reliability for the NEWS subscales was acceptable (r = 0.58 - 0.80) (Saelens et al., 2003).
Convenient activity facilities were measured by the sum of “yes” responses for 18 physical activity facilities (e.g., gym, public park) within a 5-minute drive from work or home (adapted from Sallis, Johnson, Calfas, Caparosa, & Nichols, 1997). Home exercise equipment was measured by the sum of “yes” responses for 15 types of physical activity equipment (e.g., weight lifting equipment, workout videotapes) at the place of residence (adapted from Sallis et al., 1997). These measures had good test-retest reliability (convenient activity facilities: r = 0.80; home exercise equipment: r = 0.89) and validity (Sallis et al., 1997).
Data Analysis
Overall approach
Participants were clustered based on their similarity on total weekly minutes of MVPA for each life domain measured by the IPAQ: leisure, occupation, transport, and home. Selection of these four clustering variables was a deductive, theory-driven approach based on ecological and economic models (Pratt et al., 2004; Sallis et al., 2006). The clustering procedure was inductive, and based on the mathematical similarity of participants' weekly minutes of MVPA for each life domain. The cluster analysis was conducted separately on two samples (Baltimore region, n = 702; and Seattle region, n = 987) to test the replicability and stability of the clusters (internal validity). Characteristics of the clusters and their relationship to theoretically-related correlates were then examined (external validity).
Preliminary analyses
Complete data on the four clustering variables (total weekly minutes of MVPA for the four domains based on the IPAQ) were available for 1792 (81.5%) of the study's original sample of 2,199 participants. Of the excluded 407 participants, 404 (99.3%) did not provide data on occupational activity because they were not employed outside the home and 3 (0.7%) had missing data.
Outlier analysis
As recommended (Hair & Black, 2000), observations on each clustering variable that exceeded 3.29 standard deviations from the mean were deleted (n = 103, 5.7%), leaving a final sample of 1689 participants (Baltimore-region, n = 702; Seattle-region, n = 987).
Multicollinearity
Bivariate correlations were conducted with the whole sample (n = 1689) to examine collinearity among the four clustering variables (i.e., minutes of MVPA in four life domains). The highest correlation was 0.2. Variance inflation factors which provide evidence of multicollinearity were less than 10 (mean = 1.1) and tolerance statistics were above 0.2 (mean = 0.9), suggesting that the shared variance between the clustering variables was sufficiently small that each variable could contribute to the cluster analysis (Hair & Black, 2000).
Variable standardization
The cluster variables were standardized to Z-scores (mean = 0, SD = 1) to equalize the contribution of each variable in the cluster analysis (Hair & Black, 2000).
Data transformations
Variables with high skew that were used to describe the clusters (IPAQ domain scores) or in the external validation of the clusters (accelerometer-measured physical activity) were log transformed and then back-transformed to obtain the geometric means and 95% confidence intervals.
Cluster analysis
As recommended (Blashfield & Aldenderfer, 1988; Hair & Black, 2000), a two-step clustering procedure was used. First, agglomerative hierarchical cluster analysis was performed separately on the samples from the Baltimore and Seattle regions to obtain the initial cluster groupings and the starting points (cluster means) for each of the clusters. Squared Euclidean distance was used to measure the distance between the individual observations on the clustering variables, and Ward's minimum variance method, which tends to derive more equally sized groups, was used to form the clusters (Ward, 1963). The number of clusters was selected based on the rescaled distances evident in the hierarchical cluster dendrograms, the percentage change in agglomeration coefficients at each step of the cluster analysis, and conceptual considerations (Hair & Black, 2000). A 3-cluster solution generated 3 distinct pattern profiles that clearly replicated between the Baltimore- and Seattle-region samples. In the second step of the cluster analysis, the cluster means (centroids) from the hierarchical 3-cluster solutions for the Baltimore and Seattle regions were separately submitted to a nonhierarchical, k-means cluster analysis to refine the initial cluster solution, and to reduce the risk of cluster misassignment common with hierarchical cluster methods (Blashfield & Aldenderfer, 1988). To characterize the three clusters, each cluster was categorized as “Low, Moderate, or High” in total self-reported IPAQ activity based on established guidelines (www.ipaq.ki.se/scoring.pdf). In addition, the profile pattern characteristics of elevation (mean level of the profile), scatter (dispersion of the profile's scores around their average), and shape (configuration of scores across the clustering variables) were assessed (Cronbach & Gleser, 1953).
Internal validation
McIntyre and Blashfield's (1980) nearest-centroid cross validation technique was used to test the stability, or replicability, of the k-means cluster solution across the Baltimore- and Seattle-region samples. The cross-validation procedure involved finding the minimal distance for each person in the Baltimore region to the cluster centers of the Seattle region and assigning each person to the nearest cluster center. The kappa statistics measured agreement between the nearest assigned cluster and the original clusters. The procedure was then conducted while reversing the role of the Baltimore and Seattle regions for double cross-validation of the three-cluster solution.
External validation
To assess the association of the clusters with theoretically-related variables, the Baltimore- and Seattle-region samples were combined into one sample, which was justified by the internal validation analyses. Multivariate Analysis of Variance (MANOVA), Analysis of Variance (ANOVA) with Bonferroni multiple comparison tests, if appropriate, and chi-square analysis with a Bonferroni correction for multiple tests, were used to examine cluster profiles on objectively measured physical activity, health-related, psychosocial, and built environment variables. Analyses were conducted with SPSS-version 15.0.
Results
Participants
Compared to Seattle-region participants, Baltimore-region participants were more likely to be older, female, non-white, have higher education and income, own their home, have lower levels of accelerometer-measured physical activity, and exhibit a trend toward higher BMI (Table 1). Comparisons of participant demographics (n = 1,689) with national census data showed the sample was older (median age, 44.6 vs. 35.7 years, p < .001), had fewer females (45.4% vs. 51.8%, p < .001), more Whites (74.8% vs. 65.1%, p < .001), fewer Hispanics (4.0% vs. 5.6%, p < .01), and higher household incomes (median incomes, $70-$79,000 vs. $50-$59,000, p < .001) than residents of the census block groups in which participants lived.
Table 1. Sample Characteristics.
| Region | |||
|---|---|---|---|
| Characteristics | Baltimore (n ≥ 655) |
Seattle (n ≥ 946) |
P |
| Agea | 46.0 (10.6) | 43.6 (10.7) | < .001 |
| Male b | 49.7 | 58.0 | .001 |
| White non-Hispanicb | 63.8 | 82.6 | < .001 |
| Highest educationa, c | 6.0 (1.0) | 5.8 (0.9) | < .001 |
| Annual household incomea, d | 7.8 (2.9) | 7.3 (3.0) | < .001 |
| Own homeb | 81.0 | 71.8 | < .001 |
| Married or living with partnerb | 59.9 | 63.4 | .141 |
| Number of children under 18 yearsa | 0.7 (1.0) | 0.7 (1.0) | .229 |
| Number of motor vehicles in household | 1.9 (1.0) | 2.0 (1.2) | .110 |
| High walkability neighborhoodb | 50.0 | 50.4 | .886 |
| High income neighborhood b | 55.0 | 51.0 | .103 |
| Body mass indexa | 27.1 (5.7) | 26.5 (5.3) | .054 |
| Accelerometer: Moderate and vigorous activity mins/daye | 23.8 (22.4-25.3) | 30.3 (29.1-31.8) | < .001 |
Note. Due to missing data, n sizes ranged: Baltimore region = 655-702; Seattle region = 946-987.
Means and standard deviations (in parentheses) reported.
Reported as percentage.
Highest education: 6 = completed college or university, but not graduate degree.
Annual household income: 7 = $60,000-$69,000; 8 = $70,000-$79,000.
Geometric means and 95% confidence intervals (in parentheses) reported.
Cluster Analysis
Figure 1 shows the final k-means cluster profiles expressed in standardized scores for the Baltimore- and Seattle-region samples, respectively. Cluster names were based on the pattern of MVPA minutes per week across the four life domains that characterized each cluster, relative to the other clusters.
Figure 1. Physical Activity Cluster Profiles in Baltimore and Seattle Regions.
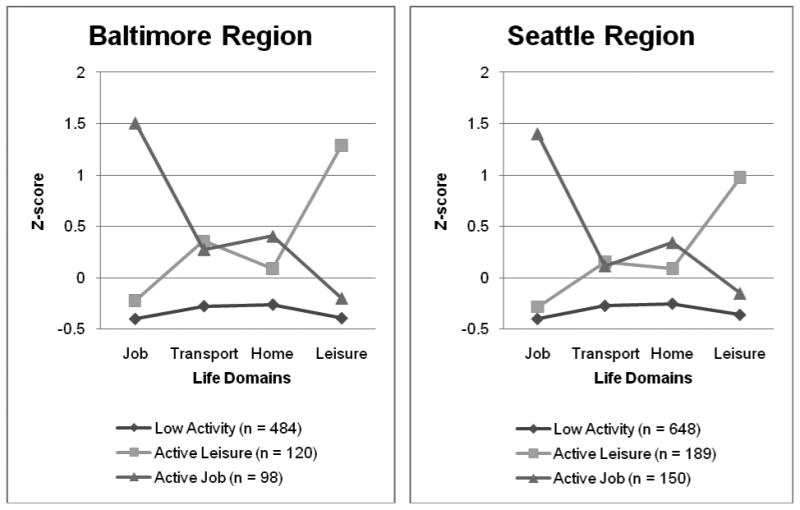
Cluster 1: Low Activity
This cluster reported activity levels about -0.3 standard deviations below the sample mean on all life domains. The profile of Cluster 1 had a flat shape, low elevation, and little scatter (Figure 1). Participants had a geometric mean of 67.0 minutes (95% CI, 62.4-71.8) of self-reported MVPA per average day summed across the four life domains. The Low Activity cluster comprised 69% and 66% of the Baltimore- and Seattle-region samples, respectively. Their self-reported activity level would be categorized as “moderate” based on the IPAQ scoring protocol (www.ipaq.ki.se/scoring.pdf), although it was “low” relative to the other cluster profiles.
Cluster 2: Active Leisure
This cluster reported leisure physical activity levels 1.1 standard deviations above the sample mean, and near-average levels of transport, home, and occupational activity. The profile of Cluster 2 had a spike for leisure activity, average elevation and high scatter. Participants had a geometric mean of 224.5 minutes (95% CI, 211.5-236.1) of self-reported MVPA summed across all domains per average day, with a geometric mean of 79.4 daily minutes (95% CI, 75.5-82.6) spent in leisure-related MVPA. The Active Leisure cluster comprised 17% and 19% of the Baltimore- and Seattle-region samples, respectively, and their self-reported activity level would be categorized as “high.” (www.ipaq.ki.se/scoring.pdf)
Cluster 3: Active Job
This cluster reported occupational physical activity levels 1.4 standard deviations above the sample mean, and near-average levels of transport, home, and leisure activity. The profile of Cluster 3 had a spike for job-related physical activity, average elevation, and high scatter. Participants had a geometric mean of 504.8 minutes (95% CI, 485.0-520.1) of self-reported MVPA summed across all domains per average day, with a geometric mean of 328.4 (95% CI, 315.5-348.7) daily minutes spent in job-related MVPA. The Active Job cluster comprised 14% and 15% of the Baltimore- and Seattle-region samples, respectively, and their self-reported activity level would be categorized as “high.” (www.ipaq.ki.se/scoring.pdf)
Internal Validity and Double Cross-Validation of Clusters
Comparing the original K-means cluster assignments for the Seattle-region participants to their nearest centroid classification from the Baltimore region, the overall agreement was 95%, and the kappa statistic was .90, t = 38.0, p < .0001. Comparing the original K-means cluster assignments for the Baltimore-region participants to their nearest centroid classification from the Seattle region, the overall agreement was 96%, and the kappa statistic was .93, t =32.8, p < .0001. Kappa statistics greater than .80 indicate high agreement (McGinn et al., 2004). Figure 1 shows the replication of the three-cluster solution across the two regions.
Demographic and Neighborhood Characteristics of Clusters
Compared to the Low Activity and the Active Leisure clusters, the Active Job cluster was more likely to be male, have lower education and income, and live in a lower income neighborhood (Table 2). The Active Job cluster was also less likely to own their own home and less likely to be married or living with a partner than the Low Activity cluster.
Table 2. Demographic and Neighborhood Characteristics by Cluster, Combined Baltimore-Seattle Region Sample.
| Cluster | |||
|---|---|---|---|
| Characteristics | Low Activity (n ≥ 1079) |
Active Leisure (n ≥ 298) |
Active Job (n ≥ 231) |
| Age | 44.5 (10.8) | 44.6 (10.6) | 44.8 (10.4) |
| Male a | 52.8a | 52.8b | 64.9 a, b |
| White non-Hispanic a | 75.8 | 75.6 | 69.4 |
| Highest education categoryb | 6.0 (0.9) a | 6.0 (1.0) b | 5.4 (1.0) a, b |
| Annual household income categoryc | 7.7 (2.9) a | 7.9 (3.0) b | 6.2 (2.8) a, b |
| Own home a | 77.8 a | 74.0 | 67.7 a |
| Married or living with partner a | 64.3 a | 57.6 | 56.5 a |
| Number of children under 18 years | 0.7 (1.0) | 0.6 (1.1) | 0.7 (1.1) |
| Number of motor vehicles in household | 2.0 (1.1) | 1.9 (1.0) | 2.1 (1.3) |
| High walkability neighborhood a | 50.4 | 52.8 | 46.0 |
| High income neighborhooda | 54.1 a | 59.9 b | 37.1 a, b |
Note. Due to missing data, n sizes ranged: Low Activity = 1079-1132; Active Leisure = 298-309; Active Job = 231-248. Standard deviations appear in parentheses. The Baltimore and Seattle-region samples were analyzed separately and ANOVA and chi-square indicated a similar pattern of results to the combined sample.
Reported as percentage.
Highest education: 6 = completed college or university, but not graduate degree.
Annual household income: 7 = $60,000-$69,000; 8 = $70,000-$79,000.
Across each row, only items sharing the same subscript letter differ significantly (p < .05).
Objectively-Measured Physical Activity and Health-Related Characteristics of Clusters
MANOVA indicated that there was a significant effect of cluster grouping on objectively-measured physical activity and health-related characteristics (Hotelling's T = 0.17, F (10, 3222) = 26.89, p < .001). Follow-up ANOVAs (Table 3) indicated that compared to the Low Activity and Active Job clusters, the Active Leisure cluster had greater accelerometer-measured total MVPA, as well as greater moderate and vigorous intensity physical activity when evaluated separately. The Active Leisure cluster also reported a lower BMI (the difference being equivalent to approximately ten fewer pounds for a person 5′8″ in height), and better self-rated health than the other clusters. The Active Job cluster reported the least sitting per day.
Table 3. Physical Activity and Health-Related Characteristics by Cluster, Combined Baltimore-Seattle Region Sample.
| Cluster | Effect Sizes (Cohen's d)d | |||||
|---|---|---|---|---|---|---|
| Characteristics | Low Activity (n ≥ 1097) |
Active Leisure (n ≥ 294) |
Active Job (n ≥ 238) |
Active Leisure vs. Low Activity | Active Leisure vs. Active Job | Active Job vs. Low Activity |
| Accelerometer: Moderate mins/daya | 23.3 (22.2-24.3)a, b | 32.8 (30.3-35.5)a | 29.7 (26.8-32.8)b | 0.55 | 0.13 | 0.42 |
| Accelerometer: Vigorous mins/daya | 1.9 (1.8-2.0) a | 2.9 (2.5-3.3) a, b | 1.8 (1.6-2.0) b | 0.42 | 0.48 | -0.08 |
| Accelerometer: Moderate and vigorous mins/daya | 24.8 (23.6-25.8)a | 36.6 (33.8-39.7)a | 30.9 (27.9-34.1)a | 0.54 | 0.26 | 0.27 |
| Total mins spent sitting/dayb | 407.7 (179.5)a | 357.7 (152.5)a | 274.5 (150.9)a | -0.29 | 0.55 | -0.76 |
| Body mass indexb | 27.0 (5.8) a | 25.6 (4.5) a, b | 27.2 (4.8) b | -0.25 | -0.35 | 0.04 |
| Self-rated healthb, c | 3.8 (0.8)a | 4.0 (0.8) a, b | 3.7 (0.8) b | 0.25 | 0.38 | -0.13 |
Note. Due to missing data, n sizes ranged: Low Activity = 1097-1131; Active Leisure = 294-309; Active Job = 238-248. The Baltimore and Seattle-region samples were analyzed separately and ANOVA indicated a similar pattern of results to the combined sample.
Geometric means and 95% confidence intervals (in parentheses) reported.
Means and standard deviations (in parentheses) reported.
Self-rated health: 1 = poor; 5 = excellent.
Cohen's d effect sizes: 0.2 = small; 0.5 = medium; 0.8 = large (Cohen, 1988).
Across each row, only items sharing the same subscript letter differ significantly (p < .05).
Psychosocial and Built Environment Characteristics of Clusters
MANOVA indicated that there was a significant effect of cluster grouping on the degree of psychosocial (Hotelling's T = 0.09, F (10, 3342) = 14.59, p < .001) and built environment support (Hotelling's T = 0.04, F (20, 3348) = 3.2, p < .001) for physical activity. Follow-up ANOVAs (Table 4) indicated that compared to the Low Activity and the Active Job clusters, the Active Leisure cluster reported more psychosocial and built environment support. When comparing the Active Leisure cluster to the other clusters, the average difference in psychosocial support was equivalent to a medium effect, and the average difference in built environment support was equivalent to a small effect (Cohen, 1988). The stronger psychosocial support for the Active Leisure cluster relative to the other clusters was consistent across all psychosocial variables, with effects largest for friend social support and exercise barriers (Table 4). This pattern was similarly found for the built environment characteristics of neighborhood aesthetics and activity facility convenience. There was little difference in psychosocial and built environment support between the Active Job and the Low Activity clusters.
Table 4. Psychosocial and Built Environment Characteristics by Cluster, Combined Baltimore-Seattle Region Sample.
| Cluster | Effect Sizes (Cohen's d)a | |||||
|---|---|---|---|---|---|---|
| Characteristics | Low Activity (n ≥ 1128) |
Active Leisure (n = 309) |
Active Job (n ≥ 247) |
Active Leisure vs. Low Activity | Active Leisure vs. Active Job | Active Job vs. Low Activity |
| Psychosocial | ||||||
| Family social support | 1.4 (1.1) a | 1.7 (1.3) a, b | 1.5 (1.2)b | 0.26 | 0.16 | .09 |
| Friend social support | 1.3 (1.1) a | 1.9 (1.2) a, b | 1.2 (1.1) b | 0.53 | 0.61 | -.09 |
| Exercise benefits | 4.2 (0.6) a | 4.4 (0.6) a, b | 4.2 (0.6) b | 0.33 | 0.33 | .00 |
| Exercise barriers | 1.4 (0.6) a | 1.0 (0.6) a, b | 1.4 (0.7) b | -0.67 | -0.62 | .00 |
| Exercise enjoyment | 4.0 (0.8) a | 4.3 (0.7) a, b | 4.0 (0.8) b | 0.38 | 0.40 | .00 |
| Built environment | ||||||
| Neighborhood aesthetics | 3.1 (0.6) a | 3.2 (0.6) a, b | 3.0 (0.7) b | 0.17 | 0.31 | -0.16 |
| Convenient activity facilities count | 10.2 (3.8) a | 11.6 (3.8) a, b | 10.4 (3.9) b | 0.37 | 0.31 | 0.05 |
| Walking/cycling facilities | 2.9 (0.6) | 3.0 (0.7) | 2.9 (0.7) | 0.16 | 0.14 | 0.00 |
| Home equipment count | 5.5 (2.5) a | 6.0 (2.4) a | 5.5 (2.9) | 0.20 | 0.19 | 0.00 |
| Residential density | 224.6 (66.2) | 235.4 (78.6) | 233.2 (82.8) | 0.16 | 0.03 | 0.12 |
| Land use mix diversity | 3.1 (0.9) a, b | 3.3 (0.9) a | 3.3 (0.8) b | 0.22 | 0.00 | 0.23 |
| Land use mix access | 2.9 (0.6) a, b | 3.0 (0.6) a | 3.0 (0.6) b | 0.17 | 0.00 | 0.17 |
| Street connectivity | 2.8 (0.6) | 2.9 (0.6) | 2.8 (0.6) | 0.17 | 0.17 | 0.00 |
| Pedestrian safety | 2.9 (0.5) | 3.0 (0.5) | 2.9 (0.5) | 0.20 | 0.20 | 0.00 |
| Crime safety | 3.4 (0.6) | 3.4 (0.6) a | 3.3 (0.7) a | 0.00 | 0.15 | -0.16 |
Note. Due to missing data, n sizes ranged: Low Activity = 1128-1132; Active Job = 247-248. Standard deviations appear in parentheses. The Baltimore and Seattle-region samples were analyzed separately and ANOVA indicated a similar pattern of results to the combined sample.
Cohen's d effect sizes: 0.2 = small; 0.5 = medium; 0.8 = large (Cohen, 1988).
Across each row, only items sharing the same subscript letter differ significantly (p < .05).
Discussion
The present study identified three patterns of accumulating physical activity across life domains that replicated in two US regions: A Low Activity cluster with activity below the sample mean, an Active Leisure cluster, and an Active Job cluster. The greatest unique variation in adults' physical activity levels was observed in the leisure and occupational domains (Figure 1). Consistent with other research (Pratt et al., 2004), this suggests that adults' leisure and occupational environments may vary more in opportunities for physical activity than their home and transportation environments. The replication of all three clusters across two geographically and demographically different samples increases confidence the clusters could generalize to other US regions. However, the limits of generalizability remain to be tested.
The Low Activity and Active Leisure clusters were similar on all demographic variables measured (Table 2), but Low Activity adults had the lowest accelerometer-measured activity, consistent with their poorer health indicators. Psychosocial and built environment characteristics may help explain the underlying mechanisms behind these two clusters. Compared to the Active Leisure cluster, the Low Activity cluster had less family and friend support for exercise, fewer perceived exercise benefits and more barriers, and less exercise enjoyment. Among built environmental variables, the Low Activity cluster reported less attractive neighborhood aesthetics, fewer convenient neighborhood exercise facilities, less home exercise equipment, and less proximity and access to non-residential land uses such as restaurants and stores. Thus, Active Leisure adults were differentiated from Low Activity adults by modifiable psychosocial and environmental factors, rather than immutable demographics. These findings are consistent with research showing multiple environmental correlates of physical activity (Saelens & Handy, 2008; Sallis et al., 2006; Sallis, Bowles, et al., 2009; Wen & Zhang, 2009). These findings are also consistent with ecological models indicating that social and built environments may increase physical activity by “automatically” engineering opportunities to cue and reinforce physical activity (Hovell, Wahlgren, & Adams, 2009). Although evidence of the direction of influence between environmental characteristics and physical activity is limited, several longitudinal and experimental studies concur with these findings, and suggest that Low Activity adults may benefit from neighborhoods containing activity-supportive facilities, positive aesthetics, and opportunities for social interaction (Handy, Cao, & Mokhtarian, 2008; Wing & Jeffery, 1999). More longitudinal and experimental studies are needed to clarify if establishing activity-supportive environments across multiple life domains could increase Low Activity adults' total physical activity.
The Active Leisure cluster was validated by the highest levels of accelerometer-measured physical activity, and exhibited the most positive outcomes for BMI and self-rated health. Not surprisingly, members of this cluster had the highest psychosocial and built environment support for physical activity. Although higher than the other clusters, Active Leisure adults averaged less than 3 mins/day of accelerometer-measured vigorous activity, suggesting a need to expand social and built environment cues and reinforcers already operating for this cluster to achieve recommended levels of vigorous activity (Hovell et al., 2009). Tailored interventions might expand the range of higher-intensity physical activity modes (e.g., running, aerobics) and settings for activity (e.g., fitness clubs, classes) to increase opportunities for such cues and reinforcement. These strategies are consistent with evidence suggesting that engaging in multiple activity modes increases total physical activity (Bowles, Merom, Chey, Smith, & Bauman, 2007).
The Active Job cluster was more likely to be male and have lower education and income than members of other clusters. Active Job adults exhibited a large discrepancy between their high self-reported occupational activity and lower accelerometer-measured activity, which may indicate over-reporting of occupational activity or limitations of accelerometers for capturing occupational activities. The Active Job cluster's BMI was similar to the Low Activity cluster and higher than the Active Leisure cluster. Similarly, their scores on psychosocial and built environmental support paralleled the Low Activity cluster but were lower than the Active Leisure cluster. These findings suggest that Active Job adults may have more prompts for sedentary than for active behaviors when not engaged in active work. Active Job adults may also have fewer economic resources to invest in physical activity than members of other clusters. Workplace and community policies that provide economic incentives and opportunities for physical activity in the leisure and transport domains may increase Active Job adults' physical activity outside of work. Policies supporting financial incentives for exercise, subsidies for exercise facilities, and paid time for non-work-related physical activity may be beneficial (Finkelstein, Brown, Brown, & Buchner, 2008; Lucove, Huston, & Evenson, 2007).
Few participants reported substantial transport-related activity (Figure 1), consistent with reports of two cars per average family in this study, and other studies in automobile-oriented cities (Aytur, Rodriguez, Evenson, Catellier, & Rosamond, 2007). The Active Leisure and Active Job clusters reported significantly more transport-related activity than the Low Activity group. However, even in a study designed to oversample adults living in walkable neighborhoods, active transportation still contributed modestly to total physical activity for most adults. More extensive transit systems and more workplaces and destinations within walking or cycling distance to homes may be needed to detect an active transport cluster (Heath et al., 2006; Pratt et al., 2004; Saelens & Handy, 2008).
Home-based physical activity was relatively low among all identified clusters. Evidence suggests that residential settings can be engineered to prompt more physical activity through establishing community gardens (Armstrong, 2000), reducing access to electric devices (Pratt et al., 2004), and reducing elevator access in multi-story residences (Shenassa, Frye, Braubach, & Daskalis, 2008). Residential interventions may be more effective if they emphasize social, economic, and health-related incentives for increasing physical activity (Hovell et al., 2009).
Strengths of the present study included use of validated and standardized measures, objective accelerometer measurement, and replication of the clusters across large samples from two U.S. regions with divergent characteristics. A limitation suggested by discrepancies between the accelerometer and IPAQ data is that the IPAQ may lead to substantial over-reporting of physical activity, consistent with other studies (Johnson-Kozlow, Sallis, Gilpin, Rock, & Pierce, 2006; Rzewnicki, Auweele, & De Bourdeaudhuij, 2003). Contributing to discrepancies, accelerometers underestimate activities at low or high speeds, and those that involve limited trunk movement or carrying heavy loads (Freedson & Miller, 2000). Future studies would benefit from incorporating more objective measures of health status, and exploring the replicability of the clusters across more diverse regions and more representative samples. The sample was higher income, Caucasian, limited to employed adults, and unrepresentative of national census data. This was an exploratory study for the purpose of hypothesis-generation, and results require further confirmation with more diverse groups.
The present study suggested that many members of all clusters could benefit from greater psychosocial and built environment support to meet recommended physical activity levels. While all clusters reported less than optimal levels of environmental support for physical activity (Table 4), the small, but consistently higher levels of support for the Active Leisure cluster were accompanied by higher accelerometer-measured physical activity and lower BMI in this cluster. Effect sizes indicated that the average difference between the Active Leisure and the other clusters was equivalent to a medium effect for psychosocial support and small effect for built environment support. This suggests that even small increases in psychosocial and built environment support might increase physical activity among the other clusters. Future research should explore the effects of different magnitudes, types, and combinations of environmental support on sustaining active living among diverse subgroups (Pratt et al., 2004; Sallis et al., 2006).
Acknowledgments
This research was funded, in part, by NIH grant R00 HL088017 awarded to Dr. Rovniak, by NIH grant R01 HL67350 awarded to Dr. Sallis, and by NIH grant R01 CA138192 awarded to Dr. Hovell.
Contributor Information
Liza S. Rovniak, Pennsylvania State University College of Medicine.
James F. Sallis, San Diego State University.
Brian E. Saelens, Seattle Children's Hospital Research Institute and the University of Washington, Seattle.
Lawrence D. Frank, University of British Columbia.
Simon J. Marshall, San Diego State University.
Gregory J. Norman, University of California, San Diego.
Terry L. Conway, San Diego State University.
Kelli L. Cain, San Diego State University.
Melbourne F. Hovell, San Diego State University.
References
- Armstrong D. A survey of community gardens in upstate New York: Implications for health promotion and community development. Health and Place. 2000;6(4):319–327. doi: 10.1016/s1353-8292(00)00013-7. [DOI] [PubMed] [Google Scholar]
- Aytur SA, Rodriguez DA, Evenson KR, Catellier DJ, Rosamond WD. Promoting active community environments through land use and transportation planning. American Journal of Health Promotion. 2007;21(4, Suppl. 1):397–407. doi: 10.4278/0890-1171-21.4s.397. [DOI] [PubMed] [Google Scholar]
- Blashfield RK, Aldenderfer MS. The methods and problems of cluster analysis. In: Nesselroade JR, Cattell RB, editors. Handbook of multivariate experimental psychology. New York: Plenum Press; 1988. pp. 447–474. [Google Scholar]
- Bowles HR, Merom D, Chey T, Smith BJ, Bauman A. Associations of type, organization, and number of recreational activities with total activity. Journal of Physical Activity and Health. 2007;4(4):469–480. [PubMed] [Google Scholar]
- Centers for Disease Control & Prevention. Prevalence of self-reported physically active adults—United States, 2007. Morbidity and Mortality Weekly Report. 2008;57(48):1297–1300. [PubMed] [Google Scholar]
- Cerin E, Vandelanotte C, Leslie E, Merom D. Recreational facilities and leisure-time physical activity: An analysis of moderators and self-efficacy as a mediator. Health Psychology. 2008;27(2 Suppl. 1):126–135. doi: 10.1037/0278-6133.27.2(Suppl.).S126. [DOI] [PubMed] [Google Scholar]
- Cohen J. Statistical Power Analysis for the Behavioral Sciences. Hillsdale, NJ: Lawrence Erlbaum Associates; 1988. [Google Scholar]
- Craig CL, Marshall AL, Sjostrom M, Bauman AE, Booth ML, Ainsworth BE, Oja P. International physical activity questionnaire: 12-country reliability and validity. Medicine and Science in Sports and Exercise. 2003;35(8):1381–1395. doi: 10.1249/01.MSS.0000078924.61453.FB. [DOI] [PubMed] [Google Scholar]
- Cronbach LJ, Gleser GC. Assessing the similarity between profiles. Psychological Bulletin. 1953;50(6):456–473. doi: 10.1037/h0057173. [DOI] [PubMed] [Google Scholar]
- Finkelstein EA, Brown DS, Brown DR, Buchner DM. A randomized study of financial incentives to increase physical activity among sedentary older adults. Preventive Medicine. 2008;47(2):182–187. doi: 10.1016/j.ypmed.2008.05.002. [DOI] [PubMed] [Google Scholar]
- Frank LD, Sallis JF, Saelens BE, Leary L, Cain K, Conway TL, Hess PM. The development of a walkability index: Application to the Neighborhood Quality of Life Study. British Journal of Sports Medicine. 2009 doi: 10.1136/bjsm.2009.058701. Advance online publication. [DOI] [PubMed] [Google Scholar]
- Freedson PS, Miller K. Objective monitoring of physical activity using motion sensors and heart rate. Research Quarterly for Exercise and Sport. 2000;71(2, Suppl. 1):21–29. doi: 10.1080/02701367.2000.11082782. [DOI] [PubMed] [Google Scholar]
- Hair JF, Black WC. Cluster analysis. In: Grimm LG, Yarnold PR, editors. Reading and understanding more multivariate statistics. Washington, DC: American Psychological Association; 2000. pp. 147–205. [Google Scholar]
- Handy SL, Cao X, Mokhtarian PL. The causal influence of neighborhood design on physical activity within the neighborhood: Evidence from Northern California. American Journal of Health Promotion. 2008;22(5):350–358. doi: 10.4278/ajhp.22.5.350. [DOI] [PubMed] [Google Scholar]
- Heath G, Brownson R, Kruger J, Powell KE, Ramsey LT, the Task Force on Community Preventive Services The effectiveness of urban design and land use and transport policies and practices to increase physical activity: A systematic review. Journal of Physical Activity and Health. 2006;3(Suppl. 1):55–76. doi: 10.1123/jpah.3.s1.s55. [DOI] [PubMed] [Google Scholar]
- Hovell MF, Sallis JF, Hofstetter CR, Spry VM, Faucher PF, Caspersen CJ. Identifying correlates of walking for exercise: An epidemiologic prerequisite for physical activity promotion. Preventive Medicine. 1989;18(6):856–66. doi: 10.1016/0091-7435(89)90021-2. [DOI] [PubMed] [Google Scholar]
- Hovell MF, Wahlgren DR, Adams M. The logical and empirical basis for the Behavioral Ecological Model. In: DiClemente RJ, Crosby RA, Kegler MC, editors. Emerging theories and models in health promotion research and practice: Strategies for enhancing public health. San Francisco: Jossey-Bass, Inc.; 2009. pp. 415–450. [Google Scholar]
- Huang L, Stinchcomb DG, Pickle LW, Dill J, Berrigan D. Identifying clusters of active transportation using spatial scan statistics. American Journal of Preventive Medicine. 2009;37(2):157–166. doi: 10.1016/j.amepre.2009.04.021. [DOI] [PMC free article] [PubMed] [Google Scholar]
- Johnson-Kozlow M, Sallis JF, Gilpin EA, Rock CL, Pierce JP. Comparative validation of the IPAQ and the 7-day PAR among women diagnosed with breast cancer. International Journal of Behavioral Nutrition and Physical Activity. 2006;3(7) doi: 10.1186/1479-5868-3-7. [DOI] [PMC free article] [PubMed] [Google Scholar]
- Kendzierski D, DeCarlo KJ. Physical activity enjoyment scale: Two validation studies. Journal of Sport and Exercise Psychology. 1991;13(1):50–64. [Google Scholar]
- Knuth AG, Hallal PC. Temporal trends in physical activity: A systematic review. Journal of Physical Activity and Health. 2009;6(5):548–559. doi: 10.1123/jpah.6.5.548. [DOI] [PubMed] [Google Scholar]
- Lucove JC, Huston SL, Evenson KR. Worker's perceptions about worksite policies and environments and their association with leisure-time physical activity. American Journal of Health Promotion. 2007;21(3):196–200. doi: 10.4278/0890-1171-21.3.196. [DOI] [PubMed] [Google Scholar]
- McGinn T, Wyer PC, Newman TB, Keitz S, Leipzig R, Guyatt G. Tips for learners of evidence-based medicine: Measures of observer variability (kappa statistic) Canadian Medical Association Journal. 2004;171(11):1369–1373. doi: 10.1503/cmaj.1031981. [DOI] [PMC free article] [PubMed] [Google Scholar]
- McIntyre RM, Blashfield RK. A nearest-centroid technique for evaluating the minimum-variance clustering procedur. Multivariate Behavioral Research. 1980;15(2):225–238. doi: 10.1207/s15327906mbr1502_7. [DOI] [Google Scholar]
- Nelson MC, Gordon-Larsen P, Yan S, Popkin BM. Built and social environments: Associations with adolescent overweight and activity. American Journal of Preventive Medicine. 2006;31(2):109–117. doi: 10.1016/j.amepre.2006.03.026. [DOI] [PubMed] [Google Scholar]
- Norman GJ, Velicer WF. Developing an empirical typology for regular exercise. Preventive Medicine. 2003;37(6):635–645. doi: 10.1016/j.ypmed.2003.09.011. [DOI] [PubMed] [Google Scholar]
- Poortinga W. The prevalence and clustering of four major lifestyle risk factors in an English adult population. Preventive Medicine. 2006;44(2):124–128. doi: 10.1016/j.ypmed.2006.10.006. [DOI] [PubMed] [Google Scholar]
- Pratt M, Macera CA, Sallis JF, O'Donnell M, Frank LD. Economic interventions to promote physical activity: Application of the SLOTH model. American Journal of Preventive Medicine. 2004;27(3, Suppl. 1):136–145. doi: 10.1016/j.amepre.2004.06.015. [DOI] [PubMed] [Google Scholar]
- Rzewnicki R, Auweele YV, De Bourdeaudhuij I. Addressing overreporting on the International Physical Activity Questionnaire (IPAQ) telephone survey with a population sample. Public Health Nutrition. 2003;6(3):299–305. doi: 10.1079/PHN2002427. [DOI] [PubMed] [Google Scholar]
- Saelens BE, Handy SL. Built environmental correlates of walking: A review. Medicine and Science in Sports and Exercise. 2008;40(7, Suppl. 1):550–566. doi: 10.1249/MSS.0b013e31817c67a4. [DOI] [PMC free article] [PubMed] [Google Scholar]
- Saelens BE, Sallis JF, Black JB, Chen D. Neighborhood-based differences in physical activity: An environment scale evaluation. American Journal of Public Health. 2003;93(9):1552–1558. doi: 10.2105/AJPH.93.9.1552. [DOI] [PMC free article] [PubMed] [Google Scholar]
- Sallis JF, Bowles HR, Bauman A, Ainsworth BE, Bull FC, Craig CL, Bergman P. Neighborhood environments and physical activity among adults in 11 countries. American Journal of Preventive Medicine. 2009;36(6):484–490. doi: 10.1016/j.amepre.2009.01.031. [DOI] [PubMed] [Google Scholar]
- Sallis JF, Cervero RB, Ascher W, Henderson KA, Kraft KM, Kerr J. An ecological approach to creating active living communities. Annual Review of Public Health. 2006;27:297–322. doi: 10.1146/annurev.publhealth.27.021405.102100. [DOI] [PubMed] [Google Scholar]
- Sallis JF, Grossman RM, Pinski RB, Patterson TL, Nader PR. The development of scales to measure social support for diet and exercise behaviors. Preventive Medicine. 1987;16(6):825–836. doi: 10.1016/0091-7435(87)90022-3. [DOI] [PubMed] [Google Scholar]
- Sallis JF, Johnson MF, Calfas KJ, Caparosa S, Nichols JF. Assessing perceived physical environment variables that may influence physical activity. Research Quarterly for Exercise and Sport. 1997;68(4):345–351. doi: 10.1080/02701367.1997.10608015. [DOI] [PubMed] [Google Scholar]
- Sallis JF, Saelens BE, Frank LD, Conway TL, Slymen DJ, Cain KL, Kerr J. Neighborhood built environment and income: Examining multiple health outcomes. Social Science and Medicine. 2009;68(7):1285–1293. doi: 10.1016/j.socscimed.2009.01.017. [DOI] [PMC free article] [PubMed] [Google Scholar]
- Salomon JA, Nordhagen S, Oza S, Murray CJL. Are Americans feeling less healthy? The puzzle of trends in self-rated health. American Journal of Epidemiology. 2009;170(3):343–351. doi: 10.1093/aje/kwp144. [DOI] [PMC free article] [PubMed] [Google Scholar]
- Shenassa ED, Frye M, Braubach M, Daskalis C. Routine stair climbing in place of residence and body mass index: a pan European population-based study. International Journal of Obesity. 2008;32(3):490–494. doi: 10.1038/sj.ijo.0803755. [DOI] [PubMed] [Google Scholar]
- Stewart AL. The reliability and validity of self-reported weight and height. Journal of Chronic Diseases. 1982;35(4):295–309. doi: 10.1016/0021-9681(82)90085-6. [DOI] [PubMed] [Google Scholar]
- Titze S, Stronegger WJ, Janschitz S, Oja P. Association of built-environment, social environment and personal factors with bicycling as a mode of transportation among Austrian city dwellers. Preventive Medicine. 2008;47(3):252–259. doi: 10.1016/j.ypmed.2008.02.019. [DOI] [PubMed] [Google Scholar]
- Troiano RP, Berrigan D, Dodd KW, Masse LC, Tilert T, McDowell M. Physical activity in the United States measured by accelerometer. Medicine and Science in Sports and Exercise. 2008;40(1):181–188. doi: 10.1249/mss.0b013e31815a51b3. [DOI] [PubMed] [Google Scholar]
- U.S. Department of Health and Human Services, National Center for Health Statistics. National Health Interview Survey [Computer file] Ann Arbor, MI: Inter-university Consortium for Political and Social Research [distributor]; 1989. p. 1991. [Google Scholar]
- Ward JH. Journal of the American Statistical Association. 301. Vol. 58. 1963. Hierarchical grouping to optimize an objective function; pp. 236–244. [DOI] [Google Scholar]
- Welk GJ. Use of accelerometry-based activity monitors to assess physical activity. In: Welk GJ, editor. Physical activity assessments for health-related research. Champaign, IL: Human Kinetics; 2002. pp. 125–142. [Google Scholar]
- Wen M, Zhang X. Contextual effects of built and social environments of urban neighborhoods on exercise: A multilevel study in Chicago. American Journal of Health Promotion. 2009;23(4):247–254. doi: 10.4278/ajhp.07052448. [DOI] [PubMed] [Google Scholar]
- Wing RR, Epstein LH, Ossip DJ, LaPorte RE. Reliability and validity of self-report and observers' estimates of relative weight. Addictive Behaviors. 1979;4(2):133–140. doi: 10.1016/0306-4603(79)90047-9. [DOI] [PubMed] [Google Scholar]
- Wing RR, Jeffery RW. Benefits of recruiting participants with friends and increasing social support for weight loss and maintenance. Journal of Consulting and Clinical Psychology. 1999;67(1):132–138. doi: 10.1037/0022-006X.67.1.132. [DOI] [PubMed] [Google Scholar]
- Zabinski MF, Norman GJ, Sallis JF, Calfas KJ. Patterns of sedentary behavior among adolescents. Health Psychology. 2007;26(1):113–120. doi: 10.1037/0278-6133.26.1.113. [DOI] [PubMed] [Google Scholar]