Abstract
Autophagy is a lysosome-dependent cellular catabolic mechanism that mediates the turnover of intracellular organelles and long-lived proteins. Reduced autophagic activity has been shown to lead to the accumulation of misfolded proteins in neurons and might be involved in chronic neurodegenerative diseases. Here, we uncover an essential role for the syntaxin-5 SNARE complex in autophagy. Using genetic knockdown, we show that the syntaxin-5 SNARE complex regulates the later stages of autophagy after the initial formation of autophagosomes. This SNARE complex acts on autophagy by regulating ER-to-Golgi transport through the secretory pathway, which is essential for the activity of lysosomal proteases such as cathepsins. Depletion of syntaxin-5 complex components results in the accumulation of autophagosomes as a result of lysosomal dysfunction, leading to decreased degradation of autophagic substrates. Our findings provide a novel link between a fundamental process such as intracellular trafficking and human diseases that might be affected by defective biogenesis and/or homeostasis of the autophagosome–lysosome degradation system.
Keywords: Autophagy, Snare proteins, Early secretory pathway, Lysosomal compartment activity
Introduction
Macroautophagy, hereafter referred to as autophagy, is an intracellular bulk degradation process by which long-lived cytoplasmic proteins, protein complexes and entire organelles are degraded through a lysosome-dependent pathway. Autophagy involves the sequestration of cytoplasmic components and intracellular organelles within a double-membrane vesicle, the autophagosome. Ultimately, the outer membrane of autophagosome fuses with the lysosome, and sequestered components are thereby delivered to the lysosome for degradation by lysosomal enzymes (Levine and Klionsky, 2004).
Autophagy is essential for maintaining homeostatic processes, such as organelle and protein turnover, but it is also crucial in responses to stress conditions such as nutrient deprivation, oxidative stress, pathogen infection and hypoxia (Rubinsztein et al., 2007; Mizushima et al., 2008). Deregulation of autophagy has been implicated in a wide range of pathologies, including cancer, myopathies, infectious and neurodegenerative diseases (Rubinsztein et al., 2007; Mizushima et al., 2008).
Autophagy is a highly conserved process. Several autophagy-related (Atg) genes have been identified in yeast (Suzuki and Ohsumi, 2007) and homologues of these genes have been found in mammals (Yoshimori and Noda, 2008). The only known mammalian protein that specifically associates with autophagosome membranes is microtubule-associated protein 1 (MAP1) light chain 3 (LC3), the mammalian orthologue of yeast Atg8. LC3 normally exists in the cytosol as LC3-I. Upon autophagy induction, LC3-I conjugates with phosphatidylethanolamine to form the autophagosome-associated LC3-II (Kabeya et al., 2000). LC3-II levels (compared with actin or tubulin loading controls) correlate with autophagosome numbers (Klionsky et al., 2007; Klionsky et al., 2008; Rubinsztein et al., 2009). A number of genes that regulate autophagy have been identified, and the majority of these autophagy-related genes appear to function at the initial steps of autophagosome formation (Rubinsztein et al., 2007).
Autophagy requires many different membrane fusion steps, including endosome–autophagosome (forming amphisomes) and autophagosome–lysosome fusions. In general, such fusion steps require Soluble N-ethylmaleimide-sensitive factor attachment protein (SNAP) receptors (SNAREs) (Fader et al., 2009; Furuta et al., 2010). SNAREs have a pivotal role in membrane fusion of transport vesicles with an acceptor compartment (Jahn and Scheller, 2006). In mammalian cells, there are at least 36 SNARE members that are localised in different membrane compartments (Hong, 2005).
Depending on their function and localisation on two opposing membranes, i.e. vesicles and target membranes, SNAREs can be classified into vesicle (v)-SNARE and target membrane (t)-SNARE, respectively (Söllner et al., 1993). Alternatively, SNAREs are categorised as R-SNAREs and Q-SNAREs, because of the presence of Arg and Gln residues, respectively, in the core binding domains of the four SNARE motifs (Fasshauer et al., 1998). Most SNAREs contain a single SNARE motif (a coiled-coil domain of 60–70 amino acids), which is followed by a C-terminal transmembrane domain (TMD) (Weimbs et al., 1997). Zippering of four SNARE motifs, one provided by vesicles and three by the target membrane (Sutton et al., 1998), seems to overcome the energy barrier and trigger membrane fusion (Weber et al., 1998; McNew et al., 2000).
Here, as a result from an ongoing RNA-interference-based screen, we have uncovered an essential role for the syntaxin-5 SNARE complex components (Hay et al., 1997) as positive regulators of autophagy. The syntaxin-5 SNARE complex, which also contains Sec22B, Bet1, GS27 and Ykt6 and one Sec1–Munc18 (SM) protein, Sly1 (Dascher and Balch, 1996), regulates the early secretory pathway of eukaryotic cells at the level of endoplasmic reticulum (ER) to Golgi transport (Hay et al., 1997; Zhang et al., 1999). Newly synthesised proteins acquire their native conformation in the endoplasmic reticulum (ER), where an efficient quality control system operates so that only correctly folded molecules are able to exit the ER and reach their final destination (Palade, 1975; Gething and Sambrook, 1992; Ellgaard and Helenius, 2003). Our data suggest that the syntaxin-5 SNARE complex regulates the later stages of autophagy by controlling ER-to-Golgi (anterograde) transport and therefore the activity of lysosomal proteases such as cathepsins.
Results
Sec22B knockdown impairs clearance of autophagic substrates
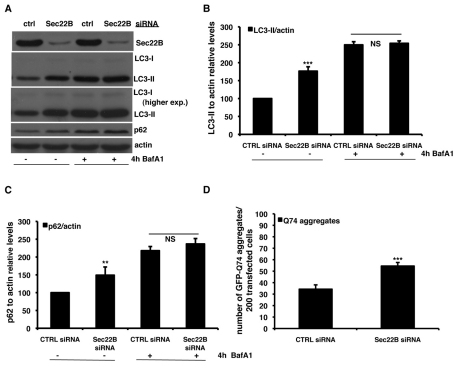
To investigate the potential relationship between the early secretory pathway and autophagy, we used siRNAs targeting several SNARE proteins that regulate ER-to-Golgi trafficking. Knockdown of Sec22B, a component of both the syntaxin-5 and syntaxin-18 SNARE complexes (Hay et al., 1997; Zhang et al., 1999), increased the steady-state levels of the LC3-II protein, which correlates with the number of autophagosomes (Klionsky et al., 2007; Klionsky et al., 2008; Rubinsztein et al., 2009) (Fig. 1A,B). An increase in LC3-II levels can be either due to increased autophagosome formation or a block in autophagosome maturation. The latter can be due to a block in autophagosome–lysosome fusion or lysosomal degradation. To test whether Sec22B knockdown induced autophagosome synthesis, we clamped the LC3-II autophagosome degradation using a saturating concentration of the lysosomal proton pump inhibitor Bafilomycin A1 (Sarkar et al., 2007). In Bafilomycin-A1-treated cells, siRNA against Sec22B caused no further increase in LC3-II levels, compared with control siRNA-transfected cells (Fig. 1A,B). Thus, Sec22B knockdown impairs autophagosome LC3-II degradation. Consistent with our data suggesting that Sec22B knockdown affected LC3-II degradation, this treatment also resulted in the accumulation of the endogenous autophagy substrate p62 (Korolchuck et al., 2009), an effect that was lost when autophagy was blocked with Bafilomycin A1 (Fig. 1C). Likewise, knockdown of Sec22B enhanced the accumulation of GFP–Q74, a mutant huntingtin fragment associated with Huntington disease that is also an autophagy substrate (Fig. 1D). The percentage of cells with such mutant huntingtin aggregates increases linearly with its expression levels (Narain et al., 1999) and this is also seen when autophagy is blocked (Ravikumar et al., 2002) (Fig. 1D). Overexpression of Sec22B did not affect LC3-II levels or the accumulation of GFP–Q74 in aggregates (supplementary material Fig. S1A-C).
Fig. 1.
Knockdown of Sec22B impairs autophagic flux. (A–C) HeLa cells were transfected for 72 hours with 20 nM of control siRNA or siRNA against Sec22B. For the assessment of autophagy by LC3-II levels, a saturating concentration (400 nM) of Bafilomycin A1 (Calbiochem) was added to the cells in the last 4 hours before harvesting. The graphs in B and C report the quantitative analysis of LC3-II and p62 levels relative to actin in three independent experiments performed at least three times in triplicate. The P values for the densitometric analyses were determined by factorial ANOVA test using STATVIEW v4.53 (Abacus Concepts), where the control condition was set to 100. The y-axis values are shown as a percentage and the error bars denote s.e.m. (n=3; ***P<0.001; **P<0.01; NS, non-significant). (D) HeLa cells seeded on glass coverslips were transfected for 96 hours with 20 nM of either anti-Sec22B or control siRNA. In the last 48 hours, cells were retransfected with the same siRNA mix plus 2 μg of the GFP–HD74 expression vector. The P values for assessing aggregation of EGFP–HDQ74 were determined using Student's t-test (n=3; ***P<0.001).
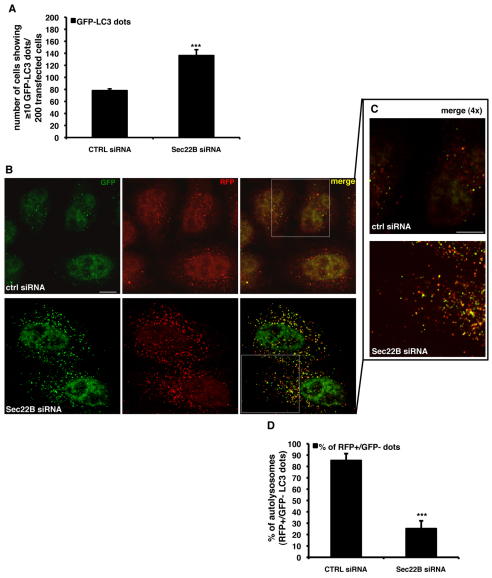
To further investigate the mechanisms whereby Sec22B knockdown impaired autophagosome degradation, we assayed LC3-II vesicle formation in HeLa cells. Consistent with our western blotting data, knockdown of Sec22B increased the number of GFP–LC3 vesicles (Fig. 2A). To investigate whether these vesicles were autophagosomes or autolysosomes, we examined HeLa cells stably expressing an RFP-GFP/LC3 reporter (Kimura et al., 2007; Sarkar et al., 2009). Owing to the vastly different pKa values of the two fluorescent proteins, this construct can be used as a probe for autophagosome maturation. At physiological pH, i.e. in newly formed autophagosomes, both proteins are stable, leading to both red and green fluorescence. Upon acidification, i.e. fusion with the lysosome, green fluorescence is rapidly lost because of the high pKa of GFP, and only red fluorescence remains (Kimura et al., 2007). Knockdown of Sec22B led to a decrease in the proportion of vesicles that were only red (Fig. 2B–D), indicating either a decrease in autophagosome–lysosome fusion or a decrease in LC3-II degradation (or GFP destabilisation) in the lysosomal compartment. To discriminate between these two possibilities, cells were co-transfected with mCherry-LC3 (mCherry is a red fluorescent protein) (Jahreiss et al., 2008; Jahreiss et al., 2009) and GFP–lgp120, the rat homologue of LAMP-1, a commonly used lysosomal marker, which is mainly localised to the limiting membranes of lysosomes and late endosomes (Fukuda, 1991). Compared with control cells, knockdown of Sec22B increased the number of double-positive vesicles, i.e. autophagolysosomes (supplementary material Fig. S2A–C). These data suggest that knockdown of Sec22B does not inhibit autophagosome–lysosome fusion, but rather reduces LC3-II turnover, leading to accumulation of LC3 and other autophagy substrates (we cannot exclude the unlikely possibility that the autophagosomes and lysosomes are in close enough proximity to enable colocalisation of the LC3 and LAMP-1 in the absence of any contents exchange).
Fig. 2.
Knockdown of Sec22B increases autophagosome numbers. (A) HeLa cells were seeded on glass coverslips and transfected for 72 hours with 20 nM of either anti-Sec22B or control siRNA. In the last 24 hours, cells were retransfected with the same siRNA mix plus 0.5 μg of the GFP–LC3 construct. Cells were finally fixed and analysed under fluorescence microscope. The P values for assessing the number of GFP–LC3 dots were determined using Student's t-test (n=3; ***P<0.001). (B,C) HeLa cells stably expressing the mRFP-GFP/LC3 construct were seeded on glass coverslips and transfected for 72 hours with 20 nM of either anti-Sec22B or control siRNA. After 72 hours, cells were fixed and analysed by confocal microscopy. 4× magnifications of the merged channels (insets from A) are shown in B. (D) The P values for assessing the number of LC3-II-positive autolysosomes were determined using Student's t-test (n=3; ***P<0.001). Scale bars: 10 μm.
Sly1 knockdown exerts dual effects on the autophagic pathway
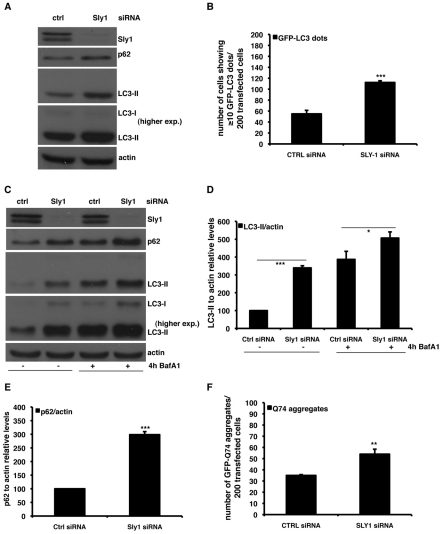
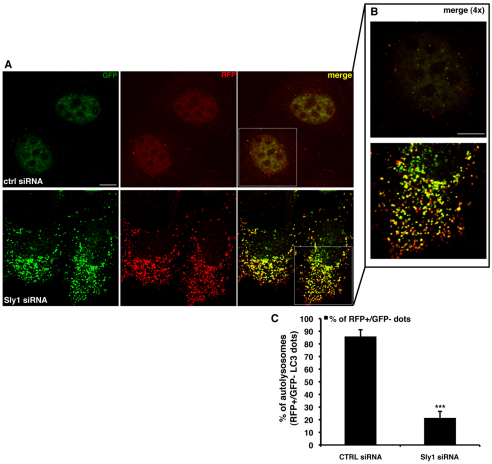
To test whether similar effects were mediated by partner proteins of the syntaxin-5 SNARE complex, we examined Sly1, an SM protein that acts as a modulator of the syntaxin-5 SNARE complex (Dascher and Balch, 1996). LC3-II levels were increased after knockdown of Sly1 (Fig. 3A,B). In Bafilomycin-A1-treated cells, Sly1 knockdown increased LC3-II levels, suggesting that there was an induction of autophagosome synthesis (Fig. 3C,D). However, these phenomena were associated with an accumulation of the endogenous autophagic substrates p62 and GFP–Q74 (Fig. 3E,F). This scenario might result if there is an induction of autophagosome synthesis, as well as impaired degradation of autophagic substrates. We investigated this possibility using the RFP-GFP/LC3 cell line and found that knockdown of Sly1 dramatically impaired the transition of GFP–RFP/LC3-positive autophagosomes to RFP-positive, GFP-negative autolysosomes (Fig. 4A–C). When we assessed the colocalisation of LC3-II and lgp120, we observed that knockdown of Sly1 caused a clear redistribution of the GFP–lgp120 protein (with a morphology reminiscent of ER distribution, which we have considered later), strongly suggesting impaired intracellular transport of the overexpressed lgp120 protein (supplementary material Fig. S2A–C).
Fig. 3.
Knockdown of Sly1 increases autophagosome numbers. (A) HeLa cells were transfected for 72 hours with 20 nM of either anti-Sly1 or control siRNA. The western blot panels reporting the effect of knockdown of Sly1 on the LC3-II, p62 and Sly1 levels are representative of at least three independent experiments performed in triplicate. (B) HeLa cells were seeded on glass coverslips and transfected for 72 hours with 20 nM of either anti-Sly1 siRNA or control siRNA. In the last 24 hours, cells were retransfected with the same siRNA mixture plus 0.5 μg of the GFP–LC3 construct. Cells were finally fixed and analysed under fluorescence microscope. The P values for assessing the number of GFP–LC3 dots were determined using Student's t-test (n=3; ***P<0.001). (C–E) HeLa cells were transfected for 72 hours with 20 nM of either anti-Sly1 or control siRNA. For the assessment of autophagy by LC3-II levels, a saturating concentration (400 nM) of Bafilomycin A1 (Calbiochem) was added to the cells in the last 4 hours before harvesting. The graphs in D and E show the quantitative analysis of LC3-II and p62 levels relative to actin from independent experiments performed at least three times in triplicate. The P values for the densitometric analyses were determined by factorial ANOVA test using STATVIEW v4.53 (Abacus Concepts), where the control condition was set to 100. The y-axis values are shown in percentage and the error bars denote s.e.m. (n=3; ***P<0.001; *P<0.05; NS, non-significant). (F) HeLa cells seeded on glass coverslips were transfected for 96 hours with 20 nM of either anti-Sly1 siRNA or control siRNA. In the last 48 hours, cells were re-transfected with the same siRNA mix plus 2 μg of the GFP–HD74 expression vector. The P values for assessing EGFP–HDQ74 aggregation were determined using Student's t-test (n=3; **P<0.01).
Fig. 4.
Knockdown of Sly1 impairs autophagic flux. (A,B) HeLa cells stably expressing the mRFP-GFP/LC3 construct were seeded on glass coverslips and transfected for 72 hours with 20 nM of either control or anti-Sly1 siRNA. After 72 hours, cells were fixed and analysed by confocal microscope. 4× magnifications of the merged channels (insets from A) are shown in B. (C) The P values for assessing the number of LC3-II-positive autophagosomes and autolysosomes were determined using Student's t-test (n=3; ***P<0.001; **P<0.01). Scale bars: 10 μm.
Such impaired transport out of the ER would be predicted to induce an ER stress response, which is known to induce autophagosome synthesis (Bernales et al., 2006; Yorimitsu et al., 2006). Indeed, by western blot analysis, Sly1 (but not Sec22B) knockdown increased the levels of the ER-resident chaperone Bip/grp78 (supplementary material Fig. S3A), which is a classical marker and regulator of the ER stress response (Kaufman, 1999). We confirmed this evidence by measuring the activity of the Bip/grp78 promoter with a luciferase reporter assay (supplementary material Fig. S3B). Thus, the induction of LC3-II formation after knockdown of Sly1 can be attributed to induction of the ER stress response. As we observed for Sec22B, Sly1 overexpression did not modulate the autophagic pathway (supplementary material Fig. S4A–C).
Knockdown of syntaxin-5 impairs clearance of autophagic substrates
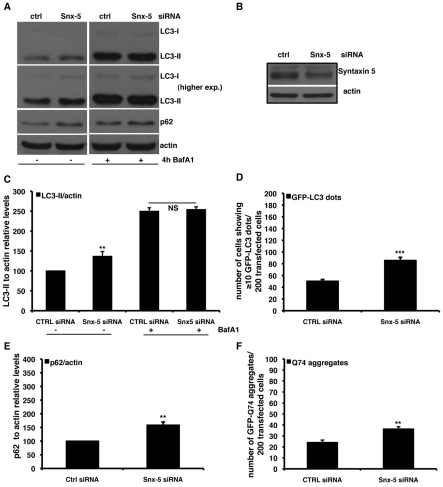
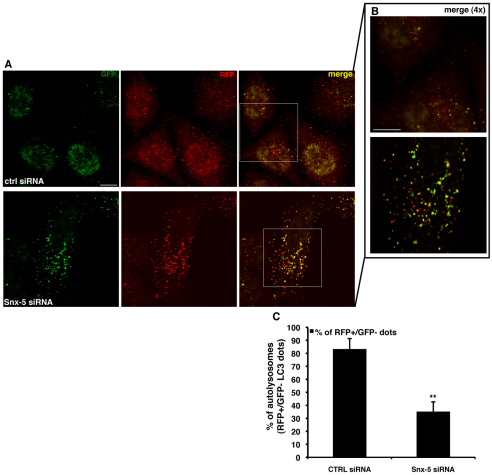
We then investigated the role of another member of the syntaxin-5 complex by knocking down the syntaxin-5 protein. Similarly to knockdown of Sec22B and Sly1, knockdown of syntaxin-5 was also associated with decreased LC3-II degradation, because LC3-II levels were increased by syntaxin-5 knockdown in the absence of Bafilomycin A1, but did not change in the presence of Bafilomycin A1 (Fig. 5A–C). Consistent with these data, syntaxin-5 depletion caused the accumulation of GFP–LC3 dots and the autophagy substrates p62 and GFP–Q74 (Fig. 5D–F). Using the RFP-GFP/LC3 stable cell line, we found that even upon syntaxin-5 knockdown, the transition of autophagosomes to autolysosomes was impaired (Fig. 6A–C). Furthermore, we observed that knockdown of syntaxin-5 caused an increased colocalisation of LC3-II with GFP–lgp120, strongly suggesting a reduced turnover of the autophagosomes delivered to the lysosomal compartment (supplementary material Fig. S2A–C). Finally, as we observed with Sec22B and Sly1, overexpression of syntaxin-5 did not affect autophagy (supplementary material Fig. S5A–C).
Fig. 5.
Knockdown of syntaxin-5 impairs LC3-II degradation. (A–C,E) HeLa cells were transfected for 72 hours with 20 nM of either control or anti-syntaxin-5 siRNA. For the assessment of autophagy by LC3-II levels, a saturating concentration (400 nM) of Bafilomycin A1 (Calbiochem) was added to the cells in the last 4 hours before harvesting. The graphs in C and E show the quantitative analysis of LC3-II and p62 levels relative to actin in independent experiments performed at least three times in triplicate. The P values for the densitometric analyses were determined by factorial ANOVA test using STATVIEW v4.53 (Abacus Concepts), where the control condition was set to 100. The y-axis values are shown in percentage and the error bars denote s.e.m. (n=3; **P<0.01; NS, non-significant). (D) HeLa cells were seeded on glass coverslips and transfected for 72 hours with 20 nM of either anti-syntaxin-5 siRNA or control siRNA. In the last 24 hours, cells were re-transfected with the same siRNA mix plus 0.5 μg of the GFP–LC3 construct. Cells were finally fixed and analysed under fluorescence microscope. The P values for assessing the number of GFP–LC3 dots were determined using Student's t-test (n=3; ***P<0.001). (F) HeLa cells seeded on glass coverslips were transfected for 96 hours with 20 nM of either anti-syntaxin-5 siRNA or control siRNA. In the last 48 hours, cells were retransfected with the same siRNA mix plus 2 μg of the GFP–HD74 expression vector. The P values for assessing EGFP–HDQ74 aggregation were determined using Student's t-test (n=3; **P<0.01).
Fig. 6.
Knockdown of syntaxin-5 impairs autophagic flux. (A,B) HeLa cells stably expressing the mRFP-GFP/LC3 construct were seeded on glass coverslips and transfected for 72 hours with 20 nM of either control or anti-syntaxin-5 siRNA. After 72 hours, cells were fixed and analysed by confocal microscope. 4× magnifications of the merged channels (insets from A) are shown in B. (C) The P values for assessing the number of LC3-II positive autophagosomes and autolysosomes were determined using Student's t-test (n=3; ***P<0.001; **P<0.01). Scale bars: 10 μm.
Inhibition of the syntaxin-5 SNARE complex activity does not impair the fusion of autophagosomes with the lysosomal compartment
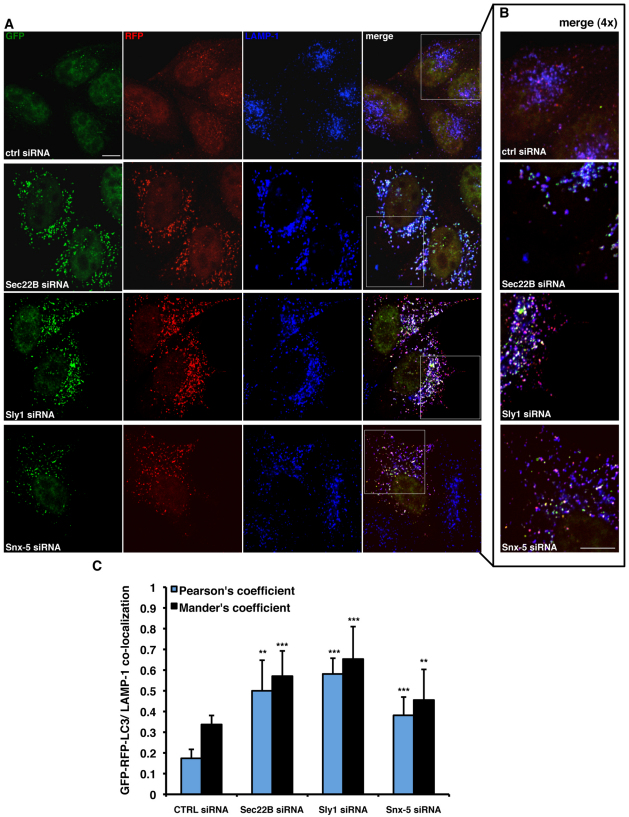
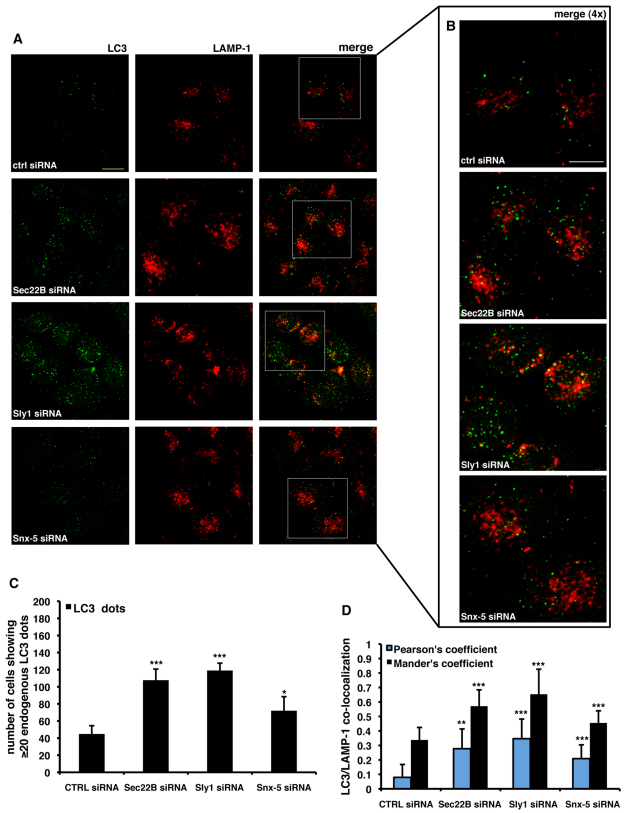
To provide further support for our data suggesting that depletion of the syntaxin-5 complex does not directly affect autophagosome–lysosome fusion, we analysed the effect of syntaxin-5 complex depletion by looking at endogenous autophagosome and/or lysosome markers using immunofluorescence. First, we knocked down syntaxin-5 complex members in GFP-RFP/LC3 stably transfected HeLa cells (where LC3 overexpression is at low enough levels to preclude aggregation). The lysosomal compartment was stained with an anti-LAMP-1 antibody (Fig. 7A,B). There was a consistent increase in the fraction of the fluorescent LC3 reporter that colocalised with the endogenous LAMP-1 protein (Fig. 7C). In the second approach, we performed knockdown experiments in HeLa cells that were then immunostained for both endogenous LC3 and LAMP-1 (Fig. 8A,B). Consistent with our previous data, we found that depletion of any of the syntaxin-5 SNARE complex members caused a statistically significant increase in the number of cells showing intracellular LC3 dots (Fig. 8C). Furthermore, we were able to confirm increased colocalisation of LC3-positive structures with the lysosomal compartment upon depletion of the syntaxin-5 SNARE complex components (Fig. 8D). Taken together, these data suggest that the activity of the syntaxin-5 SNARE complex activity is required to guarantee the proper degradation of LC3-II and other autophagy substrates within the lysosomal compartment. However, the accumulation of LC3 and the reduced autophagosome turnover is not simply due to impaired autophagosome–lysosome fusion in this context.
Fig. 7.
Knockdown of syntaxin-5 complex members increases LC3 and LAMP-1 colocalisation. (A,B) HeLa cells stably expressing the mRFP-GFP/LC3 construct were seeded on glass coverslips and transfected for 72 hours with 20 nM of control, anti-Sec22B, anti-Sly1 or anti-syntaxin-5 siRNA. After 72 hours, cells were fixed, made permeable in methanol, stained with an anti-LAMP-1 specific antibody, and finally analysed by confocal microscope. 4× magnifications of the merged channels are shown in B. (C) Quantification of GFP-RFP/LC3 colocalisation with endogenous LAMP-1. The analysis was performed using an ImageJ plug-in (JaCoP). The graph shows the Pearson's correlation (blue bars) and the Mander's colocalisation coefficient (fraction of LC3-positive structures overlapping LAMP-1-positive structures; black bars). The P values for assessing the GFP-RFP/LC3 and endogenous LAMP-1 colocalisation were determined using Student's t-test (n=10; ***P<0.001; **P<0.01). Scale bars: 10 μm.
Fig. 8.
Knockdown of syntaxin-5 complex components increases colocalisation of endogenous LC3 with LAMP-1. (A,B) HeLa cells were seeded on glass coverslips and transfected for 72 hours with 20 nM of control, anti-Sec22B, anti-Sly1 or anti-syntaxin-5 siRNA. After 72 hours, cells were fixed, made permeable in methanol, stained with anti-LC3 and anti-LAMP-1 specific antibodies, and finally analysed by confocal microscope. 4× magnifications of the merged channels are shown in panel B. (C) 200 cells per experimental condition were analysed under fluorescence microscope and number of endogenous LC3 dots were scored in a blinded fashion. The P values for assessing the number of cells showing more than 20 LC3 dots/cell were determined using Student's t-test (n=3; ***P<0.001; **P<0.05). (D) Quantification of colocalisation between endogenous LC3-II and LAMP-1. The analysis was performed using the JaCoP ImageJ plugin. The graph reports the Pearson's correlation (light blue bars) and the Mander's co-localisation coefficient (fraction of LC3 positive structures overlapping LAMP-1 positive structures; black bars). The P values for assessing the endogenous LC3-II and LAMP-1 colocalisation were determined using Student's t-test (n=10; ***P<0.001; **P<0.01). Scale bars: 10 μm.
Reduced anterograde transport of lysosomal proteases accounts for the reduced degradation of autophagic substrates upon inhibition of the syntaxin-5 SNARE complex
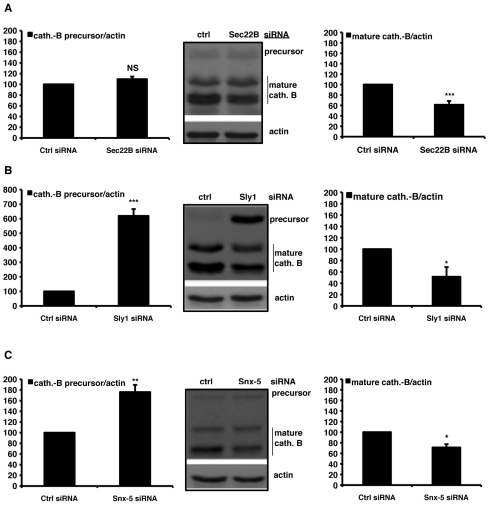
Because knockdown of syntaxin-5 SNARE complex components does not appear to effect autophagosome–lysosome fusion, we aimed to provide a molecular explanation for the observed phenotype of cells depleted of the syntaxin-5 complex. Lysosomes are the major site of intracellular catabolic processes. Many lysosomal storage disorders are the result of defects in specific hydrolases. Moreover, there are also several diseases that apparently affect the transport machinery for lysosomes (Aridor and Hannan, 2000). As the syntaxin-5 SNARE complex depletion appears to influence the degradation of LC3-II, we tested whether it could affect the transport of cathepsin B, a typical lysosomal cysteine protease (Mach et al., 1994). Indeed, knockdown of either syntaxin-5, Sec22B or Sly1 all decreased the relative level of mature, processed cathepsin B (Fig. 9A–C). These effects would be consistent with impaired delivery of the precursor from the ER, via the Golgi, to the lysosomes. This hypothesis was supported by our observation of a massive accumulation of the cathepsin B precursor in Sly1-depleted cells, although accumulation of the precursor was mild or barely detectable in syntaxin-5-depleted cells (Fig. 9C) and was not detectable at all in Sec22B-depleted (Fig. 9A) cells. Furthermore, knockdown of the syntaxin-5 complex components affected the maturation of two other lysosomal proteases, namely cathepsin D and cathepsin L (supplementary material Fig. S6). We were able to reproduce our key findings in another cell line, using HuH7 human hepatoma cells. In HuH7 cells, inhibition of the syntaxin-5 SNARE complex also impaired autophagic activity, leading to reduced turnover of LC3-II and accumulation of autophagy substrates, which were associated with a concomitant reduction of the cathepsin B, D and L mature isoforms (supplementary material Fig. S7A–F). However, unlike the situation in HeLa cells, Sly1 depletion did not overtly increase levels of the cathepsin precursors in HuH7 cells, although this might be due to different trafficking or degradation kinetics between the cell lines.
Fig. 9.
Knockdown of syntaxin-5 SNARE complex components affects cathepsin maturation. (A–C) HeLa cells were transfected for 72 hours with 20 nM of anti-Sec22B (A), anti-Sly1 (B) or anti-syntaxin-5 (C) siRNA and the effect on cathepsin B processing, relative to cells transfected with control siRNA was assessed by western blot analysis. The graphs report the quantitative analysis of both precursor and mature forms of cathepsin B relative to actin obtained from independent experiments performed three times in triplicate. The P values for the densitometric analyses were determined by factorial ANOVA test using STATVIEW v4.53 (Abacus Concepts), where the control condition was set to 100. The y-axis values are shown in percentage and the error bars denote s.e.m. (n=3; ***P<0.001; **P<0.01; *P<0.05; NS, non-significant).
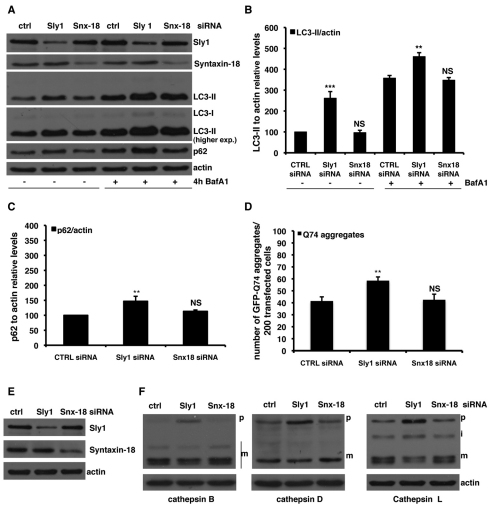
Finally, because many of the syntaxin-5 SNARE complex components, such as Sec22B and Sly1, can also be assembled to constitute the syntaxin-18 SNARE complex, which is involved in the Golgi-to-ER retrograde transport (Lewis and Pelham, 1996), we investigated the effects on autophagy of selective knockdown of syntaxin-18. Interestingly, syntaxin-18 knockdown did not affect autophagy, autophagy substrate levels (Fig. 10A–D) or cathepsin maturation (Fig. 10E,F).
Fig. 10.
Knockdown of syntaxin-18 does not affect autophagy. (A–C) HeLa cells were transfected for 72 hours with 20 nM of siRNA against syntaxin-18 or Sly1, or control siRNA. For the assessment of autophagy by LC3-II levels, a saturating concentration (400 nM) of Bafilomycin A1 was added to the cells in the last 4 hours before harvesting. The graphs in B and C show the quantitative analysis of LC3-II and p62 levels relative to actin in independent experiments performed at least three times in triplicate. The P values for the densitometric analyses were determined by factorial ANOVA test using STATVIEW v4.53 (Abacus Concepts), where the control condition was set to 100. The y-axis values are shown in percentage and the error bars denote s.e.m. (n=3; ***P<0.001; **P<0.01; NS, non-significant). (D) HeLa cells seeded on glass coverslips were transfected for 96 hours with 20 nM of anti-syntaxin-18, anti-Sly1 or control siRNA. In the last 48 hours, cells were retransfected with the same siRNA mix plus 2 μg of the GFP–HD74 expression vector. The P values for assessing EGFP–HDQ74 aggregation were determined using Student's t-test (n=3; **P<0.01; NS, non-significant). (E,F) HeLa cells were transfected for 72 hours with either anti-syntaxin-18, anti-Sly1 or control siRNA. The effect exerted by knockdown of syntaxin-18, Sly1 protein levels (E) and processing of cathepsin B, D and L (F), was assessed by western blot analysis. The blots reported are representative of three independent experiments. p, pro form of cathepsin; m, mature form of cathepsin; i, intermediate form (for cathepsin L).
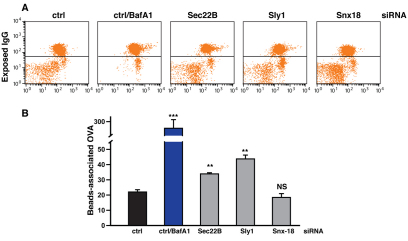
Fluorogenic protease substrates represent a useful tool to measure lysosome-dependent proteolysis (Perez-Victoria et al., 2010). To directly test the effect of disruption of the syntaxin-5 SNARE complex on the activity of the lysosomal compartment, we used a highly sensitive and quantitative assay to measure the time-dependent loss of surface-bound ovalbumin from internalised fluorescent latex beads (Savina et al., 2006). After knocking down the relevant genes, HeLa cells were transiently transfected with a Fcγ-RI-γ immunoglobulin receptor to allow ovalbumin internalisation and subsequent measurement of lysosomal-dependent degradation by FACS analysis (Fig. 11A,B). In these experiments, incubation with Bafilomycin A1 was used as an internal positive control (for further details, see the Materials and Methods and supplementary material Fig. S8A–C). Consistent with the biochemical analysis of cathepsin processing, we observed a strong reduction in the degradation activity of the lysosomal compartment in cells depleted of Sly1, Sec22B (Fig. 10B), and albeit to a lesser extent, syntaxin-5 (supplementary material Fig. S8C).
Fig. 11.
Knockdown of Sec22B or Sly1 impairs lysosomal degradative activity. (A,B) HeLa cells were transfected for 96 hours with with 20 nM of siRNA against Sec22B, Sly1, syntaxin-18 or control siRNA. In the last 48 hours, cells were retransfected with the same siRNA mix plus 1 μg of the Fcγ-RI-γ expression vector. To allow phagocytosis of IgG-coated beads, transfected HeLa cells were incubated (1 hour; 37°C) with fluorescent beads (Polysciences) covalently conjugated with human polyclonal IgG and ovalbumin (OVA), thoroughly washed and then incubated for a further 24 hours to permit degradation of internalised beads. Cells were then placed at 4°C to prevent internalisation, stained with an anti-human-IgG antibody (Jackson ImmunoResearch) to mark non-internalised beads and then fixed. Internalised beads were subsequently recovered by cell disruption and then incubated with OVA-specific FITC-conjugated antibody (Abcam). The amount of remaining bead-associated OVA was finally quantified by flow cytometry. As an internal standard, treatment of control siRNA transfected cells with BafA1 significantly reduced OVA degradation (blue bar). The P values for the rate of degradation of OVA-coated beads were determined using Student's t-test on three independent experiments performed in triplicate (n=3; ***P<0.001; **P<0.01; *P<0.05; NS, non-significant).
Discussion
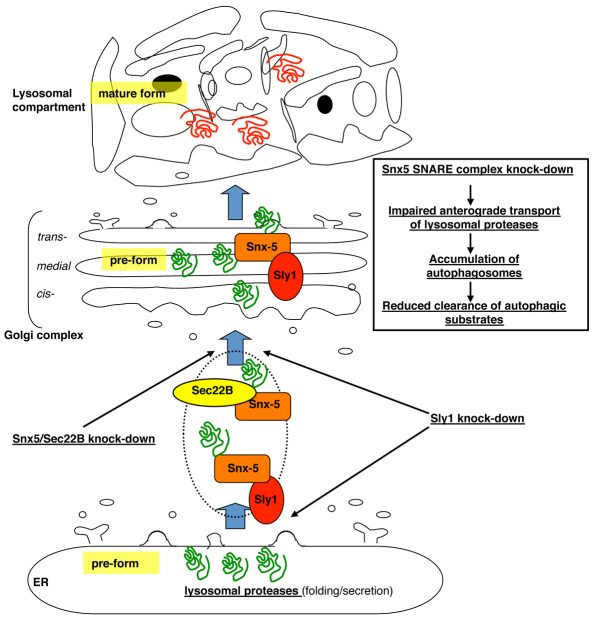
Our results provide a novel link between two fundamental processes in eukaryotic cells, namely, the early secretory pathway and the autophagosome–lysosome degradation system. We report that the activity of the syntaxin-5 SNARE complex is required for the clearance of autophagic substrates. In particular, as summarised in Fig. 12, the syntaxin-5 complex positively regulates anterograde transport and the proper maturation of lysosomal proteases. As a consequence, its depletion has a number of downstream consequences on several processes, including the autophagic pathway, which depends on lysosomal activity. Accordingly, the syntaxin-5 complex is a positive regulator of late-stage autophagy and is required for an efficient flux through this pathway. It is becoming increasingly clear that, whereas GFP–LC3 and other early autophagy markers are useful for monitoring autophagosome formation, additional assays are required to monitor the flux of substrates through the autophagy pathway. It has already been reported by us and other researchers that a large number of compounds, despite increasing the steady-state levels of GFP–LC3-II, fail to increase the degradation of proteins by autophagy (Zhang et al., 2007; Jahreiss et al., 2009). An increase in levels of LC3-II can have two possible causes: either increased autophagosome formation or a block in autophagosome maturation or degradation. Furthermore, the latter could be due to a block in autophagosome–lysosome fusion or lysosomal degradation. Here, we have shown with a range of assays, including analysis of LC3-II synthesis (in the presence of Bafilomycin A1), studies of the autophagic flux by means of the GFP-RFP/LC3 construct and with assays of both endogenous (p62) and exogenous (GPP–HDQ74) autophagic substrate accumulation and degradation, that depletion of the syntaxin-5 SNARE complex primarily acts to decrease autophagic flux by impairing lysosomal proteases. This leads to an increase in LC3 vesicles, a block in degradation of autophagic cargoes and, as a consequence, increased levels of autophagic substrates. Furthermore, loss of the syntaxin-5 SNARE complex does not appear to impair the fusion of autophagosomes with lysosomes. Nonetheless, it is worth mentioning that LAMP-1 has been shown to be present on structures of the endosomal compartment (Fukuda, 1991). We cannot therefore rule out the possibility that the increased colocalisation between LC3-II- and LAMP-1-positive structures might, to some extent, be a consequence of a reduced amphisome–lysosome fusion. Thus, with the exception of the dual effect we observed in Sly1-depleted cells (i.e. increased autophagosome synthesis and concomitant reduced clearance of autophagic substrates), we found that the accumulation of autophagic substrates upon depletion of the syntaxin-5 complex is due to the impaired turnover rather than the increased biogenesis of autophagosomes. Interestingly, our model showing a tight dependency between the intracellular transport machinery and the activity of the autophagosome–lysosome system is consistent with a recently published paper providing a molecular link between autophagy, lysosomal proteolysis and pathogenesis of Alzheimer's disease (Lee et al., 2010). Indeed, the authors show that mutations in the gene encoding presenilin-1, which cause early-onset AD disease, compromise autophagosome and lysosome fusion as a result of a selective impairment of anterograde transport of the v-ATPase V0a1 subunit. This leads to reduced cathepsin activity (Lee et al., 2010). However, the overexpression of the syntaxin-5 SNARE complex components had no obvious effects either on LC3-II synthesis or on the clearance of autophagic substrates, suggesting that the levels of these components are normally saturating for these processes.
Fig. 12.
Schematic representation of effect of depletion of the syntaxin-5 complex on the autophagic pathway. The endoplasmic reticulum is the site of synthesis and maturation of proteins entering the secretory pathway. Depletion of the syntaxin-5 SNARE complex impairs the ER-to-Golgi transport normally occurring in eukaryotic cells (light blue arrows). As a consequence, the anterograde transport and therefore the activity of lysosomal proteases is reduced, resulting in the lysosomal compartment dysfunction, accumulation of autophagosomes and decreased degradation of autophagic substrates.
The SNARE complexes consisting of syntaxin-5 (Jahn and Scheller, 2006; Hay et al., 1997; Zhang et al., 1999) and syntaxin-18 (Lewis and Pelham, 1996), have been proposed to have a role in bi-directional ER-to-Golgi transport in mammalian cells. Our data suggest a role for the syntaxin-5 and Sec22B SNARE proteins (post-ER exit) in the transfer to and through the Golgi complex of at least a subset of cargo proteins destined to the lysosomal compartment. Our data are compatible with a dual role for the SM protein Sly1, which is required for both the ER-to-Golgi transport step (Dascher and Balch, 1996) and the later, COG4-complex-dependent, intra-Golgi transport (Laufman et al., 2009). Our proposed model is consistent with a recent report which showed that depletion of syntaxin-5 or Sec22B causes a general block in secretion where the cargo proteins have been actually transported from the ER and then become trapped either in the Golgi or in very close proximity to it (Gordon et al., 2010). However, we did not observe any effect of syntaxin-18 depletion on either cathepsin anterograde transport or on the activity of the autophagic pathway (Fig. 10A–F). It would be therefore tempting to hypothesise a selective role for the syntaxin-5 SNARE complex in the anterograde transport of a specific subset of secretory protein destined to the lysosomal compartment. Further experiments will be required to address such an interesting issue.
The differences we have observed in knockdown efficiencies might explain some of the minor differences we have observed between different SNARE components and between different cell lines. For instance, this might explain the weaker effects of syntaxin-5 knockdown, because this left about 40% residual protein, compared with 10–20% of Sec22B and Sly1, respectively (supplementary material Fig. S9). The inefficient knockdown of syntaxin-5 might also explain its weak effect in the OVA-based fluorogenic degradation assay (supplementary material Fig. S8C). In secretion-competent specialised cells such as hepatocytes, the amount of residual SNARE proteins, together with a consistently higher capability to transport cargo proteins along the secretory pathway by a bulk flow mechanism (Palade, 1975; Gething and Sambrook, 1992: Ellgaard and Helenius, 2003), might also explain the lack of any accumulation of immature cathepsin proteins in the knockdown cells, as well as the lack of any appreciable change in the levels of Bip/grp78 upon depletion of Sly1 (supplementary material Fig. S7F).
Lysosomes are the major site of intracellular catabolic processes. There are many lysosomal storage disorders that result from defects in several specific catabolic enzymes. They result in incomplete degradation of macromolecules, which in turn results in the accumulation of the metabolic intermediates in lysosomes (Gieselmann, 1995). Moreover, there are also several diseases that apparently affect the transport machinery for lysosomes, such as Hermansky–Pudlak syndrome (HPS1 and HPS2) or Chediak–Higashi syndrome, which result in defective biogenesis of lysosomes and lysosome-related organelles (Barbosa et al., 1996; Dell'Angelica et al., 1999; Menasche et al., 2000; Huizing et al., 2000; Nishino et al., 2000). To date, there is no report providing association between any of the syntaxin-5 SNARE complex and lysosomal storage disorders. Nevertheless, a temperature-sensitive orthologue of Sly1 has been identified in zebrafish. Interestingly, sly1 is essential for blastema organisation and proliferation during two stages of fin regeneration (Nechiporuk et al., 2003). Its depletion significantly reduced the intracellular amounts of the catalytically active, mature forms of cathepsin B, D and L. The accumulation of autophagosomes is therefore likely to occur as a consequence of lysosomal dysfunction. Moreover, the altered processing of the cathepsins, along with the clear effect on GFP–lgp120 relocalisation we observed in Sly1-depleted cells, strongly suggests that the syntaxin-5 SNARE complex has a role in trafficking other lysosomal components. The apparent contradiction in the effect exerted by knockdown of Sly1 on the transiently overexpressed GPF-tagged lgp120 (massive ER relocalisation of exogenous protein transfected in Sly1-depleted cells; supplementary material Fig. S2) compared with the endogenous LAMP-1 staining pattern (Figs 7 and 8) is likely because a much larger proportion of the protein is present and fluxing through the ER in the overexpressing cells.
In conclusion, our findings suggest that the transport machinery of the early secretory pathway might have a role in processes that regulate lysosomal compartment biogenesis and/or homeostasis, which extends beyond the direct contribution on autophagosome synthesis that has been described for the ER membranes (Axe et al., 2008; Hayashi-Nishino et al., 2009). Further experiments will be needed to better elucidate the physical and functional link between these two fundamental components of eukaryotic cells – the early secretory pathway and the autophagosome–lysosome degradation system – because it is quite possible that different machinery in the early secretory pathway will regulate different aspects of the autophagy–lysosomal pathway.
Materials and Methods
Constructs
We are grateful to Paul Luzio (University of Cambridge, Cambridge, UK) for the GFP–lgp120 construct, to Jesse C. Hay (University of Montana, Missoula, MT) for the Myc–Sec22B and to Sima Lev (Weizmann Institute, Rehovot, Israel) for kindly providing us with the HA–syntaxin-5 and the HA–Sly1 expression vectors. HD gene exon 1 fragment with 74 poly-Q repeats in pEGFP-C1 (Clontech) (EGFP–HDQ74) construct was characterised previously (Narain et al., 1999); the EGFP–LC3 (gift from Tamotsu Yoshimori, Osaka University, Osaka, Japan) and the mCherry-LC3 expression vectors have been already described (Jahreiss et al., 2008). The cloning of the luciferase reporter vector bearing the human Bip/grp78 promoter region has been described elsewhere (Renna et al., 2007). The HSV-βGal expression vector was from Promega.
Antibodies
Rabbit anti-LC3 was from Novus Biological; rabbit anti-Sec22B and anti-syntaxin-5 were from Santa Cruz; rabbit polyclonal anti-Sly1 was from ProteinTech; mouse monoclonal anti-cathepsin B, mouse monoclonal anti-syntaxin-18, rabbit polyclonal anti-LAMP-1 and rabbit polyclonal anti-Bip/grp78 were from AbCam; mouse monoclonal anti-LC3 (Nanotools); mouse monoclonal anti-LAMP1 (clone H4A3, obtained from Developmental Studies Hybridoma Bank, University of Iowa); mouse monoclonal anti-p62, anti-cathepsin-D and anti-cathepsin-L antibodies were from BD Bioscience; rabbit anti-actin was from Sigma, mouse monoclonal anti-HA antibody was from Covance; mouse monoclonal anti-Myc was from Roche Diagnostics; anti-mouse and anti-rabbit HRP-conjugated secondary antibodies were from GE Healthcare; goat anti-mouse Alexa-Fluor-488-conjugated, goat anti-mouse Alexa Fluor 633 and goat anti-rabbit Alexa Fluor 594 secondary antibodies were from Molecular Probes (Invitrogen).
Chemicals
The Sec22B, Sly1, syntaxin-5 and syntaxin-18 SMARTpool (pool of four different siRNA duplexes) siRNA reagents (Dharmacon) were resuspended in RNase-free water and used at a final concentration of 20 nM. A SMARTpool control siRNA, which does not target any human or mouse genes, was used as a control. Bafilomycin A1 (Millipore) was resuspended in DMSO (Sigma) and used at the saturating concentration of 400 nM. All the other standard laboratory chemicals were purchased from Sigma, unless otherwise indicated.
Cell culture
HeLa and HuH7 cells were grown in DMEM supplemented with 10% FBS, 100 U/ml penicillin-streptomycin, 2 mM l-glutamine at 37°C in a humidified atmosphere of 5% CO2 and 95% O2. HeLa cells stably expressing the mRFP-GFP/LC3 reporter were grown in the same conditions as reported above, supplemented with 600 μg/ml G418 (Gibco).
Transfection
In all the RNA interference experiments, HeLa cells were transfected 24 hours after seeding with a 20 nM final concentration of the indicated SMARTpool siRNAs using Lipofectamine 2000, according to the manufacturer's instructions (Invitrogen). Cells were then cultured and in full medium for 72 hours. For the assessment of autophagy by LC3-II levels, a saturating concentration (400 nM) of Bafilomycin A1 was added to the cells in the last 4 hours before harvesting. For the assessment of LC3-II autophagic flux upon snare protein overexpression, HeLa cells were transfected with 2 mg of the indicated constructs and maintained in culture for 48 hours. For the Huntingtin exon 1 aggregation and GFP–LC3 dot experiments, HeLa cells were first transfected as above reported. 48 hours after the first round of transfection, cells were retransfected with the following combination: EGFP–HDQ74 plus either control or specific siRNA reagents (2 μg; 20 nM) and EGFP–LC3 plus either control or specific siRNA reagents (2 μg; 20 nM), respectively. Cells were then washed once, cultured and treated in full medium and fixed with 4% paraformaldehyde (Sigma) after 48 hours (EGFP–HDQ74) or 24 hours (EGFP–LC3 after transfection, mounted in AF-1 (CitiFluor) and observed with a fluorescence microscope. For the LC3 and lgp120 colocalisation analysis, 48 hours after the first round of transfection, HeLa cells were retransfected with the following combination: control or specific siRNA reagents (20 nM) along with mCherry–LC3 plus GFP–lgp120 (1 μg: 1:1 ratio), respectively. Cells were then cultured in full medium for 24 hours, fixed with 4% paraformaldehyde (Sigma), mounted in ProLong AntiFade (Invitrogen) and observed with a confocal microscope.
Quantification of poli-Q74 huntingtin aggregates formation and LC3-positive vesicles
Quantification of aggregate formation and LC3 dots were assessed as already previously described (Ravikumar et al., 2002; Sarkar et al., 2008). 200 EGFP–HDQ74-transfected cells were selected and the number of cells with aggregates counted using a fluorescence microscope. For quantification of LC3-II dots upon transfection, 200 EGFP–LC3-positive HeLa cells were selected and cells with ~10 or more LC3-labelled vesicles were counted. The identity of the slides was unavailable to the observer until all slides had been studied. The experiments were performed in triplicate and repeated at least three times.
Western blot analysis
Cells were harvested in ice-cold PBS and pellets were lysed on ice in Laemmli buffer [62.5 mM Tris-HCl, pH 6.8, 2% sodium dodecyl sulphate (SDS), 5% β-mercaptoethanol, 10% glycerol and 0.01% Bromophenol Blue] for 30 minutes, in the presence of a protease inhibitors mix (Roche Diagnostics). Protein samples were boiled for 5–7 minutes at 100°C, separated by SDS-PAGE, transferred onto PVDF membranes, then subjected to western blot analysis and finally visualised using an ECL detection kit (GE Healthcare).
Immunofluorescence and microscopy
Cells were grown on coverslips and fixed in 4% paraformaldehyde for 10 minutes and then permeabilised with −20°C methanol for 4 minutes. 4% goat serum (Sigma) in 1× PBS was used for blocking and primary and secondary buffer. Coverslips were left in primary antibody overnight at 4°C. Secondary antibodies were conjugated Alexa Fluor antibodies (Invitrogen). A Zeiss Axiovert 200M microscope with a LSM510 confocal attachment (63× NA 1.4 Plan-Apochromat oil-immersion lens LSM510 META, Carl Zeiss) along with the LSM510 version 3.2 software (Carl Zeiss) was used for fluorescent confocal microscopy involving immunofluorescent staining with Alexa-Fluor-conjugated secondary antibodies or fluorescently tagged proteins. All confocal images were taken with a 63× oil-immersion lens. Microscopy was performed on cells fixed on coverslips. Coverslips were mounted in Prolong Gold Antifade reagent with DAPI (Molecular Probes, Invitrogen). ImageJ and Photoshop (Adobe) were used for further analysis and processing of confocal images.
Quantification of LC3 and LAMP-1 colocalisation
Colocalisation of LC3 and LAMP-1 was imaged using an LSM510 META confocal microscope (63× NA 1.4 Plan-Apochromat oil-immersion lens) along with the LSM510 version 3.2 software after immunostaining of endogenous proteins. 20 images of a mean of four cells per image were taken per condition per experiment. Each experiment was run at least three times. Exposure settings were unchanged throughout acquisition. Images were analysed using the JaCoP plug-in (Bolte and Cordelières, 2006) in ImageJ software. Pearson's and Mander's (original, nonthreshold) coefficients were used for assessing colocalisation. Student's t-tests were performed to determine statistical significance for correlation and colocalisation coefficients. Images shown are single planes projections of representative images using ImageJ and Photoshop software.
MCherry–LC3 and GFP–lgp120 colocalisation analysis
As previously reported (Jahreiss et al., 2008; Jahreiss et al., 2009), coverslips were blinded and 20 cells per condition were imaged on a Zeiss Axiovert 200M microscope with a LSM 510 confocal attachment using an 63× 1.4 NA Plan Apochromat oil-immersion lens. Laser lines were at 488 nm (lgp120–GFP, RFP-GFP/LC3), 543 nm (mCherry-LC3, RFP-GFP/LC3). These cells were then analysed in a Zeiss LSM Image Browser 3.5 as follows: first, after switching off all other channels, all mCherry–LC3-positive vesicles were counted and marked. Then, the GFP channel was switched back on and the number of colocalised vesicles was counted. From these values, the fraction of double-labelled vesicles was determined, i.e. the percentage of LC3-positive vesicles labelled with another/both other markers was calculated. HeLa cells stably expressing the RFP-GFP/LC3 reporter (Sarkar et al., 2009) were imaged and analysed in the same way.
Transfection experiments for luciferase reporter assays
HeLa cells were seeded in six-well plates and transfected with the indicated siRNA reagents, as described above. After 48 hours, cells were retransfected with 0.5 μg luciferase reporter plasmids plus 0.05 μg of the RSV–β-Gal reporter control plasmid (Promega) and cultured in full medium for 24 hours. Cells were then washed with cold phosphate-buffered saline, harvested and lysed in reporter lysis buffer (Promega). To measure β-galactosidase activity, cell extracts were incubated for 1 hour at 37°C in β-galactosidase assay buffer (200 mM sodium phosphate buffer, pH 7.3, 2 mM MgCl2, 100 mM β-mercaptoethanol, 1.33 mg/ml o-nitrophenyl-β-D-galactopyranoside). The reaction was blocked by adding 1 M sodium carbonate, and absorbance was measured at 420 nm. Luciferase activity was measured in luminometer using a luciferase assay reagent kit (Promega). The relative luciferase activity (RLU) is defined as the luciferase-to-β-galactosidase activity ratio and normalised for the protein concentration of each sample. In all experiments, values are reported as the average and s.d. of at least three independent experiments carried out in triplicate. Statistical analysis was performed using Student's t-test.
Degradation assay
HeLa cells were seeded in six-well plates and transfected with the indicated siRNA reagents. After 48 hours, cells were retransfected with the same siRNA mix plus 1 μg of a phagocytosis-competent, chimeric immunoglobulin receptor expression vector (Fcγ-RI-γ) (Hutchinson et al., 1995) and cultured in full medium for 24 hours. To allow phagocytosis of IgG-coated beads, HeLa cells were incubated (1 hour; 37°C) with fluorescent beads (Polysciences) covalently conjugated with human polyclonal IgG and ovalbumin, thoroughly washed and then incubated for a further 24 hours to permit degradation of internalised beads. Cells were then placed at 4°C to prevent bead internalisation, stained with a human IgG-specific antibody (Jackson ImmunoResearch) to mark noninternalised beads and then fixed. Beads were subsequently recovered by cell disruption (lysis with 1% Triton X-100 for 30 minutes followed by homogenisation by passage through a hypodermic needle in the presence of proteases inhibitors) and then incubated with ovalbumin-specific FITC-conjugated antibody (Abcam) to detect remaining bead-associated ovalbumin, which was quantified by flow cytometry on a FACSCalibur apparatus (Becton Dickinson).
Statistical analysis
Densitometric analysis on the immunoblots was performed using ImageJ software. The P values for the densitometric analysis were determined by factorial ANOVA test using STATVIEW v4.53 (Abacus Concepts), where the control condition was set to 100%. The y-axis values are shown in percentage (%) and the error bars denote s.d. Experiments were performed at least three times in triplicate. The P values for assessing EGFP–HDQ74 aggregation, number of GFP–LC3 vesicles and analysis of autophagosome maturation and autophagosome–lysosome fusion were determined using Student's t-test (***P<0.001; **P<0.01; *P<0.05; NS, non-significant).
Supplementary Material
Acknowledgments
We thank B. Ravikumar, S. Sarkar, V. I. Korolchuk, K. Moreau and D. J. Metcalf for helpful comments and discussion on the manuscript. We are grateful for a Wellcome Trust Senior Fellowship in Clinical Science (R.A.F. and D.C.R.), an MRC Programme Grant, the Sackler Trust, funding from the NIHR Biomedical Research Centre at Addenbrooke's Hospital, and The Daphne Jackson Trust and the Isaac Newton Trust (D.C.R.) and awards made by the Overseas Research Studentship and Cambridge Trust Overseas (A.R.W.). Funding to pay the open access publication charge is provided by the Wellcome Trust. Deposited in PMC for immediate release.
This is an Open Access article distributed under the terms of the Creative Commons Attribution Non-Commercial Share Alike License (http://creativecommons.org/licenses/by-nc-sa/3.0), which permits unrestricted non-commercial use, distribution and reproduction in any medium provided that the original work is properly cited and all further distributions of the work or adaptation are subject to the same Creative Commons License terms.
Supplementary material available online at http://jcs.biologists.org/cgi/content/full/124/3/469/DC1
References
- Aridor M., Hannan L. A. (2000). Traffic jam: a compendium of human diseases that affect intracellular transport processes. Traffic 11, 836-851 [DOI] [PubMed] [Google Scholar]
- Axe E. L., Walker S. A., Manifava S. A., Chandra P., Roderick H. L., Habermann A., Griffiths G., Ktistakis N. T. (2008). Autophagosome formation from membrane compartments enriched in phosphatidylinositol 3-phosphate and dynamically connected to the endoplasmic reticulum. J. Cell Biol. 182, 685-701 [DOI] [PMC free article] [PubMed] [Google Scholar]
- Barbosa M. D., Nguyen Q. A., Tchernev V. T., Ashley J. A., Detter J. C., Blaydes S. M., Brandt S. J., Chotai D., Hodgman C., Solari R. C., et al. (1996). Identification of the homologous beige and Chediak-Higashi syndrome genes. Nature 382, 262-265 [DOI] [PMC free article] [PubMed] [Google Scholar]
- Bernales S., McDonald K. L., Walter P. (2006). Autophagy counterbalances endoplasmic reticulum expansion during the unfolded protein response. PLoS Biol. 4, e423 [DOI] [PMC free article] [PubMed] [Google Scholar]
- Bolte S., Cordelières F. P. (2006). A guided tour into subcellular colocalization analysis in light microscopy. J. Microsc. 224, 213-232 [DOI] [PubMed] [Google Scholar]
- Dascher C., Balch W. E. (1996). Mammalian Sly1 regulates syntaxin 5 function in endoplasmic reticulum to Golgi transport. J. Biol. Chem. 271, 15866-15869 [DOI] [PubMed] [Google Scholar]
- Dell'Angelica E. C., Shotelersuk V., Aguilar R. C., Gahl W. A., Bonifacino J. S. (1999). Altered trafficking of lysosomal proteins in Hermansky-Pudlak syndrome due to mutations in the beta 3A subunit of the AP-3 adaptor. Mol. Cell 1, 11-21 [DOI] [PubMed] [Google Scholar]
- Ellgaard L., Helenius A. (2003). Quality control in the endoplasmic reticulum. Nat. Rev. Mol. Cell Biol. 4, 181-191 [DOI] [PubMed] [Google Scholar]
- Fader C. M., Sánchez D. G., Mestre M. B., Colombo M. I. (2009). TI-VAMP/VAMP7 and VAMP3/cellubrevin: two v-SNARE proteins involved in specific steps of the autophagy/multivesicular body pathways. Biochim. Biophys. Acta 1793, 1901-1916 [DOI] [PubMed] [Google Scholar]
- Fasshauer D., Sutton R. B., Brunger A. T., Jahn R. (1998). Conserved structural features of the synaptic fusion complex: SNARE proteins reclassified as Q- and R-SNAREs. Proc. Natl. Acad. Sci. USA 95, 15781-15786 [DOI] [PMC free article] [PubMed] [Google Scholar]
- Fukuda M. (1991). Lysosomal membrane glycoproteins. Structure, biosynthesis, and intracellular trafficking. J. Biol. Chem. 266, 21327-21330 [PubMed] [Google Scholar]
- Furuta N., Fujita N., Noda T., Yoshimori T., Amano A. (2010). Combinational soluble N-ethylmaleimide-sensitive factor attachment protein receptor proteins VAMP8 and Vti1b mediate fusion of antimicrobial and canonical autophagosomes with lysosomes. Mol. Biol. Cell 21, 1001-1010 [DOI] [PMC free article] [PubMed] [Google Scholar]
- Gething M. J., Sambrook J. (1992). Protein folding in the cell. Nature 355, 33-45 [DOI] [PubMed] [Google Scholar]
- Gieselmann V. (1995). Lysosomal storage diseases. Biochem. Biophys. Acta 1270, 103-136 [DOI] [PubMed] [Google Scholar]
- Gordon D. E., Bond L. M., Sahlender D. A., Peden A. A. (2010). A targeted siRNA screen to identify SNAREs required for constitutive secretion in mammalian cells. Traffic 11, 1191-1204 [DOI] [PubMed] [Google Scholar]
- Hay J. C., Chao D. S., Kuo C. S., Scheller R. H. (1997). Protein interactions regulating vesicle transport between the endoplasmic reticulum and Golgi apparatus in mammalian cells. Cell 89, 149-158 [DOI] [PubMed] [Google Scholar]
- Hayashi-Nishino M., Fujita N., Takeshi Noda T., Yamaguchi A., Yoshimori T., Yamamoto A. (2009). A subdomain of the endoplasmic reticulum forms a cradle for autophagosome formation. Nat. Cell Biol. 11, 1433-1437 [DOI] [PubMed] [Google Scholar]
- Hong W. (2005). SNAREs and traffic. Biochem. Biophys. Acta 1744, 120-144 [DOI] [PubMed] [Google Scholar]
- Huizing M., Anikster Y., Gahl W. A. (2000). Hermansky-Pudlak syndrome and related disorders. Traffic 1, 836-851 [DOI] [PubMed] [Google Scholar]
- Hutchinson M. J., Harrison P. T., Floto R. A., Allen J. M. (1995). Fc gamma receptor-mediated phagocytosis requires tyrosine kinase activity and is ligand independent. Eur. J. Immunol. 25, 481-487 [DOI] [PubMed] [Google Scholar]
- Jahn R., Scheller R. H. (2006). SNAREs-engines for membrane fusion. Nat. Rev. Mol. Cell Biol. 7, 631-643 [DOI] [PubMed] [Google Scholar]
- Jahreiss L., Menzies F. M., Rubinsztein D. C. (2008). The itinerary of autophagosomes: from peripheral formation to kiss-and-run fusion with lysosomes. Traffic 9, 574-587 [DOI] [PMC free article] [PubMed] [Google Scholar]
- Jahreiss L., Renna M., Bittman R., Arthur G., Rubinsztein D. C. (2009). 1-O-Hexadecyl-2-O-methyl-3-O-(2′-acetamido-2′-deoxy-β-D-glucopyranosyl)-sn-glycerol(Gln) induces cell death with more autophagosomes which is autophagy-independent Autophagy 5, 835-846 [DOI] [PubMed] [Google Scholar]
- Kabeya Y., Mizushima N., Ueno T., Yamamoto A., Kirisako T., Noda T., Kominami E., Ohsumi Y., Yoshimori T. (2000). LC3, a mammalian homologue of yeast Apg8p, is localized in autophagosome membranes after processing. EMBO J. 19, 5720-5728 [DOI] [PMC free article] [PubMed] [Google Scholar]
- Kaufman R. J. (1999). Stress signalling from the lumen of the endoplasmic reticulum: coordination of gene transcriptional and translational controls. Genes Dev. 13, 1211-1233 [DOI] [PubMed] [Google Scholar]
- Kimura S., Noda T., Yoshimori T. (2007). Dissection of the autophagosome maturation process by a novel reporter protein, tandem fluorescent-tagged LC3. Autophagy 3, 452-460 [DOI] [PubMed] [Google Scholar]
- Klionsky D. J., Cuervo A. M., Seglen P. O. (2007). Methods for monitoring autophagy from yeast to human. Autophagy 3, 181-206 [DOI] [PubMed] [Google Scholar]
- Klionsky D. J., Abeliovich H., Agostinis P., Agrawal D. K., Aliev G., Askew D. S., Baba M., Baehrecke E. H., Bahr B. A., Ballabio A., et al. (2008). Guidelines for the use and interpretation of assays for monitoring autophagy in higher eukaryotes. Autophagy 4, 151-175 [DOI] [PMC free article] [PubMed] [Google Scholar]
- Korolchuk V. I., Mansilla A., Menzies F. M., Rubinsztein D. C. (2009). Autophagy inhibition compromises degradation of ubiquitin-proteasome pathway substrates. Mol. Cell 33, 517-527 [DOI] [PMC free article] [PubMed] [Google Scholar]
- Laufman O., Kedan A., Hong W., Lev S. (2009). Direct interaction between the COG complex and the SM protein, Sly1, is required for Golgi SNARE pairing. EMBO J. 28, 2006-2017 [DOI] [PMC free article] [PubMed] [Google Scholar]
- Lee J. H., Yu W. H., Kumar A., Lee S., Mohan P. S., Peterhoff C. M., Wolfe D. M., Martinez-Vicente M., Massey A. C., Sovak G., et al. (2010). Lysosomal proteolysis and autophagy require presenilin 1 and are disrupted by Alzheimer-related PS1 mutations. Cell 141, 1146-1158 [DOI] [PMC free article] [PubMed] [Google Scholar]
- Levine B., Klionsky D. J. (2004). Development by self-digestion: molecular mechanisms and biological functions of autophagy. Dev. Cell 6, 463-477 [DOI] [PubMed] [Google Scholar]
- Lewis M. J., Pelham H. R. (1996). SNARE-mediated retrograde traffic from the Golgi complex to the endoplasmic reticulum. Cell 85, 205-215 [DOI] [PubMed] [Google Scholar]
- Mach L., Mort J. S., Glossl J. (1994). Maturation of human procathepsin B. Proenzyme activation and proteolytic processing of the precursor to the mature proteinase, in vitro, are primarily unimolecular processes. J. Biol. Chem. 269, 13030-13035 [PubMed] [Google Scholar]
- McNew J. A., Parlati F., Fukuda R., Johnston R. J., Paz K., Paumet F., Söllner T. H., Rothman J. E. (2000). Compartmental specificity of cellular membrane fusion encoded in SNARE proteins. Nature 407, 153-159 [DOI] [PubMed] [Google Scholar]
- Ménasché G., Pastural E., Feldmann J., Certain S., Ersoy F., Dupuis S., Wulffraat N., Bianchi D., Fischer A., Le Deist F., et al. (2000). Mutation in RAB27A cause Griscelli syndrome associated with haemophagocytic syndrome. Nat. Genet. 25, 173-176 [DOI] [PubMed] [Google Scholar]
- Mizushima N., Levine B., Cuervo A. M., Klionsky D. J. (2008). Autophagy fights disease through cellular self-digestion. Nature 451, 1069-1075 [DOI] [PMC free article] [PubMed] [Google Scholar]
- Narain Y., Wyttenbach A., Rankin J., Furlong R. A., Rubinsztein D. C. (1999). A molecular investigation of true dominance in Huntington's disease. J. Med. Genet. 36, 739-746 [DOI] [PMC free article] [PubMed] [Google Scholar]
- Nechiporuk A., Poss K. D., Johnson L. D., Keating M. D. (2003). Positional cloning of a temperature-sensitive mutant emmental reveals a role for sly1 during cell proliferation in zebrafish fin regeneration. Dev. Biol. 258, 291-306 [DOI] [PubMed] [Google Scholar]
- Nishino I., Fu J., Tanji K., Yamada T., Shimojo S., Koori T., Mora M., Riggs J. E., Oh S. J., Koga Y., et al. (2000). Primary Lamp2 deficiency causes X-linked vacuolar cardiomyopathy and myopathy (Danon disease). Nature 406, 906-910 [DOI] [PubMed] [Google Scholar]
- Palade G. (1975). Intracellular aspects of the process of protein synthesis. Science 189, 347-358 [DOI] [PubMed] [Google Scholar]
- Pérez-Victoria F. J., Schindler C., Magadán J. G., Mardones G. A., Delevoye C., Romao M., Raposo G., Bonifacino J. S. (2010). Ang2/fat-free is a conserved subunit of the golgi-associated retrograde protein (GARP) complex. Mol. Biol. Cell 21, 3386-3395 [DOI] [PMC free article] [PubMed] [Google Scholar]
- Ravikumar B., Duden R., Rubinsztein D. C. (2002). Aggregate-prone proteins with polyglutamine and polyalanine expansions are degraded by autophagy. Hum. Mol. Genet. 11, 1107-1117 [DOI] [PubMed] [Google Scholar]
- Renna M., Caporaso M. G., Bonatti S., Kaufman R. J., Remondelli P. (2007). Regulation of ERGIC-53 gene transcription in response to endoplasmic reticulum stress. J. Biol. Chem. 282, 22499-22512 [DOI] [PubMed] [Google Scholar]
- Rubinsztein D. C., Gestwicki J. E., Murphy L. O., Klionsky D. J. (2007). Potential therapeutic applications of autophagy. Nat. Rev. Drug Discov. 6, 304-312 [DOI] [PubMed] [Google Scholar]
- Rubinsztein D. C., Cuervo A. M., Ravikumar B., Sarkar S., Korolchuk V., Kaushik S., Klionsky D. J. (2009). In search of an “autophagomometer”. Autophagy 5, 585-589 [DOI] [PubMed] [Google Scholar]
- Sarkar S., Davies J. E., Huang Z., Tunnacliffe A., Rubinsztein D. C. (2007) Trehalose, a novel mTOR-independent autophagy enhancer, accelerates the clearance of mutant huntingtin and alpha-synuclein. J. Biol. Chem. 282, 5641-5652 [DOI] [PubMed] [Google Scholar]
- Sarkar S., Krishna G., Imarisio S., Saiki S., O'Kane C. J., Rubinsztein D. C. (2008). A rationale mechanism for combination treatment of Huntington's disease using lithium and rapamycin. Hum. Mol. Genet. 17, 170-178 [DOI] [PubMed] [Google Scholar]
- Sarkar S., Korolchuk V., Renna M., Winslow A., Rubinsztein D. C. (2009). Methodological considerations for assessing autophagy modulators: a study with calcium phosphate precipitates. Autophagy 5, 307-313 [DOI] [PubMed] [Google Scholar]
- Savina A., Jancic C., Hugues S., Guermonprez P., Vargas P., Moura I. C., Lennon-Duménil A. M., Seabra M. C., Raposo G., Amigorena S. (2006). NOX2 controls phagosomal pH to regulate antigen processing during crosspresentation by dendritic cells. Cell 126, 205-218 [DOI] [PubMed] [Google Scholar]
- Söllner T., Whiteheart S. W., Brunner M., Erdjument-Bromage H., Geromanos S., Tempst P., Rothman J. E. (1993). SNAP receptors implicated in vesicle targeting and fusion. Nature 362, 318-324 [DOI] [PubMed] [Google Scholar]
- Sutton R. B., Fasshauer D., Jahn R., Brunger A. T. (1998). Crystal structure of a SNARE complex involved in synaptic exocytosis at 2.4 Å resolution. Nature 395, 347-353 [DOI] [PubMed] [Google Scholar]
- Suzuki K., Ohsumi Y. (2007). Molecular machinery of autophagosome formation in yeast, Saccharomyces cerevisiae. FEBS Lett. 581, 2156-2161 [DOI] [PubMed] [Google Scholar]
- Weber T., Zemelman B. V., McNew J. A., Westermann B., Gmachl M., Parlati F., Söllner T. H., Rothman J. E. (1998). SNAREpins: minimal machinery for membrane fusion. Cell 92, 759-772 [DOI] [PubMed] [Google Scholar]
- Weimbs T., Low S. H., Chapin S. J., Mostov K. E., Bucher P., Hofmann K. (1997). A conserved domain is present in different families of vesicular fusion proteins: a new superfamily. Proc. Natl. Acad. Sci. USA 94, 3046-3051 [DOI] [PMC free article] [PubMed] [Google Scholar]
- Yorimitsu T., Nair U., Yang Z., Klionsky D. J. (2006). Endoplasmic reticulum stress triggers autophagy. J. Biol. Chem. 281, 30299-30304 [DOI] [PMC free article] [PubMed] [Google Scholar]
- Yoshimori T., Noda T. (2008). Toward unraveling membrane biogenesis in mammalian autophagy. Curr. Opin. Cell Biol. 20, 401-407 [DOI] [PubMed] [Google Scholar]
- Zhang L., Yu J., Pan H., Hu P., Hao Y., Cai W., Zhu H., Yu A. D., Xie X., Ma D., Yuan J. (2007). Small molecule regulators of autophagy identified by an image-based high-throughput screen. Proc. Natl. Acad. Sci. USA 104, 19023-19028 [DOI] [PMC free article] [PubMed] [Google Scholar]
- Zhang T., Wong S. H., Tang B. L., Xu Y., Hong W. (1999). Morphological and functional association of Sec22b/ERS-24 with the pre-Golgi intermediate compartment. Mol. Biol. Cell. 10, 435-453 [DOI] [PMC free article] [PubMed] [Google Scholar]
Associated Data
This section collects any data citations, data availability statements, or supplementary materials included in this article.


