

Abstract
The globus pallidus (GP) predominantly contains GABAergic projection neurons that occupy a central position in the indirect pathway of the basal ganglia. They have long dendrites that can extend through one-half the diameter of the GP in rats, potentially enabling convergence and interaction between segregated basal ganglia circuits. Because of the length and fine diameter of GP dendrites, however, it is unclear how much influence distal synapses have on spiking activity. Dendritic expression of fast voltage-dependent Na+ channels (NaF channels) can enhance the importance of distal excitatory synapses by allowing for dendritic spike initiation and by subthreshold boosting of EPSPs. Antibody labeling has demonstrated the presence of NaF channel proteins in GP dendrites, but the quantitative expression density of the channels remains unknown. We built a series of nine GP neuron models that differed only in their dendritic NaF channel expression level to assess the functional impact of this parameter. The models were all similar in their basic electrophysiological features; however, higher expression levels of dendritic NaF channels increased the relative effectiveness of distal inputs for both excitatory and inhibitory synapses, broadening the effective extent of the dendritic tree. Higher dendritic NaF channel expression also made the neurons more resistant to tonic inhibition and highly sensitive to clustered synchronous excitation. The dendritic NaF channel expression pattern may therefore be a critical determinant of convergence for both the striatopallidal and subthalamopallidal projections, while also dictating which spatiotemporal input patterns are most effective at driving GP neuron output.
Introduction
The globus pallidus (GP in rodents, GPe in primates) is a tonically active, inhibitory nucleus in the basal ganglia indirect pathway. GP neurons receive excitation from the subthalamic nucleus (STN) and inhibition from the striatum and from other GP neurons (Falls et al., 1983; Kita and Kitai, 1994; Smith et al., 1998; Sadek et al., 2007). They project to the STN, the basal ganglia output nuclei, and in some cases back to the striatum (Kita and Kitai, 1994; Parent and Hazrati, 1995; Bevan et al., 1998; Smith et al., 1998; Sato et al., 2000). These network connections put the GP in a position to directly influence information flow through the basal ganglia circuit at almost every stage.
Rat GP dendritic fields can extend 1 mm in diameter (Park et al., 1982; Millhouse, 1986), nearly one-half the diameter of the whole nucleus, and are positioned with the long axis perpendicular to the topographically organized striatal afferents (Park et al., 1982; Yelnik et al., 1984; Kita and Kitai, 1994). As a result, the distal dendrites on opposite sides of a single GP neuron likely receive synaptic input from nonoverlapping striatal regions, and single striatal axons likely contact GP neurons whose cell bodies are far apart (Chang et al., 1981; Park et al., 1982; Wilson and Phelan, 1982; Kawaguchi et al., 1990). The excitatory projection from the STN to GP has a similar topographical organization (Shink et al., 1996; Smith et al., 1998) and could involve convergence and divergence of connectivity for the same reasons.
However, many GP dendrites are of submicron diameter (Difiglia et al., 1982; Park et al., 1982), so passive voltage attenuation will severely reduce the impact of distal synaptic inputs unless counteracted by some form of dendritic amplification. Antibody labeling has demonstrated the presence of fast, transient, voltage-dependent Na+ channel (NaF channel) proteins in rat GP dendrites, and whole-cell recordings from brain slices indicated that excitatory synaptic inputs could evoke propagating dendritic spikes in some instances (Hanson et al., 2004). This raises the central question of the present study: in what ways would GP neurons with higher levels of dendritic NaF conductance (gNaF) differ functionally from GP neurons with lower dendritic gNaF?
To address this question, we constructed and compared nine model GP neurons that differed only in their dendritic gNaF distributions. We found that by changing the dendritic gNaF in a declining gradient from the soma to the distal dendritic tips, the total gNaF expression level could change by >40-fold while still maintaining realistic spike shapes, rates, and frequency-current response characteristics. Despite their similar basic profiles, the model neurons differed widely in terms of the spatiotemporal pattern of synaptic input that most effectively drove their activity, indicating an important role of dendritic NaF channels in GP function.
Materials and Methods
Electrophysiology.
Coronal slices 300 μm in thickness were prepared from 16- to 21-d-old male Sprague Dawley rats according to procedures described previously (Hanson et al., 2004; Günay et al., 2008). Briefly, rats were anesthetized with halothane and then decapitated. The brains were rapidly removed and immersed in ice-cold artificial CSF (ACSF) containing the following (in mm): 124 NaCl, 3 KCl, 1.9 MgSO4, 1.2 KH2PO4, 26 NaHCO3, 2 CaCl2, and 20 d-glucose, bubbled continuously with a mixture of 95% O2/5% CO2. Each brain was affixed to a chilled stainless steel block with cyanoacrylate glue, the two hemispheres were separated by a midsagittal scalpel cut, and slices were cut with a vibratome (Sigmann Elektronik) and transferred immediately to an incubation chamber containing oxygenated ACSF at 32°C where they were kept until use.
For recording, slices were transferred to a perfusion chamber and held down with silver wire. The recording chamber sits atop a heating element (Luigs and Neumann), and all recordings were performed at 30–34°C. GP neurons were identified visually using infrared–differential interference contrast optics. Glass pipettes were made from borosilicate glass (B150-86-10, Sutter Instruments; or 8250, AM Systems) using a horizontal puller (Sutter Instruments). They were individually coated with Sylgard 184 (Dow Corning) and filled with filtered internal saline containing the following (in mm): 140 K-gluconate, 6 NaCl, 2 MgCl2, 0.2 EGTA, 4 Na4ATP, 0.4 Na3GTP, 5 glutathione, 0.5 spermine, 0.02 Alexa-568, and 10 HEPES, pH 7.3, with KOH. For morphological reconstructions, 1% biocytin was included in the pipette solution. Recordings were obtained using an Axoclamp-2B amplifier (Molecular Devices). Amplifier signals were low-pass filtered at 3 kHz with a Brownlee Model 440 amplifier, digitized with a 12-bit (ComputerBoards) or 16-bit (National Instruments) analog-to-digital converter, and sampled at 10 kHz using custom software. Data were analyzed off-line using Matlab (MathWorks). All animal procedures used were approved by the Emory University Institutional Animal Care and Use Committee and conformed to the National Institutes of Health Guide for the Care and Use of Laboratory Animals.
Simulations.
Simulations were performed using GENESIS (www.genesis-sim.org/GENESIS) and analyzed with Matlab. Most simulations were run on the Emory High Performance Computing Cluster (Sun Microsystems). Approximately 1 s of simulated data could be generated per minute on each processor core.
Model construction.
The morphological and passive electrical properties of the rat GP neuron that was used for the simulations (see Fig. 1A) have been described in previous publications (Hanson et al., 2004; Günay et al., 2008). The following parameter values describe the passive biophysical properties of the model neurons: CM = 0.024 F/m2, RM = 1.47 Ωm2, RA = 1.74 Ωm. A canonical axon was connected to the soma to allow for axonal spike initiation and realistic axonal current sinks and sources. This axon was adapted from Shen et al. (1999), with an initial segment of 20 micrometers and 3 myelinated internodal segments of 1 mm each separated by two unmyelinated nodes of Ranvier. The myelinated compartments had no active conductances and had the following passive parameter values: CM = 0.00024 F/m2, RM = 10 Ωm2, RA = 1.74 Ωm.
Figure 1.
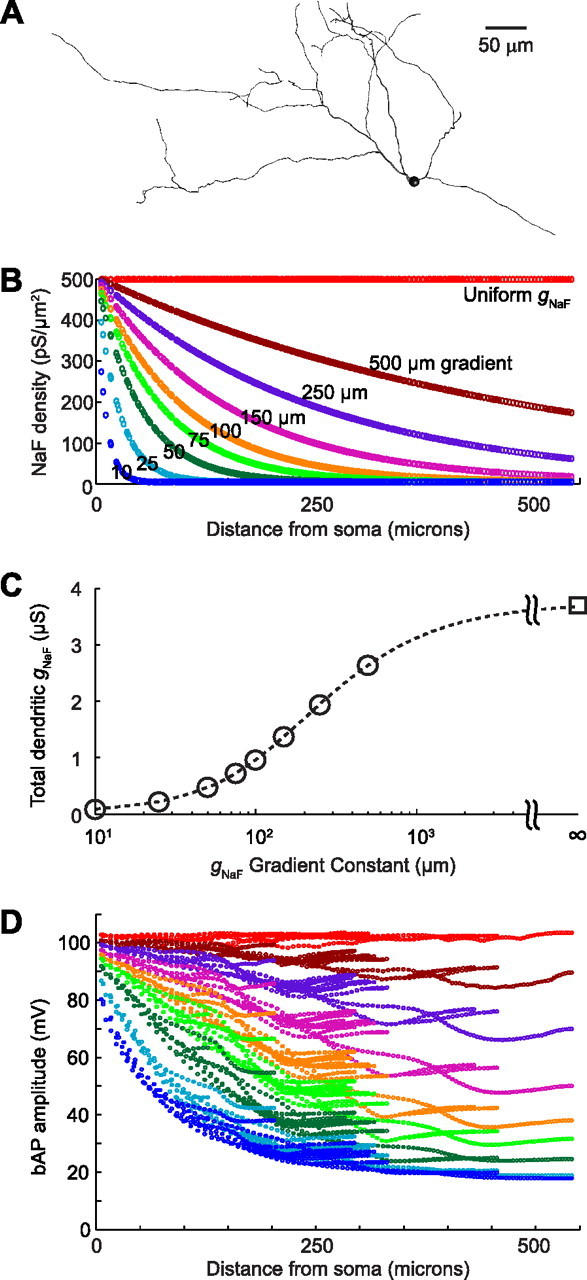
Properties of the model GP neurons. Nine model neurons were compared. A, They all shared the same morphology, which was reconstructed from a biocytin-filled rat GP neuron. They also shared the same biophysical parameters and ion channel densities with one exception: the density of the fast sodium conductance (gNaF) in the dendrites. B, For each of the gradient distributions, gNaF started at the somatic level of 500 pS/μm2 and approached a minimum of 5 pS/μm2 as an exponential function of distance from the soma. C, The differential dendritic gNaF patterns resulted in total summed dendritic gNaF levels ranging from 0.09 to 3.70 μS. D, The backpropagation of spontaneous action potentials was strongly affected by the dendritic gNaF expression level, but bAPs still reached the most distal dendritic tips at nearly 20 mV, even in the model neuron with the lowest gNaF level.
The model neurons were endowed with active properties through the incorporation of nine different types of ion channels (eight voltage dependent; one calcium dependent) based on experimental data. In a previous study, we systematically varied the relative amounts of the nine ion channel types to create a large (N > 100,000) database of model GP neurons, and we compared the model neurons with a database of 146 GP neurons recorded in brain slices (Günay et al., 2008). For the present study, we began with a set of model ion channel parameters from the database that provided a good match to many of the brain slice neurons. We then made eight new variations, yielding a series of nine model neurons that differed in only one respect: the distribution of NaF channels in their dendrites. The initial parameter set had a uniform density of NaF channels throughout the soma and dendrites, whereas the eight variants had a declining proximal–distal gradient of NaF channels determined by the following equation:
 |
where gNaF(i) is the conductance density of NaF in dendritic compartment i, xi is the path distance (in micrometers) separating compartment i from the soma, and L is a length constant that determines the steepness of the gradient. The nine model neurons therefore differed only in the parameter L, which took the following values (in μm): infinity, 500, 250, 150, 100, 75, 50, 25, and 10. Because the model neurons with the most rapid decline in dendritic NaF conductance showed a tendency to fire doublets rather than single spikes, we needed to make additional adjustments to all of the model neurons to find a set of parameter settings that yielded the same baseline behavior for all dendritic NaF distributions and therefore allowed us to directly compare the effects of dendritic NaF on synaptic integration between all models. The parameter adjustments were made subject to two constraints: (1) the final parameter values should not be physiologically unrealistic, and (2) the final model behavior should closely match our slice data. By varying each conductance parameter by small amounts, we found that the following changes from our published model resulted in the required behavior: the density of Kv2 channels was increased from 10 to 20 S/m2, the density of Kv3 channels was reduced from 50 to 40 S/m2, the density of small-conductance calcium-activated potassium (SK) channels in the dendrites was reduced from 0.4 to 0.12 S/m2, the time constant of the fast inactivation gate of the NaF channels was slowed down (initial range, 0.25 to 4 ms, depending on voltage; final range, 0.3 to 16 ms, depending on voltage), and the density multipliers that caused the axon initial segment and nodes to have elevated channel densities compared to the soma were reduced from 40 to 3.5 for sodium channels and from 40 to 5 for potassium channels. The reduced sodium conductance density in the axon initial segment was 1750 pS/μm2, which was sufficient to support axonal action potential initiation in this model. Although modeling studies have often used much higher values, a recent experimental and modeling study of initial segment sodium channels found that a density of 2500 pS/μm2 provided a good match to the experimental data in neocortical pyramidal neurons (Kole et al., 2008). Another recent study of neocortical pyramidal neurons found that the density of delayed rectifier potassium current increased fivefold from the soma to the proximal initial segment, and 10-fold from the soma to the distal initial segment in that cell type (Kole et al., 2007). The final channel densities are listed in Table 1, and the parameters and equations governing channel kinetics and voltage or calcium dependence are listed in supplemental Tables S1 and S2 (available at www.jneurosci.org as supplemental material).
Table 1.
Ion channel densities in the model GP neurons used in this study
| Channel | Soma (S/m2) | Dendrite (S/m2) | Axona (S/m2) |
|---|---|---|---|
| NaF | 500 | 500b | 1750 |
| NaP | 1.015 | 1.523 | 3.55 |
| Kv2 | 20 | 20 | 100 |
| Kv3 | 40 | 40 | 200 |
| Kv4c | 50 | 100 | 500 |
| KCNQ | 2 | 2 | 10 |
| CaHVA | 0.3 | 0.3d | 0 |
| SK | 64 | 0.12 | 0 |
| HCNe | 0.7 | 0.7 | 0 |
aAxonal channels were present in the initial segment and internodal segments only.
bRefers to the model with uniform dendritic gNaF.
cForty percent rapidly inactivating, 60% slowly inactivating.
dRefers to the largest-diameter dendrites.
eNaP, Persistent sodium channel; CaHVA, high-threshold voltage-activated calcium channel; HCN, hyperpolarization-activated cyclic nucleotide-gated channel.
Simplified two-channel model construction.
The models described above contained a large number of ion channels because of experimental evidence that all of those channel types are expressed in rat GP neurons. Although using such a complex model has the obvious benefit of incorporating known features of the real biological system, it also introduces the question of whether the results we observed are limited to the complex ion channel context that we used, or whether the results are more broadly applicable. To address this question, we generated an additional set of models that contained the minimal set of ion channels necessary to examine the effect of dendritic sodium spiking on synaptic integration: fast sodium channels and delayed rectifier potassium channels. Although the specific details of GP neuron physiology (e.g., the precise shapes of action potentials, afterhyperpolarizations (AHPs), and the relationship between the output firing rate and the amount of injected DC current) were not matched as well in these simpler models, reasonable spiking behavior was observed across the range of conditions we tested using the channel densities shown in Table 2.
Table 2.
Ion channel densities in the simplified two-channel models
aAxonal channels were present in the initial segment and internodal segments only.
bRefers to the model with uniform dendritic gNaF.
Synaptic conductances.
Two different types of synaptic inputs were simulated, both using α function conductance waveforms: excitatory inputs modeled to resemble AMPA-type glutamate receptor conductances (1 ms rise time; 3 ms decay time), and inhibitory inputs modeled to resemble GABAA receptor conductances (1 ms rise time; 12 ms decay time). Unitary synaptic events had peak conductance amplitudes of 250 pS for all synapses (both AMPA and GABA). Simulated excitatory inputs did not include an NMDA component because, despite the presence of NMDA receptors on pallidal neurons (Paquet and Smith, 1996; Bernard and Bolam, 1998), no functional NMDA component was observed in the STN driven excitation of rat pallidal neurons (Soltis et al., 1994).
Background synaptic activity.
For all simulations involving synaptic input, randomly timed “background” synaptic conductances (both AMPA and GABA) were uniformly distributed throughout the dendritic tree. The use of a uniform dendritic synapse distribution is a model assumption, but is consistent with anatomical studies showing that beyond the first 10–20 micrometers of primary dendrite, almost the entire dendritic membrane surface is covered with a dense lattice of mostly GABAergic and glutamatergic synaptic inputs, with GABAergic inputs outnumbering their glutamatergic counterparts by a factor of six to eight (Falls et al., 1983; Shink and Smith, 1995). The dendritic compartments in the model were not all the same size, so uniform synapse distributions were implemented by making each compartment receive background synaptic input at rates that were proportional to the compartment's membrane surface area. The mean background synaptic conductance density of each synapse type (AMPA or GABA) was therefore uniform across all dendritic compartments. The GENESIS “synchan” element that was used to simulate synaptic events is nonsaturating; i.e., conductances from high frequency inputs add linearly. For computational efficiency, each compartment of the model was given one inhibitory and one excitatory synchan input element, each of which simulated a population of biological synapses converging on the membrane area given by the compartment. As a result, different compartments received different background input rates, and we used the total synaptic input rate for the whole dendritic tree as a measure of input rate.
Number of background synapses simulated.
To our knowledge, the total number of synapses a typical rat GP neuron receives has not been determined precisely. However, Falls et al. (1983) fully reconstructed two of the main dendrites from a single rat GP neuron using serial thin sectioning and then classified and counted the synaptic boutons for each dendrite. For the GP neuron in their study, each 10 μm of dendrite received on average ∼20 terminals matching the anatomical profile of the known GABA inputs to GP and ∼3 terminals matching the profile of glutamatergic inputs to GP. Applying this estimate to the GP neuron model used in the present study, the entire dendritic tree should incorporate ∼5400 GABA and ∼800 glutamate terminals. Thus, to put our simulated synaptic background into a physiological context, the average firing rate for individual background excitatory inputs can be approximated as the total excitatory input rate divided by 800, and the average firing rate of individual inhibitory inputs can be approximated as the total inhibitory input rate divided by 5400. In figure legends where we describe the background activity level, we use these numbers to generate the “per synapse” rates that are reported.
Synapse test groups.
In some simulations, a group of 10 new synapses (sometimes AMPA, sometimes GABA, but never a mixture) would be added to the model in addition to the uniform synaptic background to investigate the effects of input synchrony on model neuron output spiking. Each of the 10 was placed in a different dendritic compartment, and all 10 had the same average firing rate (20 Hz for AMPA synapses; 5 Hz for GABA synapses) regardless of compartment surface area, because they were intended to represent 10 specific synaptic inputs rather than a homogeneous background population. The 10 synapses still had random activation timing (as opposed to periodic or bursting, for example), but in some simulations they all shared the same random activation times (“synchronous” case), whereas in other simulations their activity was both random and uncorrelated (“asynchronous” case). Synapse groups had three defining attributes: synapse type (AMPA, GABA), proximity to the soma in electrotonic length units (proximal, 0.1–0.25 λ; midproximal, 0.3–0.45 λ; mid-distal, 0.5–0.65 λ; and distal, ≥0.7 λ), and proximity between group members (clustered, dispersed). There was never more than one synapse group active during a given simulation, so they were considered in isolation from one another. However, the usual randomly timed, uniformly distributed background synaptic activity was present during all synapse group simulations, with the balance of AMPA and GABA background activity adjusted to make each model neuron fire at 25 Hz before any groups were activated. It is important to point out that the way we modeled synchrony in this study—by linking together 10 synapses into a single functional unit—presents a computationally convenient way of using a minimum of free parameters to study postsynaptic synchrony detection and is not linked to a particular physiological mechanism. By linking together a group of synapses for the duration of a whole simulation, we were able to assess how well synchronous events would be detected by the postsynaptic neuron on average, as a function of the location and intersynapse distance of the group, the type of synapses represented, and the dendritic NaF level of the target neuron. Biologically, synchronous inputs could arise from different mechanisms, such as synchronization among STN neurons, single STN axons forming multiple synaptic contacts within a small dendritic region of GP neurons, or random coincidences during STN bursts. To study the detailed possibilities of such mechanisms is beyond the scope of the present study. We did ascertain, however, that a random scatter of synchronous events within a 3–5 ms window yields qualitatively similar results.
Data analysis.
Simulation data were analyzed using Matlab (MathWorks). To quantitatively compare synaptic efficacy (i.e., the ability of a synapse to influence the timing and probability of output spiking) for different dendritic locations and different input conditions, we used an information-theoretic approach called the synaptic information efficacy (SIE) measure (London et al., 2002). This is a measure of mutual information between two spike trains—a synaptic input event train and a neural output spike train in our case. Essentially, the SIE provides a straightforward estimate of how much predictive information each synapse's event train provides about the timing and number of postsynaptic spikes. The SIE uses the context tree weighting algorithm for entropy estimation (Willems et al., 1995), which compares favorably with several other methods of entropy estimation (Kennel et al., 2005; Shlens et al., 2007) and involves only two free parameters: the bin width used to convert voltage traces into binned spike-time vectors and the depth of the context tree (the number of bins before any given time step that are considered to be potentially information-containing). The SIE for each synapse was computed using a C++ program (by J.R.E.) that could be called from Matlab. Since the SIE has an inherent undersampling problem that causes uncorrelated spike trains to have negative mutual information rates on average, we used the correction method proposed by London et al. (2008) whereby the entropy of the spike train by itself is replaced with the average conditional entropy of the spike train given shuffled versions of the synaptic event time vector. Therefore, rather than using the standard equation for mutual information,
 |
where X is the binned spike train, Y is the binned synaptic event train, H(X) denotes the estimated entropy of X, and H(X|Y) denotes the conditional entropy of X given knowledge of Y, we used the following modified version:
 |
where Yscrbi is the ith scrambled version of the synaptic event train Y, and N = 20 shuffled versions. For all SIE calculations, the bin width was 3 ms, and the tree depth was 33 bins, meaning that the SIE will reflect the effects that the synapse had on spiking output within 99 ms of activation. Tree depth values ranging from 2 to 35 bins were tested with a subset of the data, and the SIE was found to approach its maximum by depths of 15–18 bins with the test data. The SIE measurements of single synapses were done using 1000 s of simulation data, whereas the SIE measurements of synchronous synapse clusters used 100 s of simulation data.
All statistical tests were nonparametric and were computed using the Matlab Statistics Toolbox. Comparisons between unpaired data sets were done with the Kruskal–Wallis (KW) one-way ANOVA followed by pairwise comparisons with Mann–Whitney U test. Paired data sets were evaluated using the Wilcoxon signed-rank (WSR) test. For correlations, we used Spearman's rank correlation coefficient. The criterion for significance was 0.05 and was adjusted for multiple comparisons using the Bonferroni correction.
Model sharing.
All models used to create the data described in this study are available online in the NeuronDB (http://senselab.med.yale.edu/NeuronDB/) database after acceptance of this publication.
Results
Models with widely varying dendritic NaF conductance levels can produce similar electrophysiological properties with somatic input
To study the impact of dendritic NaF channels on synaptic integration, we began with a GP neuron model that had uniformly high gNaF throughout the soma and dendrites (Günay et al., 2008) and made comparison models by reducing the dendritic gNaF level in one of two ways: either the density was reduced uniformly throughout the dendritic tree or else it declined in a proximal-to-distal gradient of varying steepness. The quantitative distribution of NaF channels in GP dendrites is not known, but estimates of the dendritic gNaF distribution in other neuron types (for review, see Migliore and Shepherd, 2002; Waters et al., 2005; Sjostrom et al., 2008) have found either approximately uniform expression levels (Stuart and Sakmann, 1994; Magee and Johnston, 1995; Bischofberger and Jonas, 1997; Martina et al., 2000) or else a declining gNaF gradient when moving from proximal to distal dendrites (Jaffe et al., 1992; Stuart and Hausser, 1994; Buzsaki et al., 1996; Williams and Stuart, 2000; Keren et al., 2005; Acker and Antic, 2009).
With a uniform density, we consistently found that once the dendritic gNaF level was too low to support dendritic spike initiation, the basic electrophysiological characteristics of the model (action potential shape and firing pattern at different current injection levels) became abnormal compared to the neurons in our slice electrophysiology database (Günay et al., 2008). In particular, spike doublets and multiples were prominent in the spike pattern, and the spikes became abnormally broad and irregular in shape (data not shown). This abnormal spiking behavior could not be counteracted by any reasonable small changes to other model parameters.
With declining gNaF gradients of varying steepness (Fig. 1B), the cumulative total gNaF for all dendritic compartments ranged from 3.7 to 0.09 μS, a 41-fold difference across the nine models (Fig. 1C). In the model neuron with uniformly high dendritic gNaF, backpropagating action potentials (bAPs) traveled throughout the dendritic tree at full amplitude; by contrast, model neurons with declining gNaF gradients all showed some loss of bAP amplitude over distance, with the degree of bAP decay being proportional to the steepness of the gNaF gradient (Fig. 1D).
As shown in Figure 2, using declining gNaF gradients produced a set of model neurons for which important electrophysiological properties (spike height and width; spontaneous firing rate; frequency-current response curves for somatic current injections) were within a realistic range for all models after small changes to some parameters of our published base model (Günay et al., 2008) were made (see Materials and Methods). From the perspective of a somatic current injection electrode, therefore, a neuron with a high density of NaF channels expressed throughout the dendritic tree can have about the same intrinsic excitability and spontaneous activity as one with very little dendritic gNaF. The electrophysiological feature that was most obviously affected by the dendritic gNaF density in our model was the AHP depth (Fig. 2B), measured as the difference between the voltage 2 ms before the spike peak and the voltage 10 or 20 ms after the spike peak. At 10 ms after the spike, AHP depths for the nine model neurons ranged from 3.5 to 21.9 mV; at 20 ms, model AHP depths ranged from 8.4 to 20.0 mV. By comparison, the electrophysiological AHPs ranged from 4.9 to 23.4 mV (mean, 15.1 mV) at 10 ms, and from 8.5 to 24.8 mV (mean, 16.8 mV) at 20 ms after the spike peak. Although these results suggest that the variability in GP neuron AHP depths may involve differences in the dendritic gNaF density, multiple parameters are known to influence the AHP depth of the model, particularly the relative densities of the different potassium channels (Günay et al., 2008). Because many parameters can influence the AHP, we do not believe that a GP neuron's dendritic gNaF density can be inferred from its AHP depth.
Figure 2.
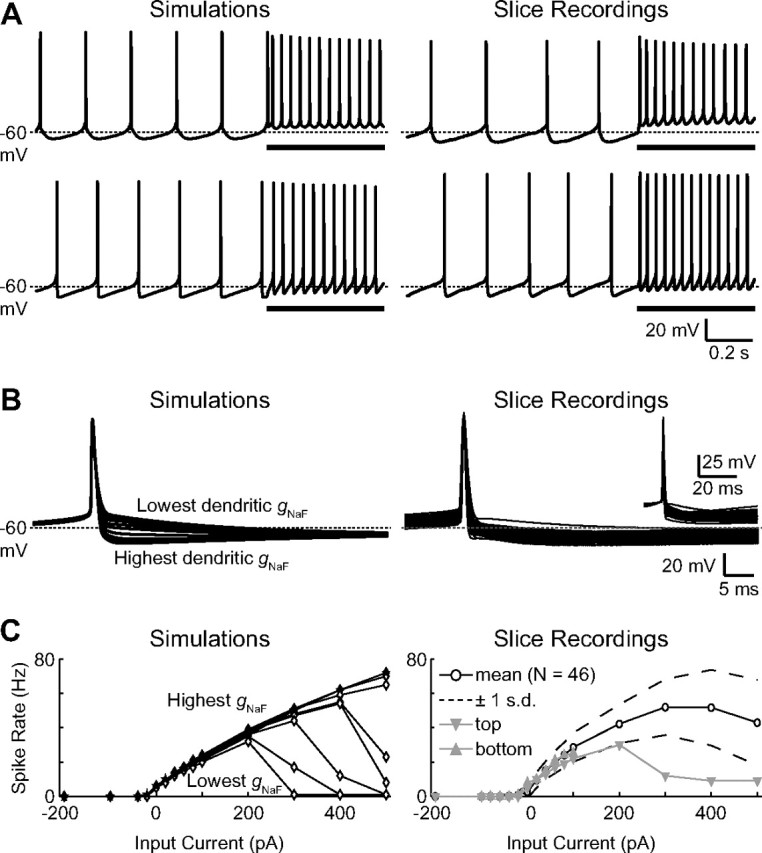
Realistic GP neuron physiology is observed for a wide range of dendritic gNaF levels. A, Simulation traces of spontaneous and current-driven (+100 pA into the soma during the underlined periods) spiking are shown for the model neurons with gNaF gradient constants of 75 μm (top left) and 250 μm (bottom left). The most apparent difference between the two was in the shape of the AHP following each spike. Voltage traces from two GP neuron brain slice recordings are shown (right) simply to illustrate the point that real GP neurons can have more rounded or sharp AHP shapes resembling the different model neurons. B, A comparison of spontaneous spike shapes between all of the model neurons revealed a direct connection between the dendritic gNaF level and the depth of the spike AHP, with a higher dendritic gNaF level resulting in a deeper spike AHP (left). Slice recordings of spontaneous action potentials from 46 GP neurons show that the set of model neurons spanned the whole range of typical GP neuron variability in this characteristic (right; to show AHP variability more directly, the inset shows the same traces vertically shifted so that all were at −50 mV 2 ms before the peak of the spike). C, The frequency responses of the nine model neurons to somatic current injections were very similar for current amplitudes between −200 and +200 pA (left). For larger positive current injections, model neurons with lower dendritic gNaF were more prone to depolarization block. GP neurons from slice recordings showed a similar average frequency-current response and also varied in their tendency to enter depolarization block at higher current levels (right). Some recordings do not show data points above +100 pA current injection because such data were not obtained for these neurons.
Dendritic NaF channels selectively enhanced sensitivity to excitatory synaptic inputs
To compare synaptic integration across the models, we first addressed the question of how dendritic NaF channels would affect the rate-coding properties of GP neurons under high conductance input conditions consisting of continuous, random synaptic activation. We expected that higher levels of dendritic gNaF would increase the responsiveness to excitation since NaF channels produce depolarization-activated inward currents. Previous studies have already demonstrated that NaF channels can increase excitatory input responses, both through the triggering of local action potentials and through subthreshold boosting of EPSPs (Lipowsky et al., 1996; Oviedo and Reyes, 2002; Williams and Stuart, 2003; Gasparini et al., 2004; Gulledge et al., 2005; London and Hausser, 2005; Sjostrom et al., 2008). Less well understood is the role of NaF channels in shaping responses to inhibition, and this is a particularly important issue for GP neurons because most of their synaptic inputs are inhibitory connections from the striatum (Smith et al., 1998). To address the role of NaF in the context of mixed striatal inhibition and STN excitation, we measured model neuron output rates while varying the frequencies of the excitatory and inhibitory synaptic inputs. Both input types were uniformly distributed throughout the dendritic tree (see Materials and Methods). As expected, plots of output frequency versus input frequency (fout/Fin curves) for excitatory synapses were clearly affected by the amount of dendritic gNaF (Fig. 3A–C). As more NaF channels were added to the dendrites, the fout/Fin curves for excitation became steeper, and this was true both in the absence (Fig. 3A) and in the presence (B,C) of inhibition. Therefore, regulating the expression density of dendritic NaF channels would provide a simple means of adjusting the gain of the rate curve for synaptic excitation. Furthermore, the rate effects of dendritic gNaF were mostly specific to excitation, with only minor effects on the inhibitory responsiveness of the model neurons (Fig. 3D–F). When differences in the initial firing rates were taken into account (insets in Fig. 3D,E, insets), the inhibitory fout/Fin curves were almost identical across models, meaning that a given amount of inhibition produced about the same decrease in the firing rate regardless of the dendritic gNaF expression level. A notable exception to this statement is highlighted by the arrow in Figure 3F: when excitation was present, the inhibitory fout/Fin plots for the high-gNaF models were steeper at high spike rates and shallower at low spike rates, whereas the curves for the low-gNaF models were approximately linear whether excitation was present or not. This means that high-gNaF models allowed an extended regime of very slow firing rates and stopped spiking altogether only at very high levels of inhibition.
Figure 3.
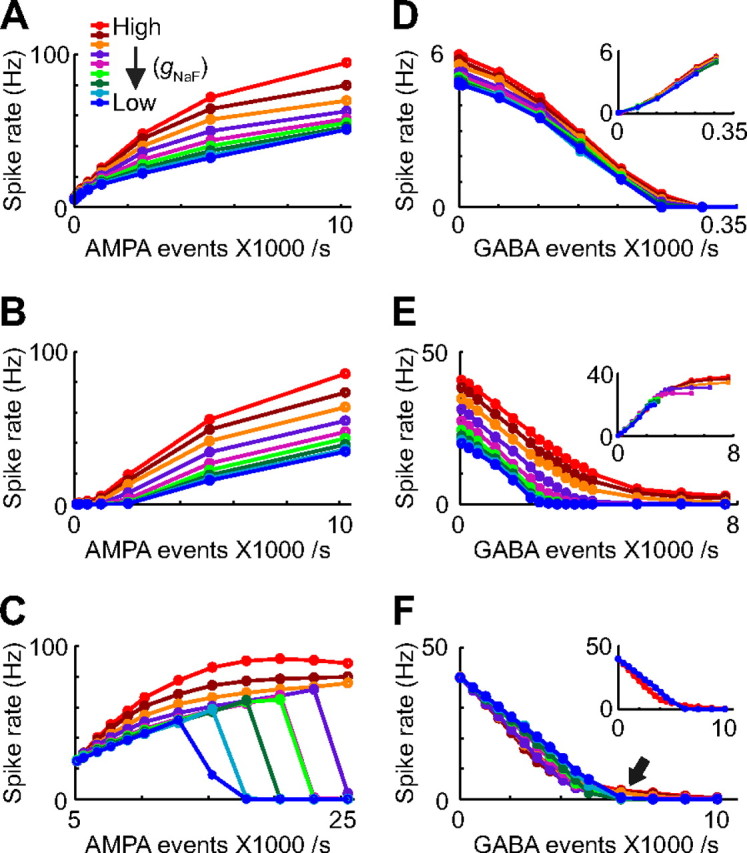
A–F, Rate-based input-output curves for background excitation (A–C) and inhibition (D–F) demonstrate a selective effect of dendritic sodium channels on excitatory input transfer. Whether there was no inhibition (A), a fixed level of inhibition common to all model neurons (B; 2555 total inhibitory inputs per second, 0.5 Hz per biological synapse; see Materials and Methods), or inhibition that increased in tandem with the dendritic gNaF level (C; inhibition rates were set independently for each model to achieve an output spike rate of 25 Hz; the excitation rate was 5110 events per second, 6.4 Hz per synapse), sensitivity to excitatory input was enhanced by dendritic NaF channels. By contrast, the influence of inhibition was very similar across model neurons whether there was no excitation (D), a fixed level of excitation (E; 2044 events per second; 2.6 Hz per synapse for all models), or variable levels of excitation adjusted so that all model neurons initially fired at 40 Hz (F). The insets in D and E show the same data plotted as the decrease in rate relative to the initial rate (at 0 inhibition), illustrating that inhibition was affecting all of the models about the same. The inset in F shows the same data as the main panel, but only for the models with the highest (red) and lowest (blue) dendritic gNaF levels.
Dendritic NaF channels increased spike timing variability and enabled dendritic spike initiation under realistic input conditions
While characterizing the rate-coding properties of the different model neurons, we observed that the models with more dendritic gNaF appeared to have greater variability in their spike timing compared to the low-gNaF models (Fig. 4). Neurons in vivo typically have high variability in their interspike interval distributions, and both the mechanisms producing this variability and the implications for neural coding have been the subject of considerable interest (Softky and Koch, 1993; Shadlen and Newsome, 1998; Kostal et al., 2007). GP neurons act as autonomous pacemakers in vitro, spiking with a high degree of regularity that involves the combined actions of sodium channels (Mercer et al., 2007), hyperpolarization-activated cyclic nucleotide-gated channels (Chan et al., 2004), and SK channels (Deister et al., 2009). In vivo, monkey GPe neurons showed a regular spiking pattern after an infusion of glutamate and GABA receptor antagonists (Kita et al., 2004), and rat GP neurons fire at regular intervals under urethane anesthesia (Magill et al., 2000; Mallet et al., 2008a). However, GP neurons fire with irregular timing both in awake primates (Delong, 1971; Raz et al., 2000; Kita et al., 2004) and awake rodents (Urbain et al., 2000; Burkhardt et al., 2007), indicating that synaptic input normally dominates over the intrinsic pacemaker mechanism in controlling spike timing.
Figure 4.
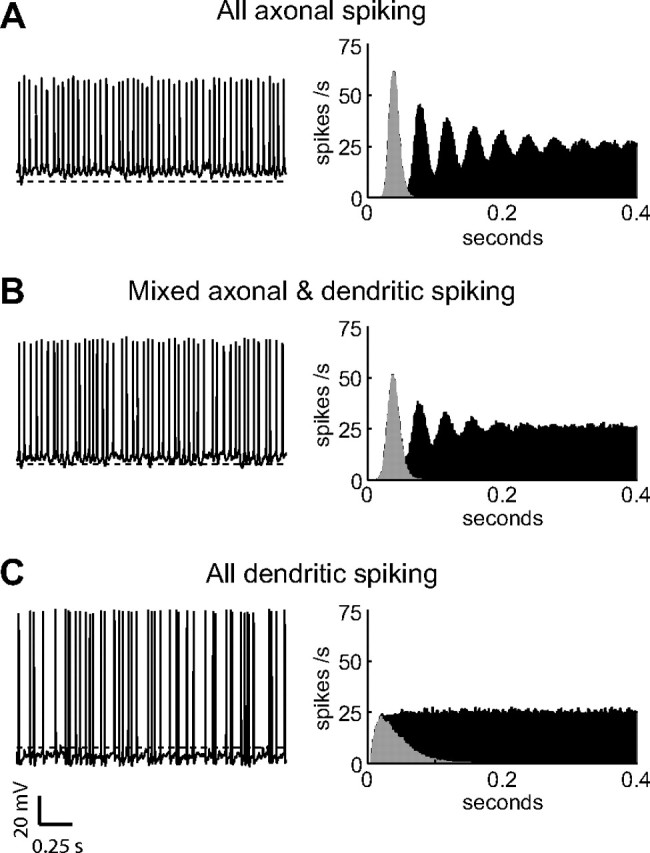
A–C, Simulated voltage traces are shown from three of the model neurons: the model with the lowest dendritic gNaF, in which action potential initiation occurred exclusively in the axon initial segment (A); a model with an intermediate level of dendritic gNaF, which showed a mixture of axonal and dendritic initiation (B); and the uniform dendritic gNaF model, in which spike initiation was almost exclusively dendritic (C). Traces are from simulations where all three models received the same background excitatory input (5110 events per second, 6.4 Hz per biological synapse; see Materials and Methods) while the background inhibitory input rate was adjusted independently for each to attain an output spike rate of 25 Hz. The inhibition rates used were 1150 events per second (0.2 Hz per synapse) for the axonal-spiking model, 2146 events per second (0.4 Hz per synapse) for the mixed-spiking model, and 6720 events per second (1.2 Hz per synapse) for the dendritic-spiking model. The average membrane potential values for the three simulations were −49.2, −52.3, and −63.5 mV. The dashed line in each is at −60 mV. The differences in spike timing variability between the models are readily apparent in the ISI distributions (gray) and autocorrelation histograms (black) shown on the right.
To quantify the differences between the model neurons with respect to spike timing irregularity, we used the coefficient of variation (CV) of the interspike interval distribution. For each model, we varied either the rate of inhibitory (Fig. 5A–D) or excitatory (Fig. 5E–H) synaptic input to make all of the models fire at the same spike rate. As expected from the rate-coding results, model neurons with less dendritic gNaF always required higher excitation-to-inhibition ratios to have the same spike rates as model neurons with more dendritic gNaF (Fig. 5A,E). This meant that in simulations where the inhibitory input rate was adjusted to achieve a specified spike rate, models with less dendritic gNaF received less inhibitory conductance and therefore less total synaptic conductance than their counterparts with high dendritic gNaF (Fig. 5B). Conversely, adjusting excitation to match the spike rates required that models with low dendritic gNaF received the most excitatory input, and therefore the most total synaptic conductance (Fig. 5F). It would be expected that greater amounts of synaptic conductance would be better able to override the intrinsic pacemaker mechanism and control spike timing, resulting in greater spiking variability. Nevertheless, spike timing variability was greatest for the model neurons with the most dendritic gNaF regardless of whether they received the most synaptic input (Fig. 5C) or the least (Fig. 5G). This finding indicates that dendritic NaF channel expression increases spike timing variability over a wide range of input conditions, indicating that dendritic NaF channels likely contribute to the high CV values typically observed in GP neurons in vivo.
Figure 5.
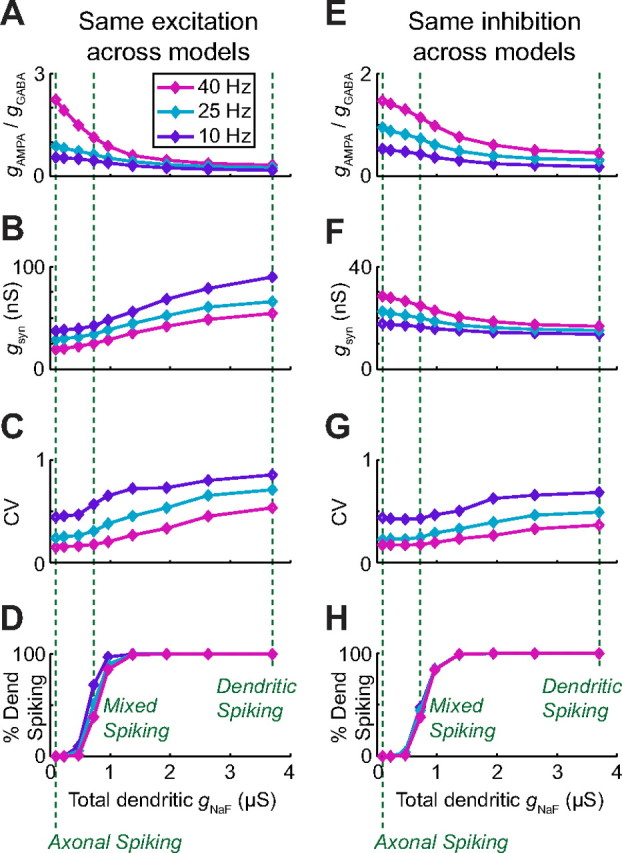
Dendritic sodium channels enhance spike-time variability across a wide range of high-conductance input conditions. For each of the nine model neurons, excitatory and inhibitory synapses were uniformly distributed in all dendritic compartments and activated randomly. A–D, In some simulations, the excitatory rate was the same for all models (10,220 synaptic events per second, 13 Hz per biological synapse; see Materials and Methods) while inhibition was varied independently for each model neuron to achieve output spike rates of 10, 25, and 40 Hz. E–H, In a different set of simulations, the model neurons all received identical inhibition (3066 events per second; 0.6 Hz per synapse), while excitation was adjusted independently to reach the same output rates. In both cases the ratio of excitatory to inhibitory conductance that gave the desired output spike rate was inversely related to the dendritic gNaF (A, E). As a result, when excitation was the same for all models, those with more dendritic gNaF required much more total synaptic conductance to achieve a specified spike rate because they received more inhibition (B). When inhibition was kept the same for all models, those with less dendritic gNaF received the most total synaptic conductance, because they required more excitation (F). Despite the large differences in input conditions between these two sets of simulations, the model neurons with the highest gNaF levels always had the highest variance in their spike timing as measured by the coefficient of variation of the interspike interval distribution (C, G). For both sets of simulations, the percentage of somatic action potentials that initiated in the dendrites as opposed to the axon of each model neuron was only moderately affected by the input conditions, and the nine model neurons spanned the whole range from purely axonal spike initiation to 100% dendritic spike initiation (D, H). Three of the nine model neurons (vertical dashed lines; same models as shown in Fig. 4) were selected to represent different spike initiation cases for additional analysis: one with purely axonal spike initiation, one with a mixture of axonal and dendritic spike initiation, and one with 100% dendritic spike initiation.
One way that dendritic NaF channels could increase spike timing variability during synaptic bombardment would be by shifting spike initiation from the axon to multiple dendritic locations. This is because dendritic synaptic potentials reach the axon in a filtered and globally averaged form, making it more difficult for random events involving small numbers of inputs to influence spike timing. As shown in Figure 5, D and H, the percentage of output spikes that initiated in the dendrites differed greatly across the model neurons, ranging from 0 to 100%. Furthermore, the relationship between spike timing variability and dendritic gNaF became noticeably steeper where spike initiation began to shift from axonal to dendritic. Spike timing variability did continue to increase even after dendritic spiking was saturated at 100%, showing that variability was not a simple function of dendritic spiking. This is not surprising, because even when all spikes initiate in the dendrites, adding more NaF channels would still make it easier for a small number of localized excitatory events to trigger a spike. With stochastic inputs like those simulated here, the variability of the summed synaptic conductance decreases as the number of synaptic inputs increases (supplemental Fig. S1, available at www.jneurosci.org as supplemental material). As a result, having spike initiation depend on a smaller number of inputs would be expected to increase spike timing variability.
The results described thus far have focused on general response properties of the model neurons (rate-coding functions, timing variability, and axonal versus dendritic spike initiation) in response to continuous, uniformly distributed, randomly timed input trains that were devoid of any particular spatial or temporal patterns. We next wanted to investigate the relationship between a synapse's location and its effectiveness at driving spiking in the model GP neurons. For this analysis we selected three model neurons that spanned the whole range of dendritic gNaF levels and also represented three different types of spike initiation: purely axonal spiking, mixed axonal and dendritic spiking, and purely dendritic spiking (Fig. 5, green dashed lines).
Dendritic NaF channels increased the importance of distal dendrites
GP dendrites are notable for their length, sparse branching, and submicron diameters. In a previous study, we predicted that because of these properties, distal excitatory synapses will have little impact on GP neuron output unless they can initiate local dendritic spikes (Hanson et al., 2004). To quantitatively evaluate the relationship between the location of an input and its effectiveness in the three selected model neurons, we used an information-theoretic analysis (London et al., 2002) to estimate the efficacy of each input location (i.e., the ability of input events to influence the timing and probability of output spiking) (see Materials and Methods) during long simulations. One major advantage of the information rate as a measure of synaptic efficacy is that the same calculation can be applied to both excitatory and inhibitory inputs. When the information rates of all locations for AMPA inputs were plotted versus distance from the soma (Fig. 6A), it was clear that adding dendritic NaF channels had switched the location bias of the model neuron from proximal (A1) to intermediate (A2) to distal (A3). This is in agreement with research findings from other types of neurons (Williams and Stuart, 2002; Rudolph and Destexhe, 2003; Komendantov and Ascoli, 2009). Interestingly, increasing the amount of dendritic gNaF caused very similar shifts in the location bias for GABA inputs as for AMPA inputs (Fig. 6B). The similarity in location dependence for AMPA and GABA inputs is illustrated in Figure 6C, which, for each model neuron, shows the 50 most effective AMPA and GABA input locations. As the dendritic gNaF density became high enough to support initiation of dendritic spikes in certain branches, both the excitatory and inhibitory inputs to those regions of the dendrite gained importance because they collectively determined whether a local spike would be triggered. For GP neurons, which have long dendrites that extend orthogonally with respect to the topographically arranged striatal inputs, the effect of adding dendritic NaF channels as we have done here would be to shift the response field of the neuron away from the perisomatic inputs and out toward the distal inputs, fundamentally changing the topographical arrangement of the network.
Figure 6.
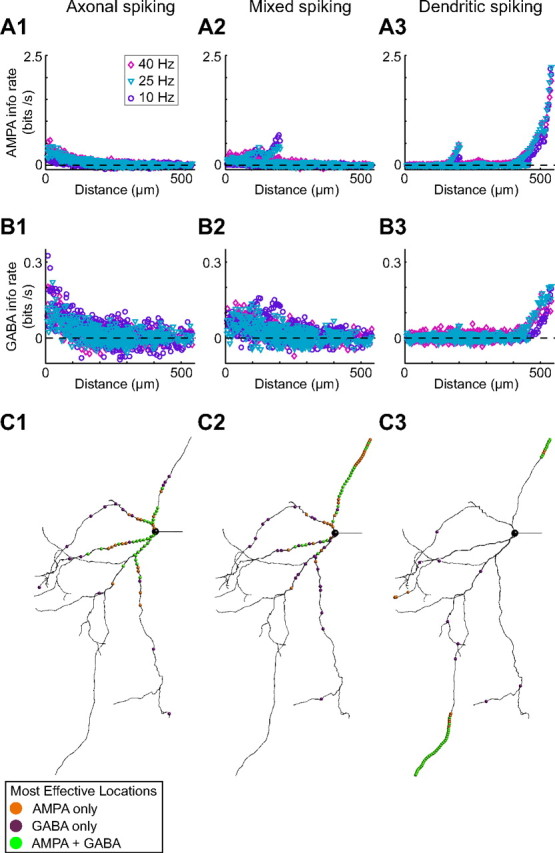
Dendritic NaF channels enhance the efficacy of distal locations for both AMPA and GABA inputs. Mutual information rates were estimated for the background AMPA and GABA inputs in each dendritic compartment while all input events occurred randomly (see Materials and Methods). For each model, information rates at each input location were compared at three different levels of inhibition yielding three different output spike rates: 10, 25, and 40 Hz. A1, B1, For the axonal-spiking model, the inputs that had the greatest effect on output spiking were consistently those closest to the soma, and this was true for both AMPA and GABA inputs. A2, B2, For the mixed-spiking model, there was still a clear preference for proximal locations over distal ones, but the most effective AMPA inputs were on a single dendritic branch between 150 and 200 μm from the soma. A3; B3, The dendritic-spiking model showed the opposite relationship between location and efficacy: the most distal locations were by far the most effective at controlling output, and this was true for both AMPA and GABA inputs. C, For the medium inhibition simulations (25 Hz output spiking), the 50 compartments with the greatest mutual information rates are highlighted by colored spheres to show where they were located on the dendritic tree. For each model neuron, the dendritic compartments where AMPA inputs were most effective tended to be the same compartments where GABA inputs were most effective. In the axonal-spiking model (C1), 33 of the top 50 AMPA input locations were colocalized with a top-50 GABA input location. For the mixed-spiking (C2) and dendritic-spiking (C3) models, the top 50 AMPA and GABA input locations were colocalized in 23 and 40 cases, respectively. The background excitation rate was fixed at 10,220 events per second (13 Hz per biological synapse; see Materials and Methods) for all simulations while the background inhibition rate was varied for each model to obtain the three target spike rates. For the axonal spiking model, the background inhibition rates that produced 10, 25, and 40 Hz output were as follows: 6388 events per second (1.2 Hz per synapse), 4037 events per second (0.75 Hz per synapse), and 1584 events per second (0.3 Hz per synapse). For the mixed spiking model, the background inhibition rates were 7742 events per second (1.4 Hz per synapse), 5544 events per second (1.0 Hz per synapse), and 3117 events per second (0.6 Hz per synapse). For the dendritic spiking model, the background inhibition rates were 20,312 events per second (3.76 Hz per synapse), 13,976 events per second (2.6 Hz per synapse), and 10,884 events per second (2.0 Hz per synapse).
Dendritic NaF channels caused high sensitivity to clustered synchronous excitation
In pyramidal neurons, dendritic NaF channels act as local coincidence detectors by preferentially amplifying spatially clustered and temporally synchronous excitatory inputs (Mel, 1993; Gasparini et al., 2004; Gasparini and Magee, 2006; Sjostrom et al., 2008). Responsiveness to input synchrony is highly relevant to this study because GP and STN neurons show abnormally high synchrony in parkinsonian patients (Levy et al., 2002; Silberstein et al., 2003; Kuhn et al., 2005, 2008), monkeys (Nini et al., 1995; Raz et al., 2000; Heimer et al., 2002; Soares et al., 2004), and rats (Sharott et al., 2005; Mallet et al., 2008a,b), We expected that increasing the density of dendritic gNaF in GP neurons would also result in heightened sensitivity to synchronous clustered excitation. However, what effects (if any) increased dendritic gNaF would have on the spatial and temporal integration of multiple inhibitory inputs was unknown. To address this issue within the framework of the GP, we analyzed the impact that small groups of excitatory STN or inhibitory striatal synapses had on the output of the model neurons. Simulations were designed to enable a systematic evaluation of how four different variables—synapse type (AMPA, GABA), position of the synapses relative to the soma, position of the synapses with respect to one another, and dendritic gNaF level of the target neuron—would each influence the way that a GP neuron would respond to synchronous input events embedded in a high-conductance background (see Materials and Methods). For each group, the member synapses were all located a similar distance from the soma (groups were categorized as proximal, midproximal, mid-distal, or distal) (see Materials and Methods) and were either spatially clustered or dispersed relative to one another (Fig. 7A,B). Groups were tested one at a time on a background of random, spatially uniform synaptic input. For AMPA groups, the summed conductance of the group was <1% of the background synaptic conductance, and for GABA groups it was <2.5% of the background conductance. Our analysis considered all five of the parameters in this set of experiments: dendritic gNaF level, synapse type (AMPA, GABA), distance from the soma (proximal, midproximal, mid-distal, distal), spatial pattern (clustered, dispersed), and timing (asynchronous, synchronous).
Figure 7.
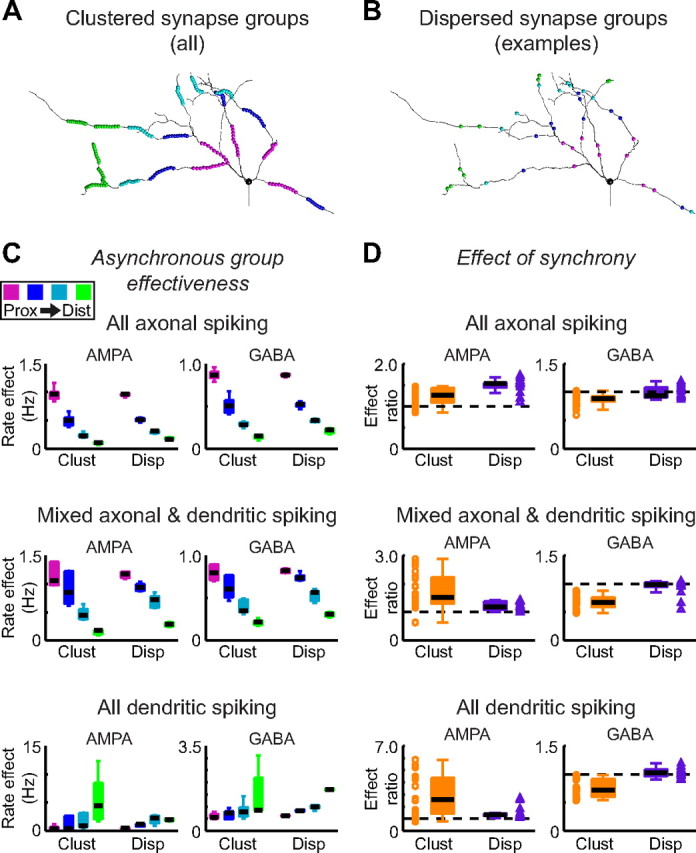
A, B, The effects of dendritic sodium channel expression on the integration of multiple synapses was investigated by placing synapses into groups of 10 dendritic compartments that were either spatially clustered on a small region of dendrite (A, all 20 groups shown, each color is a distance range) or dispersed over a wide dendritic area (B, 18 groups total; each color shows a single example group from one distance range). Within each test group, all 10 compartments were at a similar electrotonic distance from the soma (see Materials and Methods). The test groups were composed of excitatory AMPA synapses in some simulations and inhibitory GABA synapses in others. Only one test group was active per simulation, with a high-conductance synaptic background also present. The change in the model's output spike rate when a group was active versus when it was inactive (identical synaptic background still present) was taken as the measure of the group's effectiveness. C, When the 10 synapses in the group were activated at the same rate (AMPA groups, 20 Hz per synapse; GABA groups, 10 Hz per synapse) but with random and uncorrelated timing (“asynchronous” case), the main factors determining the group's effectiveness were its distance from the soma and the dendritic gNaF level of the recipient neuron. In all cases there was a significant (p < 0.01, KW test) effect of distance on group effectiveness, regardless of the synapse type (AMPA, left; GABA, right) or spatial organization (clustered, dispersed). However, there was a clear proximal more than distal bias in the axonal and mixed spiking models and a distal more than proximal bias in the dendritic spiking model, similar to what we observed with individual inputs in Figure 6. There were no significant differences between clustered and dispersed groups of inputs when the synapses were asynchronous. AMPA groups always increased the spike rate, and GABA groups always decreased the spike rate, so the absolute values are plotted to emphasize the similarity of the results for the two types of synapses. D, The effects of input synchrony were tested with each synapse group by having the 10 synapses activated with the same rates as before and with random timing, but with all 10 synapses coactivated at the same random times. The effect of synchrony was then measured as the ratio of the group's effectiveness when synchronous (model spike rate with synchronous group active minus model spike rate with synaptic background only) compared to when asynchronous (values in C); values >1.0 therefore indicate that synchrony enhanced effectiveness, and values <1.0 indicate that synchrony reduced effectiveness. The dashed black line on each plot shows where a ratio of 1.0 would be. Scatter data show all of the data points, whereas the box plots show the median (thick black line), upper, and lower quartiles (box boundaries), and the whiskers extend to the most extreme data point within 1.5 times the interquartile range for each data set. For the groups of AMPA inputs, synchrony significantly increased the effectiveness for all three models and for both clustered and dispersed groups (p < 0.01, WSR test). The largest effects of synchrony were always associated with clustered groups in models that were capable of local dendritic spike initiation, demonstrating a particular sensitivity of dendritic spiking models to clustered, synchronous excitation. In contrast, synchrony significantly reduced the effectiveness of clustered GABA synapse groups in all three models (p < 0.01, WSR test), whereas synchrony did not significantly impact dispersed GABA groups in any of the models. Background synaptic activity levels were adjusted as described for Figure 6 (supplemental Methods, available at www.jneurosci.org as supplemental material).
When the synapses in a group were asynchronously active (Fig. 7C), the primary parameters controlling the group's effectiveness were its distance from the soma and the dendritic gNaF level of the model neuron. These results confirmed the findings described in Figure 6: for excitatory and inhibitory synapses alike, increasing the dendritic gNaF level caused a shift in the spatial bias of the model from strongly proximal-favoring in the axonal spiking model, to more weakly proximal-favoring in the mixed-spiking model, to strongly distal-favoring in the dendritic-spiking model. When the synapses in each group were asynchronous, spatially clustered groups were not significantly different from dispersed groups in their effectiveness on average (KW test); however, the strongest individual asynchronous groups for both AMPA and GABA synapses were all clustered groups in the models with dendritic spiking.
When comparing the synchronous to asynchronous input conditions (Fig. 7D), there were significant effects of synapse type, dendritic gNaF level, and spatial pattern, with interactions between the variables. Excitatory groups were consistently more effective when synchronous than asynchronous (p < 0.01 for both clustered and dispersed groups in all three models, WSR test); but the groups that were most affected were clustered groups in the models capable of dendritic spike initiation. In contrast to the increase of excitatory efficacy caused by synchronicity, inhibitory synapse groups were made significantly less effective by synchrony (p < 0.01 for each model; WSR test), but only when the synapses were clustered together, and especially in models capable of dendritic spike initiation. The dispersed inhibitory groups were not significantly affected by synchrony. Thus, there was a general enhancement of excitatory groups by synchrony and a large additional increase specifically for clustered excitatory groups that could trigger dendritic spikes. For inhibitory groups there was a general weakening caused by synchrony if the members of the group were located close to one another, and this was especially the case where dendritic spike initiation could occur. The link between dendritic spike initiation and group effectiveness is analyzed in further detail in supplemental Fig. S2 (available at www.jneurosci.org as supplemental material). This figure shows that in the models capable of dendritic spike initiation, the most effective AMPA groups caused the largest increases in local dendritic spike initiation (supplemental Fig. S2A, available at www.jneurosci.org as supplemental material), whereas the most effective GABA groups caused the largest decreases in local dendritic spike initiation (supplemental Fig. S2B, available at www.jneurosci.org as supplemental material). Furthermore, GABA groups were more effective at suppressing local dendritic spike initiation when their synapses were asynchronously active (supplemental Fig. S2C, available at www.jneurosci.org as supplemental material).
A last point to emphasize in this section is just how large the effect of synchrony was for clustered excitatory inputs in the models with dendritic spike initiation. The model neurons were firing at 25 Hz with only the background input. Activating a synchronous group of AMPA synapses increased the total AMPA conductance to the model neuron by <2%, and the total combined synaptic conductance by <1%, but increased the output spike rate by >30% in several cases. Furthermore, changing a group from asynchronous to synchronous had absolutely no effect on the total synaptic conductance to the model, and represented an increase in excitatory input synchrony from 0% to only ∼2%, but was able to increase the spike rate by >25% in some instances. The combination of dendritic spike initiation and clustered excitatory inputs firing in synchrony is therefore a special case that can have an enormous impact on the output of a neuron. These results suggest that the most favorable route of synchronization of pallidal networks would be through STN and not striatal inputs.
Simplified two-channel models reproduced the essential results but also showed the importance of ion channel context
The findings described so far can all be definitively attributed to the dendritic NaF channel distribution because that was the only difference between the model neurons that were compared. However, the model neurons contained eight other ion channel types in addition to NaF, and the specific combination of channel density and kinetic parameters that we used undoubtedly influenced the results. To what extent were our findings dependent on the complement of other ion channels present in the models? To address this question, we removed all of the ion channels from the model except for two: NaF and the delayed rectifier Kv2 (see Materials and Methods). Spike shapes, fout/Iin curves, synaptic fout/Fin curves, spike timing variability, and relative dendritic spike initiation for these two-channel models are shown in supplemental Fig. S3 (available at www.jneurosci.org as supplemental material), the responses to groups of synchronous or asynchronous synapses are shown in supplemental Fig. S4 (available at www.jneurosci.org as supplemental material), and correlations comparing the nine-channel models and their two-channel counterparts are shown in supplemental Fig. S5 (available at www.jneurosci.org as supplemental material).
We found that the major conclusions of this study were all valid in the two-channel models. Higher expression levels of dendritic NaF channels again resulted in model neurons that were more responsive to distal input locations of both excitatory and inhibitory character, and acutely sensitive to clustered synchronous excitation (supplemental Fig. S4, available at www.jneurosci.org as supplemental material). For the groups of synapses evaluated in Figure 7, correlation analysis showed that the relative effectiveness of each group was similar in the nine-channel models and their two-channel counterparts across all conditions tested (supplemental Fig. S5, available at www.jneurosci.org as supplemental material).
At the same time, there were some notable differences between the two-channel models and the nine-channel models with respect to the effects of the dendritic gNaF distribution. First, the fout/Iin curves differed much more between the two-channel models and showed an opposite effect of dendritic gNaF: whereas the nine-channel models tended to fire slightly faster with more dendritic gNaF, the two-channel models with the lowest dendritic gNaF level reached the fastest firing rates (compare Fig. 2C, supplemental Fig. S3C, available at www.jneurosci.org as supplemental material). Second, similar to the fout/Iin curves, rate coding of excitatory input showed an opposite effect of dendritic gNaF between the two-channel and nine-channel models: whereas higher dendritic gNaF resulted in steeper rate curves in the nine-channel models, the two-channel models with the lowest dendritic gNaF had the steepest rate curves and reached the highest firing rates (compare Fig. 3A, supplemental Fig. S3D1, available at www.jneurosci.org as supplemental material). Third, whereas the nine-channel models were all quite similar in their rate-coding of inhibitory input, the two-channel models showed a clear dependence of the inhibitory input rate-coding curves on the dendritic gNaF level, with higher dendritic gNaF expression resulting in weaker effects of inhibition on the spike rate (compare Fig. 3F, supplemental Fig. S3D2, available at www.jneurosci.org as supplemental material). Therefore, the conclusions regarding dendritic NaF channels and rate coding of synaptic input are limited to specific ion channel contexts. Finally, the variability of spike timing in the two-channel models did not always increase in parallel with dendritic gNaF, but instead appeared to be more a reflection of the amount of synaptic input received (supplemental Fig. S3E, available at www.jneurosci.org as supplemental material). This can be explained by the fact that NaF and Kv2 both deactivated rapidly after each spike and remained almost completely deactivated until just before the next spike. With only those two channels present, the intrinsic pacemaker mechanism of the models was weaker, and this allowed synaptic input to be the primary determinant of spike timing. These differences between the two-channel models and the more complex models demonstrate that the functional impacts of an ion channel type on a neuron are influenced by dynamical interactions with the other ion channels expressed in the cell (Günay et al., 2008).
Discussion
GP neurons have extended dendritic arbors that span up to one-half the diameter of the GP in rats. In contrast, striatal axons form much smaller disk-shaped axonal arbors, indicating that different portions of each GP neuron will receive input from different striatal regions (Chang et al., 1981; Park et al., 1982; Wilson and Phelan, 1982; Kawaguchi et al., 1990). This organization suggests that widespread convergence may occur at the level of the GP (Percheron et al., 1984; Percheron and Filion, 1991; Yelnik, 2002). The extent of functional convergence, however, would depend on the ability of distal synapses to affect the output spike pattern. This may be possible because of the expression of NaF channels in GP dendrites that allow triggering of dendritic sodium spikes (Hanson et al., 2004).
Important principles of dendritic synaptic integration such as somatic response filtering with electrotonic distance in passive and active dendrites (Rall, 1964; Williams and Stuart, 2003; Hardie and Pearce, 2006) and effective placement and timing of inhibitory inputs (Rall, 1964; Koch et al., 1983; Segev and Parnas, 1983) are well understood for simple input patterns. Our study determined how these established principles lead to the shaping of in vivo-like complex input patterns by dendritic gNaF expression as observed in GP neurons (Hanson et al., 2004). We show that increasing the dendritic gNaF expression level enabled distal excitatory synapses to have a major impact on output spiking, as demonstrated previously in other neuron types (Williams and Stuart, 2002; Rudolph and Destexhe, 2003; Jarsky et al., 2005; Rumsey and Abbott, 2006; Komendantov and Ascoli, 2009). Furthermore, our information-theoretic analysis of the relationship between excitatory and inhibitory input efficacy showed that increasing the dendritic gNaF level enhances the effectiveness of distal inhibitory synapses in parallel with the excitatory synapses through the local control of dendritic spike initiation. These findings are in agreement with previous reports showing that inhibition can regulate dendritic spikes, either by suppressing initiation or by limiting propagation (Mori et al., 1984; Callaway et al., 1995; Kim et al., 1995; Jarsky et al., 2005; Spruston, 2008). In at least one case it was also pointed out that dendritic spiking can enhance the efficacy of distal inhibitory synapses as a result (Mori et al., 1984). In this study, we use mutual information as a functional measure of synaptic efficacy that is based on synaptic control of spiking output and can be applied equally to excitatory or inhibitory inputs, enabling estimation of inhibitory efficacies under complex input conditions where many hundreds of synapses are active and can interact both competitively and cooperatively with each other and with the spike generating mechanism. The results of the present study show that under in vivo-like conditions, the most effective inhibitory synapses are those that are positioned near to the most effective excitatory inputs even with an autonomously firing neuron type. This means that dendritic NaF channels could simultaneously dictate the extent of convergence for both the STN-to-GP and striatum-to-GP connections by determining the diameter of the GP neuron's effective dendritic field.
The expression density of NaF channels in GP dendrites has not been quantitatively determined, but there is reason to believe that it is not a fixed quantity: NaF channels are substrates of multiple kinases and phosphatases that can result in dynamic modulation of peak conductance levels (Cantrell and Catterall, 2001), and their expression can also be modulated by binding with various proteins including calmodulin (Herzog et al., 2003). In some neurons, these mechanisms are known to mediate plasticity of peak NaF conductance in response to neuromodulators including dopamine (Surmeier et al., 1992; Cantrell et al., 1997; Hu et al., 2005), as well as during plasticity of intrinsic excitability induced by correlated presynaptic and postsynaptic activity (Xu et al., 2005). Several factors predict that dendritic NaF channels in GP neurons will be subject to dynamic modulation: (1) NaF channels are preferentially localized at the edges of postsynaptic densities in GP neurons (Hanson et al., 2004), where they can interact with postsynaptic signaling cascades; (2) voltage-gated calcium channels are enriched in the thin dendrites of GP neurons (Hanson and Smith, 2002), allowing for calcium-dependent NaF modulation in response to depolarization; and (3) the presence of multiple NaF channel family members including Nav1.1, Nav1.2, and Nav1.6 in GP dendrites (Hanson et al., 2004) allows for a diversity of potential modulatory pathways and outcomes. It is therefore likely that individual GP neurons will have changing functional levels of dendritic gNaF depending on recent activity, modulatory conditions, or disease states.
An important goal of this study was to answer the question of how the dendritic gNaF expression level affects the overall functioning of GP neurons within the basal ganglia circuit. The impact on the effective dendritic field diameter described above is one important part of the answer, but we also found significant effects of NaF density on the rate-coding properties of the model neurons, their sensitivity to input synchrony, and their spike timing variability. These results suggest that changes in the distribution of dendritic ion channels, and dendritic NaF channels in particular, could contribute more to abnormal network activity patterns than is generally recognized.
From a rate-coding perspective, our results predict that increasing the dendritic gNaF expression level will produce steeper fout/Fin curves for excitation. If input rates remained the same, changes in the dendritic gNaF expression level would proportionally regulate GP firing rates. If input rates changed for a prolonged period, for instance during development or a progressive disease, the dendritic gNaF density could potentially serve as a homeostatic control parameter to help restore an appropriate average GP firing rate. If the dendritic gNaF density were regulated in this manner, however, it would also systematically shift the relative importance of distal versus proximal synaptic inputs, which would likely affect the receptive field organization of GP neurons. In this respect it is interesting that in animal models of parkinsonism, firing rates are significantly decreased in the GP/GPe (Filion and Tremblay, 1991; Soares et al., 2004; Mallet et al., 2008a), and GP neuron passive sensory responses are consistent with enlarged receptive fields (Filion et al., 1988). Homeostatic upregulation of dendritic NaF channels in response to increased inhibition would be consistent with these observations.
Synchronous input events were included in this study because neurons in the GP and STN show increased synchronization in parkinsonian patients (Levy et al., 2002; Silberstein et al., 2003; Kuhn et al., 2005, 2008), monkeys (Nini et al., 1995; Raz et al., 2000; Heimer et al., 2002; Soares et al., 2004), and rats (Sharott et al., 2005; Mallet et al., 2008a,b); but synchronous inputs may also be an important part of normal operation in the STN–GP and striatopallidal connections. The effects of making a small proportion (<2.5%) of the excitatory or inhibitory synaptic inputs fire in precise synchrony were similar across the model neurons with different dendritic NaF gradients with two clear exceptions: when the dendritic gNaF density was high enough to allow dendritic spike initiation, synchrony strongly increased the effectiveness of clustered excitatory synapses and decreased the effectiveness of clustered inhibitory synapses. This finding suggests that an increase in subthalamic input synchrony would be more strongly expressed in GP output firing if the dendritic NaF density was high.
The relationship between clustered synchronous excitation and dendritic spiking has been described previously in pyramidal neurons (Williams and Stuart, 2002; Gasparini et al., 2004; Gasparini and Magee, 2006; Losonczy and Magee, 2006; Sjostrom et al., 2008). To our knowledge, this is the first demonstration of the interaction between dendritic spiking, synchrony, and clustered inhibition. It is impossible to say whether detection of clustered synchronous excitation is an important feature of GP neurons without more detailed knowledge about (1) the quantitative dendritic gNaF density in GP and (2) the spatiotemporal input patterns that single GP neurons receive in vivo, but the way that GP neurons respond to input synchrony is clearly relevant to PD because of the abnormal STN and GP synchronization observed in this disease. Our lab recently showed that with axonal spike initiation, excitatory inputs to distal GP dendrites can have a type II phase response curve because of the activation of dendritic SK channels, and may therefore act to promote synchronization of pallidal networks (Schultheiss et al., 2010). In the present study, we show a second, independent mechanism whereby distal inputs could promote synchronization of GP neurons that share common STN input to the distal dendrites through dendritic spike initiation.
Collectively, the results of this study predict that the expression level of NaF channels in GP dendrites will profoundly influence critical aspects of their function within the basal ganglia circuit—such as firing rate, receptive field size for both excitatory and inhibitory synapses, and sensitivity to synchronous input events—without necessarily having a large impact on the basic electrophysiological properties of the neurons that would be observed with a somatic brain slice recording.
Footnotes
This work was supported by National Institute of Neurological Disorders and Stroke Grants 5R01-NS039852 to D.J. and F32 NS051020 to J.R.E. An initial version of the simplified two-channel model used in this study was constructed by Jason Haensly.
References
- Acker CD, Antic SD. Quantitative assessment of the distributions of membrane conductances involved in action potential backpropagation along basal dendrites. J Neurophysiol. 2009;101:1524–1541. doi: 10.1152/jn.00651.2007. [DOI] [PMC free article] [PubMed] [Google Scholar]
- Bernard V, Bolam JP. Subcellular and subsynaptic distribution of the NR1 subunit of the NMDA receptor in the neostriatum and globus pallidus of the rat: co-localization at synapses with the GluR2/3 subunit of the AMPA receptor. Eur J Neurosci. 1998;10:3721–3736. doi: 10.1046/j.1460-9568.1998.00380.x. [DOI] [PubMed] [Google Scholar]
- Bevan MD, Booth PA, Eaton SA, Bolam JP. Selective innervation of neostriatal interneurons by a subclass of neuron in the globus pallidus of the rat. J Neurosci. 1998;18:9438–9452. doi: 10.1523/JNEUROSCI.18-22-09438.1998. [DOI] [PMC free article] [PubMed] [Google Scholar]
- Bischofberger J, Jonas P. Action potential propagation into the presynaptic dendrites of rat mitral cells. J Physiol. 1997;504:359–365. doi: 10.1111/j.1469-7793.1997.359be.x. [DOI] [PMC free article] [PubMed] [Google Scholar]
- Burkhardt JM, Constantinidis C, Anstrom KK, Roberts DC, Woodward DJ. Synchronous oscillations and phase reorganization in the basal ganglia during akinesia induced by high-dose haloperidol. Eur J Neurosci. 2007;26:1912–1924. doi: 10.1111/j.1460-9568.2007.05813.x. [DOI] [PubMed] [Google Scholar]
- Buzsaki G, Penttonen M, Nadasdy Z, Bragin A. Pattern and inhibition-dependent invasion of pyramidal cell dendrites by fast spikes in the hippocampus in vivo. Proc Natl Acad Sci U S A. 1996;93:9921–9925. doi: 10.1073/pnas.93.18.9921. [DOI] [PMC free article] [PubMed] [Google Scholar]
- Callaway JC, Lasserross N, Ross WN. IPSPs strongly inhibit climbing fiber-activated [Ca2+] increases in the dendrites of cerebellar purkinje neurons. J Neurosci. 1995;15:2777–2787. doi: 10.1523/JNEUROSCI.15-04-02777.1995. [DOI] [PMC free article] [PubMed] [Google Scholar]
- Cantrell AR, Catterall WA. Neuromodulation of Na+ channels: an unexpected form of cellular plasticity. Nat Rev Neurosci. 2001;2:397–407. doi: 10.1038/35077553. [DOI] [PubMed] [Google Scholar]
- Cantrell AR, Smith RD, Goldin AL, Scheuer T, Catterall WA. Dopaminergic modulation of sodium current in hippocampal neurons via cAMP-dependent phosphorylation of specific sites in the sodium channel alpha subunit. J Neurosci. 1997;17:7330–7338. doi: 10.1523/JNEUROSCI.17-19-07330.1997. [DOI] [PMC free article] [PubMed] [Google Scholar]
- Chan CS, Shigemoto R, Mercer JN, Surmeier DJ. HCN2 and HCN1 channels govern the regularity of autonomous pacemaking and synaptic resetting in globus pallidus neurons. J Neurosci. 2004;24:9921–9932. doi: 10.1523/JNEUROSCI.2162-04.2004. [DOI] [PMC free article] [PubMed] [Google Scholar]
- Chang HT, Wilson CJ, Kitai ST. Single neostriatal efferent axons in the globus pallidus: a light and electron microscopic study. Science. 1981;213:915–918. doi: 10.1126/science.7256286. [DOI] [PubMed] [Google Scholar]
- Deister CA, Chan CS, Surmeier DJ, Wilson CJ. Calcium-activated SK channels influence voltage-gated ion channels to determine the precision of firing in globus pallidus neurons. J Neurosci. 2009;29:8452–8461. doi: 10.1523/JNEUROSCI.0576-09.2009. [DOI] [PMC free article] [PubMed] [Google Scholar]
- Delong MR. Activity of pallidal neurons during movement. J Neurophysiol. 1971;34:414–427. doi: 10.1152/jn.1971.34.3.414. [DOI] [PubMed] [Google Scholar]
- Difiglia M, Pasik P, Pasik T. A Golgi and ultrastructural study of the monkey globus pallidus. J Comp Neurol. 1982;212:53–75. doi: 10.1002/cne.902120105. [DOI] [PubMed] [Google Scholar]
- Falls WM, Park MR, Kitai ST. An intracellular HRP study of the rat globus pallidus. II. Fine structural characteristics and synaptic connections of medially located large GP neurons. J Comp Neurol. 1983;221:229–245. doi: 10.1002/cne.902210210. [DOI] [PubMed] [Google Scholar]
- Filion M, Tremblay L. Abnormal spontaneous activity of globus-pallidus neurons in monkeys with MPTP-induced parkinsonism. Brain Res. 1991;547:142–151. [PubMed] [Google Scholar]
- Filion M, Tremblay L, Bedard PJ. Abnormal influences of passive limb movement on the activity of globus pallidus neurons in parkinsonian monkeys. Brain Res. 1988;444:165–176. doi: 10.1016/0006-8993(88)90924-9. [DOI] [PubMed] [Google Scholar]
- Gasparini S, Magee JC. State-dependent dendritic computation in hippocampal CA1 pyramidal neurons. J Neurosci. 2006;26:2088–2100. doi: 10.1523/JNEUROSCI.4428-05.2006. [DOI] [PMC free article] [PubMed] [Google Scholar]
- Gasparini S, Migliore M, Magee JC. On the initiation and propagation of dendritic spikes in CA1 pyramidal neurons. J Neurosci. 2004;24:11046–11056. doi: 10.1523/JNEUROSCI.2520-04.2004. [DOI] [PMC free article] [PubMed] [Google Scholar]
- Gulledge AT, Kampa BM, Stuart GJ. Synaptic integration in dendritic trees. J Neurobiol. 2005;64:75–90. doi: 10.1002/neu.20144. [DOI] [PubMed] [Google Scholar]
- Günay C, Edgerton JR, Jaeger D. Channel density distributions explain spiking variability in the globus pallidus: a combined physiology and computer simulation database approach. J Neurosci. 2008;28:7476–7491. doi: 10.1523/JNEUROSCI.4198-07.2008. [DOI] [PMC free article] [PubMed] [Google Scholar]
- Hanson JE, Smith Y. Subcellular distribution of high-voltage-activated calcium channel subtypes in rat globus pallidus neurons. J Comp Neurol. 2002;442:89–98. doi: 10.1002/cne.10075. [DOI] [PubMed] [Google Scholar]
- Hanson JE, Smith Y, Jaeger D. Sodium channels and dendritic spike initiation at excitatory synapses in globus pallidus neurons. J Neurosci. 2004;24:329–340. doi: 10.1523/JNEUROSCI.3937-03.2004. [DOI] [PMC free article] [PubMed] [Google Scholar]
- Hardie JB, Pearce RA. Active and passive membrane properties and intrinsic kinetics shape synaptic inhibition in hippocampal CA1 pyramidal neurons. J Neurosci. 2006;26:8559–8569. doi: 10.1523/JNEUROSCI.0547-06.2006. [DOI] [PMC free article] [PubMed] [Google Scholar]
- Heimer G, Bar-Gad I, Goldberg JA, Bergman H. Dopamine replacement therapy reverses abnormal synchronization of pallidal neurons in the 1-methyl-4-phenyl-1,2,3,6-tetrahydropyridine primate model of parkinsonism. J Neurosci. 2002;22:7850–7855. doi: 10.1523/JNEUROSCI.22-18-07850.2002. [DOI] [PMC free article] [PubMed] [Google Scholar]
- Herzog RI, Liu CJ, Waxman SG, Cummins TR. Calmodulin binds to the C terminus of sodium channels Na(v)1.4 and Na(v)1.6 and differentially modulates their functional properties. J Neurosci. 2003;23:8261–8270. doi: 10.1523/JNEUROSCI.23-23-08261.2003. [DOI] [PMC free article] [PubMed] [Google Scholar]
- Hu XT, Dong Y, Zhang XF, White FJ. Dopamine D-2 receptor-activated Ca2+ signaling modulates voltage-sensitive sodium currents in rat nucleus accumbens neurons. J Neurophysiol. 2005;93:1406–1417. doi: 10.1152/jn.00771.2004. [DOI] [PubMed] [Google Scholar]
- Jaffe DB, Johnston D, Lasser-Ross N, Lisman JE, Miyakawa H, Ross WN. The spread of Na+ spikes determines the pattern of dendritic Ca2+ entry into hippocampal neurons. Nature. 1992;357:244–246. doi: 10.1038/357244a0. [DOI] [PubMed] [Google Scholar]
- Jarsky T, Roxin A, Kath WL, Spruston N. Conditional dendritic spike propagation following distal synaptic activation of hippocampal CA1 pyramidal neurons. Nat Neurosci. 2005;8:1667–1676. doi: 10.1038/nn1599. [DOI] [PubMed] [Google Scholar]
- Kawaguchi Y, Wilson CJ, Emson PC. Projection subtypes of rat neostriatal matrix cells revealed by intracellular injection of biocytin. J Neurosci. 1990;10:3421–3438. doi: 10.1523/JNEUROSCI.10-10-03421.1990. [DOI] [PMC free article] [PubMed] [Google Scholar]
- Kennel MB, Shlens J, Abarbanel HD, Chichilnisky EJ. Estimating entropy rates with Bayesian confidence intervals. Neural Comput. 2005;17:1531–1576. doi: 10.1162/0899766053723050. [DOI] [PubMed] [Google Scholar]
- Keren N, Peled N, Korngreen A. Constraining compartmental models using multiple voltage recordings and genetic algorithms. J of Neurophysiology. 2005;94:3730–3742. doi: 10.1152/jn.00408.2005. [DOI] [PubMed] [Google Scholar]
- Kim HG, Beierlein M, Connors BW. Inhibitory control of excitable dendrites in neocortex. J Neurophysiol. 1995;74:1810–1814. doi: 10.1152/jn.1995.74.4.1810. [DOI] [PubMed] [Google Scholar]
- Kita H, Kitai ST. The morphology of globus pallidus projection neurons in the rat: an intracellular staining study. Brain Res. 1994;636:308–319. doi: 10.1016/0006-8993(94)91030-8. [DOI] [PubMed] [Google Scholar]
- Kita H, Nambu A, Kaneda K, Tachibana Y, Takada M. Role of ionotropic glutamatergic and GABAergic inputs on the firing activity of neurons in the external pallidum in awake monkeys. J Neurophysiol. 2004;92:3069–3084. doi: 10.1152/jn.00346.2004. [DOI] [PubMed] [Google Scholar]
- Koch C, Poggio T, Torre V. Nonlinear interactions in a dendritic tree: localization, timing, and role in information processing. Proc Natl Acad Sci U S A. 1983;80:2799–2802. doi: 10.1073/pnas.80.9.2799. [DOI] [PMC free article] [PubMed] [Google Scholar]
- Kole MH, Letzkus JJ, Stuart GJ. Axon initial segment Kv1 channels control axonal action potential waveform and synaptic efficacy. Neuron. 2007;55:633–647. doi: 10.1016/j.neuron.2007.07.031. [DOI] [PubMed] [Google Scholar]
- Kole MH, Ilschner SU, Kampa BM, Williams SR, Ruben PC, Stuart GJ. Action potential generation requires a high sodium channel density in the axon initial segment. Nat Neurosci. 2008;11:178–186. doi: 10.1038/nn2040. [DOI] [PubMed] [Google Scholar]
- Komendantov AO, Ascoli GA. Dendritic excitability and neuronal morphology as determinants of synaptic efficacy. J Neurophysiol. 2009;101:1847–1866. doi: 10.1152/jn.01235.2007. [DOI] [PMC free article] [PubMed] [Google Scholar]
- Kostal L, Lansky P, Rospars JP. Neuronal coding and spiking randomness. Eur J Neurosci. 2007;26:2693–2701. doi: 10.1111/j.1460-9568.2007.05880.x. [DOI] [PubMed] [Google Scholar]
- Kuhn AA, Trottenberg T, Kivi A, Kupsch A, Schneider GH, Brown P. The relationship between local field potential and neuronal discharge in the subthalamic nucleus of patients with Parkinson's disease. Exp Neurol. 2005;194:212–220. doi: 10.1016/j.expneurol.2005.02.010. [DOI] [PubMed] [Google Scholar]
- Kuhn AA, Kempf F, Brucke C, Doyle LG, Martinez-Torres I, Pogosyan A, Trottenberg T, Kupsch A, Schneider GH, Hariz MI, Vandenberghe W, Nuttin B, Brown P. High-frequency stimulation of the subthalamic nucleus suppresses oscillatory beta activity in patients with Parkinson's disease in parallel with improvement in motor performance. J Neurosci. 2008;28:6165–6173. doi: 10.1523/JNEUROSCI.0282-08.2008. [DOI] [PMC free article] [PubMed] [Google Scholar]
- Levy R, Ashby P, Hutchison WD, Lang AE, Lozano AM, Dostrovsky JO. Dependence of subthalamic nucleus oscillations on movement and dopamine in Parkinson's disease. Brain. 2002;125:1196–1209. doi: 10.1093/brain/awf128. [DOI] [PubMed] [Google Scholar]
- Lipowsky R, Gillessen T, Alzheimer C. Dendritic Na+ channels amplify EPSPs in hippocampal CA1 pyramidal cells. J Neurophysiol. 1996;76:2181–2191. doi: 10.1152/jn.1996.76.4.2181. [DOI] [PubMed] [Google Scholar]
- London M, Hausser M. Dendritic computation. Annu Rev Neurosci. 2005;28:503–532. doi: 10.1146/annurev.neuro.28.061604.135703. [DOI] [PubMed] [Google Scholar]
- London M, Schreibman A, Hausser M, Larkum ME, Segev I. The information efficacy of a synapse. Nat Neurosci. 2002;5:332–340. doi: 10.1038/nn826. [DOI] [PubMed] [Google Scholar]
- London M, Larkum ME, Häusser M. Predicting the synaptic information efficacy in cortical layer 5 pyramidal neurons using a minimal integrate-and-fire model. Biol Cybern. 2008;99:393–401. doi: 10.1007/s00422-008-0268-3. [DOI] [PMC free article] [PubMed] [Google Scholar]
- Losonczy A, Magee JC. Integrative properties of radial oblique dendrites in hippocampal CA1 pyramidal neurons. Neuron. 2006;50:291–307. doi: 10.1016/j.neuron.2006.03.016. [DOI] [PubMed] [Google Scholar]
- Magee JC, Johnston D. Characterization of single voltage-gated Na+ and Ca2+ channels in apical dendrites of rat CA1 pyramidal neurons. J Physiol. 1995;487:67–90. doi: 10.1113/jphysiol.1995.sp020862. [DOI] [PMC free article] [PubMed] [Google Scholar]
- Magill PJ, Bolam JP, Bevan MD. Relationship of activity in the subthalamic nucleus-globus pallidus network to cortical electroencephalogram. J Neurosci. 2000;20:820–833. doi: 10.1523/JNEUROSCI.20-02-00820.2000. [DOI] [PMC free article] [PubMed] [Google Scholar]
- Mallet N, Pogosyan A, Marton LF, Bolam JP, Brown P, Magill PJ. Parkinsonian beta oscillations in the external globus pallidus and their relationship with subthalamic nucleus activity. J Neurosci. 2008a;28:14245–14258. doi: 10.1523/JNEUROSCI.4199-08.2008. [DOI] [PMC free article] [PubMed] [Google Scholar]
- Mallet N, Pogosyan A, Sharott A, Csicsvari J, Bolam JP, Brown P, Magill PJ. Disrupted dopamine transmission and the emergence of exaggerated beta oscillations in subthalamic nucleus and cerebral cortex. J Neurosci. 2008b;28:4795–4806. doi: 10.1523/JNEUROSCI.0123-08.2008. [DOI] [PMC free article] [PubMed] [Google Scholar]
- Martina M, Vida I, Jonas P. Distal initiation and active propagation of action potentials in interneuron dendrites. Science. 2000;287:295–300. doi: 10.1126/science.287.5451.295. [DOI] [PubMed] [Google Scholar]
- Mel BW. Synaptic integration in an excitable dendritic tree. J Neurophysiol. 1993;70:1086–1101. doi: 10.1152/jn.1993.70.3.1086. [DOI] [PubMed] [Google Scholar]
- Mercer JN, Chan CS, Tkatch T, Held J, Surmeier DJ. Nav1.6 sodium channels are critical to pacemaking and fast spiking in globus pallidus neurons. J Neurosci. 2007;27:13552–13566. doi: 10.1523/JNEUROSCI.3430-07.2007. [DOI] [PMC free article] [PubMed] [Google Scholar]
- Migliore M, Shepherd GM. Emerging rules for the distributions of active dendritic conductances. Nat Rev Neurosci. 2002;3:362–370. doi: 10.1038/nrn810. [DOI] [PubMed] [Google Scholar]
- Millhouse OE. Pallidal neurons in the rat. J Comp Neurol. 1986;254:209–227. doi: 10.1002/cne.902540206. [DOI] [PubMed] [Google Scholar]
- Mori K, Nowycky MC, Shepherd GM. Synaptic excitatory and inhibitory interactions at distal dendritic sites on mitral cells in the isolated turtle olfactory bulb. J Neurosci. 1984;4:2291–2296. doi: 10.1523/JNEUROSCI.04-09-02291.1984. [DOI] [PMC free article] [PubMed] [Google Scholar]
- Nini A, Feingold A, Slovin H, Bergman H. Neurons in the globus pallidus do not show correlated activity in the normal monkey, but phase-locked oscillations appear in the MPTP model of parkinsonism. J Neurophysiol. 1995;74:1800–1805. doi: 10.1152/jn.1995.74.4.1800. [DOI] [PubMed] [Google Scholar]
- Oviedo H, Reyes AD. Boosting of neuronal firing evoked with asynchronous and synchronous inputs to the dendrite. Nat Neurosci. 2002;5:261–266. doi: 10.1038/nn807. [DOI] [PubMed] [Google Scholar]
- Paquet M, Smith Y. Differential localization of AMPA glutamate receptor subunits in the two segments of the globus pallidus and the substantia nigra pars reticulata in the squirrel monkey. Eur J Neurosci. 1996;8:229–233. doi: 10.1111/j.1460-9568.1996.tb01184.x. [DOI] [PubMed] [Google Scholar]
- Parent A, Hazrati LN. Functional anatomy of the basal ganglia. II. The place of subthalamic nucleus and external pallidum in basal ganglia circuitry. Brain Res Brain Res Rev. 1995;20:128–154. doi: 10.1016/0165-0173(94)00008-d. [DOI] [PubMed] [Google Scholar]
- Park MR, Falls WM, Kitai ST. An intracellular HRP study of the rat globus pallidus. I. Responses and light microscopic analysis. J Comp Neurol. 1982;211:284–294. doi: 10.1002/cne.902110307. [DOI] [PubMed] [Google Scholar]
- Percheron G, Filion M. Parallel processing in the basal ganglia: up to a point [comment] Trends Neurosci. 1991;14:55–59. doi: 10.1016/0166-2236(91)90020-u. [DOI] [PubMed] [Google Scholar]
- Percheron G, Yelnik J, Francois C. A Golgi analysis of the primate globus pallidus. III. Spatial organization of the striato-pallidal complex. J Comp Neurol. 1984;227:214–227. doi: 10.1002/cne.902270207. [DOI] [PubMed] [Google Scholar]
- Rall W. Theoretical significance of dendritic trees for neuronal input-output relations. In: Reiss RF, editor. Neural theory and modeling. Stanford, CA: Stanford UP; 1964. pp. 73–97. [Google Scholar]
- Raz A, Vaadia E, Bergman H. Firing patterns and correlations of spontaneous discharge of pallidal neurons in the normal and the tremulous 1-methyl-4-phenyl-1,2,3,6-tetrahydropyridine vervet model of parkinsonism. J Neurosci. 2000;20:8559–8571. doi: 10.1523/JNEUROSCI.20-22-08559.2000. [DOI] [PMC free article] [PubMed] [Google Scholar]
- Rudolph M, Destexhe A. A fast-conducting, stochastic integrative mode for neocortical neurons in vivo. J Neurosci. 2003;23:2466–2476. doi: 10.1523/JNEUROSCI.23-06-02466.2003. [DOI] [PMC free article] [PubMed] [Google Scholar]
- Rumsey CC, Abbott LF. Synaptic democracy in active dendrites. J Neurophysiol. 2006;96:2307–2318. doi: 10.1152/jn.00149.2006. [DOI] [PubMed] [Google Scholar]
- Sadek AR, Magill PJ, Bolam JP. A single-cell analysis of intrinsic connectivity in the rat globus pallidus. J Neurosci. 2007;27:6352–6362. doi: 10.1523/JNEUROSCI.0953-07.2007. [DOI] [PMC free article] [PubMed] [Google Scholar]
- Sato F, Lavallee P, Levesque M, Parent A. Single-axon tracing study of neurons of the external segment of the globus pallidus in primate. J Comp Neurol. 2000;417:17–31. [PubMed] [Google Scholar]
- Schultheiss NW, Edgerton JR, Jaeger D. Phase response curve analysis of a full morphological globus pallidus neuron model reveals distinct perisomatic and dendritic modes of synaptic integration. J Neurosci. 2010;30:2767–2782. doi: 10.1523/JNEUROSCI.3959-09.2010. [DOI] [PMC free article] [PubMed] [Google Scholar]
- Segev I, Parnas I. Synaptic integration mechanisms: theoretical and experimental investigation of temporal postsynaptic interactions between excitatory and inhibitory inputs. Biophys J. 1983;41:41–50. doi: 10.1016/S0006-3495(83)84404-X. [DOI] [PMC free article] [PubMed] [Google Scholar]
- Shadlen MN, Newsome WT. The variable discharge of cortical neurons: implications for connectivity, computation, and information coding. J Neurosci. 1998;18:3870–3896. doi: 10.1523/JNEUROSCI.18-10-03870.1998. [DOI] [PMC free article] [PubMed] [Google Scholar]
- Sharott A, Magill PJ, Harnack D, Kupsch A, Meissner W, Brown P. Dopamine depletion increases the power and coherence of beta-oscillations in the cerebral cortex and subthalamic nucleus of the awake rat. Eur J Neurosci. 2005;21:1413–1422. doi: 10.1111/j.1460-9568.2005.03973.x. [DOI] [PubMed] [Google Scholar]
- Shen GY, Chen WR, Midtgaard J, Shepherd GM, Hines ML. Computational analysis of action potential initiation in mitral cell soma and dendrites based on dual patch recordings. J Neurophysiol. 1999;82:3006–3020. doi: 10.1152/jn.1999.82.6.3006. [DOI] [PubMed] [Google Scholar]
- Shink E, Smith Y. Differential synaptic innervation of neurons in the internal and external segments of the globus pallidus by the GABA- and glutamate-containing terminals in the squirrel monkey. J Comp Neurol. 1995;358:119–141. doi: 10.1002/cne.903580108. [DOI] [PubMed] [Google Scholar]
- Shink E, Bevan MD, Bolam JP, Smith Y. The subthalamic nucleus and the external pallidum: two tightly interconnected structures that control the output of the basal ganglia in the monkey. Neuroscience. 1996;73:335–357. doi: 10.1016/0306-4522(96)00022-x. [DOI] [PubMed] [Google Scholar]
- Shlens J, Kennel MB, Abarbanel HD, Chichilnisky EJ. Estimating information rates with confidence intervals in neural spike trains. Neural Comput. 2007;19:1683–1719. doi: 10.1162/neco.2007.19.7.1683. [DOI] [PubMed] [Google Scholar]
- Silberstein P, Kuhn AA, Kupsch A, Trottenberg T, Krauss JK, Wohrle JC, Mazzone P, Insola A, Di Lazzaro V, Oliviero A, Aziz T, Brown P. Patterning of globus pallidus local field potentials differs between Parkinson's disease and dystonia. Brain. 2003;126:2597–2608. doi: 10.1093/brain/awg267. [DOI] [PubMed] [Google Scholar]
- Sjostrom PJ, Rancz EA, Roth A, Hausser M. Dendritic excitability and synaptic plasticity. Physiol Rev. 2008;88:769–840. doi: 10.1152/physrev.00016.2007. [DOI] [PubMed] [Google Scholar]
- Smith Y, Bevan MD, Shink E, Bolam JP. Microcircuitry of the direct and indirect pathways of the basal ganglia. Neuroscience. 1998;86:353–387. doi: 10.1016/s0306-4522(98)00004-9. [DOI] [PubMed] [Google Scholar]
- Soares J, Kliem MA, Betarbet R, Greenamyre JT, Yamamoto B, Wichmann T. Role of external pallidal segment in primate parkinsonism: comparison of the effects of 1-methyl-4-phenyl-1,2,3,6-tetrahydropyridine-induced parkinsonism and lesions of the external pallidal segment. J Neurosci. 2004;24:6417–6426. doi: 10.1523/JNEUROSCI.0836-04.2004. [DOI] [PMC free article] [PubMed] [Google Scholar]
- Softky WR, Koch C. The highly irregular firing of cortical cells is inconsistent with temporal integration of random EPSPs. J Neurosci. 1993;13:334–350. doi: 10.1523/JNEUROSCI.13-01-00334.1993. [DOI] [PMC free article] [PubMed] [Google Scholar]
- Soltis RP, Anderson LA, Walters JR, Kelland MD. A role for non-NMDA excitatory amino-acid receptors in regulating the basal activity of rat globus-pallidus neurons and their activation by the subthalamic nucleus. Brain Res. 1994;666:21–30. doi: 10.1016/0006-8993(94)90278-x. [DOI] [PubMed] [Google Scholar]
- Spruston N. Pyramidal neurons: dendritic structure and synaptic integration. Nat Rev Neurosci. 2008;9:206–221. doi: 10.1038/nrn2286. [DOI] [PubMed] [Google Scholar]
- Stuart G, Hausser M. Initiation and spread of sodium action potentials in cerebellar Purkinje cells. Neuron. 1994;13:703–712. doi: 10.1016/0896-6273(94)90037-x. [DOI] [PubMed] [Google Scholar]
- Stuart GJ, Sakmann B. Active propagation of somatic action potentials into neocortical pyramidal cell dendrites. Nature. 1994;367:69–72. doi: 10.1038/367069a0. [DOI] [PubMed] [Google Scholar]
- Surmeier DJ, Eberwine J, Wilson CJ, Cao Y, Stefani A, Kitai ST. Dopamine receptor subtypes colocalize in rat striatonigral neurons. Proc Natl Acad Sci U S A. 1992;89:10178–10182. doi: 10.1073/pnas.89.21.10178. [DOI] [PMC free article] [PubMed] [Google Scholar]
- Urbain N, Gervasoni D, Souliere F, Lobo L, Rentero N, Windels F, Astier B, Savasta M, Fort P, Renaud B, Luppi PH, Chouvet G. Unrelated course of subthalamic nucleus and globus pallidus neuronal activities across vigilance states in the rat. Eur J Neurosci. 2000;12:3361–3374. doi: 10.1046/j.1460-9568.2000.00199.x. [DOI] [PubMed] [Google Scholar]
- Waters J, Schaefer A, Sakmann B. Backpropagating action potentials in neurones: measurement, mechanisms and potential functions. Prog Biophys Mol Biol. 2005;87:145–170. doi: 10.1016/j.pbiomolbio.2004.06.009. [DOI] [PubMed] [Google Scholar]
- Willems FMJ, Shtarkov YM, Tjalkens TJ. The context-tree weighting method—basic properties. IEEE Trans Inform Theory. 1995;41:653–664. [Google Scholar]
- Williams SR, Stuart GJ. Action potential backpropagation and somato-dendritic distribution of ion channels in thalamocortical neurons. J Neurosci. 2000;20:1307–1317. doi: 10.1523/JNEUROSCI.20-04-01307.2000. [DOI] [PMC free article] [PubMed] [Google Scholar]
- Williams SR, Stuart GJ. Dependence of EPSP efficacy on synapse location in neocortical pyramidal neurons. Science. 2002;295:1907–1910. doi: 10.1126/science.1067903. [DOI] [PubMed] [Google Scholar]
- Williams SR, Stuart GJ. Role of dendritic synapse location in the control of action potential output. Trends Neurosci. 2003;26:147–154. doi: 10.1016/S0166-2236(03)00035-3. [DOI] [PubMed] [Google Scholar]
- Wilson CJ, Phelan KD. Dual topographic representation of neostriatum in the globus pallidus of rats. Brain Res. 1982;243:354–359. doi: 10.1016/0006-8993(82)90260-8. [DOI] [PubMed] [Google Scholar]
- Xu J, Kang N, Jiang L, Nedergaard M, Kang J. Activity-dependent long-term potentiation of intrinsic excitability in hippocampal CA1 pyramidal neurons. J Neurosci. 2005;25:1750–1760. doi: 10.1523/JNEUROSCI.4217-04.2005. [DOI] [PMC free article] [PubMed] [Google Scholar]
- Yelnik J. Functional anatomy of the basal ganglia. Mov Disord. 2002;17(Suppl 3):S15–21. doi: 10.1002/mds.10138. [DOI] [PubMed] [Google Scholar]
- Yelnik J, Percheron G, Francois C. A Golgi analysis of the primate globus pallidus. II. Quantitative morphology and spatial orientation of dendritic arborizations. J Comp Neurol. 1984;227:200–213. doi: 10.1002/cne.902270206. [DOI] [PubMed] [Google Scholar]