

Summary
Background and objectives
In animal models of polycystic kidney disease, the ingestion of large amounts of water promotes diuresis by suppressing plasma levels of arginine vasopressin (AVP) and renal levels of cAMP, slowing cyst progression. Whether simple water ingestion is a potential therapeutic strategy for individuals with autosomal dominant polycystic kidney disease (ADPKD) is unknown. In this study, a simple method to quantify the amount of water to achieve a specific mean urine osmolality target in patients with ADPKD was developed and tested.
Design, setting, participants, & measurements
In eight ADPKD patients eating typical diets, osmolality and volume were measured in 24-hour urine collections. The amount of additional ingested water required daily to achieve a mean urine osmolality of 285 ± 45 mosm/kg was determined. Participants were instructed to distribute the prescribed water over waking hours for each of 5 days. Blood chemistries, 24-hour urine collections, BP, and weight were measured before and after the period of supplemental water intake.
Results
Five patients achieved the 285 mosm/kg urine target without difficulty. Mean urine osmolality decreased and mean urine volume increased; serum sodium, weight, and BP were unchanged. Daily osmolar excretion remained constant, indicating a stable ad lib dietary intake of solutes and protein over the 2-week study period.
Conclusions
The amount of additional water needed to achieve a urine osmolality target can be approximated from the urine osmolar excretion in ADPKD patients eating typical diets, providing a quantitative method to prescribe supplemental water for such individuals.
Introduction
Autosomal dominant polycystic kidney disorder (ADPKD) is the most common single gene disorder that is potentially fatal; approximately 600,000 persons in the United States have ADPKD (1). The growth of cysts depends on two principal factors: the sustained proliferation of the cells lining the cysts and the secretion of electrolytes and fluid into the cysts, thereby inflating the potential cavity created by the progressively increasing mural area. cAMP stimulates both cell proliferation and net fluid secretion (2).
Arginine vasopressin (AVP) is a potent activator of adenylyl cyclase in collecting duct cells that comprise most of the cysts in ADPKD. Humans are normally antidiuretic, excreting urine with osmolality greater than the plasma throughout most of the day and night (3). Gattone et al. (4) were the first to demonstrate that AVP was instrumental in provoking cyst enlargement in animals with inherited renal cystic disease. The administration of OPC31260, an AVP-V2 receptor inhibitor, to mice with a rapidly progressive type of PKD decreased renal enlargement and preserved renal function. The compound also caused a pronounced water diuresis and polydipsia, reflecting its action to block AVP/cAMP–mediated water reabsorption. Even more dramatic effects to lessen kidney enlargement and dysfunction were demonstrated in three other murine models of PKD (5).
It stands to reason that ingestion of supplemental water sufficient to cause a water diuresis would lower the plasma level of AVP, accomplishing the same renal action as blocking AVP-V2 receptors. Indeed, Nagao et al. (6) demonstrated in rats with a recessive type of PKD that increased fluid intake, sufficient to lower urine osmolality below that of plasma, decreased plasma AVP and renal cAMP levels enough to slow cyst growth in comparison to animals who drank water ad libitum. This study strongly suggested that it might be possible to use a physiologic approach to slow the rate of disease progression in patients with different types of PKD simply by increasing the intake of water early in the course of the disease.
Water is currently prescribed in excess to patients with nephrolithiasis with the goal to reduce the concentration of urinary solutes, some of which are lithogenic (7–10). The amount of water prescribed varies from clinic to clinic but in general >3 L/d are suggested. We think this empiric approach can be improved by a relatively simple procedure that we examined in this study. We have devised a quantitative method to determine the amount of water needed on a case-by-case basis to achieve a mean urine osmolality target day after day.
Materials and Methods
Background and Rationale
The median 24-hour urine osmolality of humans (approximately 753 mosm/kg) is greater than that of plasma (approximately 285 mosm/kg), indicating that antidiuresis is the normal state (3,11–13). It follows that plasma AVP and cAMP operate almost 24 hours a day/7 days a week in collecting duct cells in individuals (normal and those with PKD) with mean urine osmolalities greater than approximately 75 mosm/kg, the minimum osmolality achieved in the diluting segments of the nephron (3). The median 24-hour urine volume in those with normal renal function is approximately 1225 ml (range 1051 to 2270 ml) (3,12,14–21). In temperate climates the insensible losses of water in sweat, respiration, and stool are nearly balanced by the water ingested in solid and semisolid foods and derived from metabolism. Thus, daily urine volume is a reasonably good indicator of the volume of fluids drunk over the 24-hour period it was collected.
The major goal of the study was to devise a method to quantitatively prescribe water to an individual sufficient to achieve a mean daily urine osmolality equivalent to that of plasma (approximately 285 mosm/kg). This osmolality goal was selected because it defines the transition from dilute to concentrated urine and is a safe end point under most any circumstance. Furthermore, we hoped to gain an appreciation for how compliant patients would be in following a water prescription without inconveniencing them. The rationale for using increased water intake as therapy of ADPKD is predicated on the knowledge that lowering urine osmolality during waking hours below that of plasma will drive plasma AVP to lower levels than otherwise, and thereby decrease the generation of cAMP in collecting duct and cyst epithelial cells during a substantial portion of each day.
Procedure
Persons with ADPKD confirmed by radiologic studies and positive family history were enrolled after informed consent approved by the Institutional Review Board (IRB) in conformity with the principles of the Declaration of Helsinki. All had unremarkable physical examinations, were normotensive, and had estimated GFR (eGFR) values in the normal range. The study was conducted over two 1-week intervals, not necessarily in direct sequence.
Phase 1: baseline study.
Plasma was drawn for the determination of electrolytes, blood urea nitrogen, creatinine, and osmolality upon enrollment. Patients were instructed to continue their regular diets and fluid intake for 7 days. For 3 consecutive days (days 5, 6, and 7) they collected all urine in refrigerated containers without preservatives. The urine samples were transported to the General Clinical Research Center (GCRC) and submitted for analysis of electrolytes, urea, creatinine, and osmolality after measuring volume. Osmolality was determined by freezing point depression and the results were confirmed by a vapor pressure method.
Total urine osmoles (mosmol) were determined from volume (ml) × osmolality (mosm/kg) for each sample and the mean determined. The amount of water required to decrease mean 24-hour urine osmolality to 285 mosm/kg was computed:
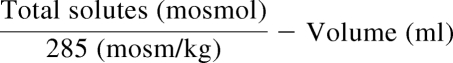 |
Phase 2: experimental study.
The experimental study was conducted on the same days of the week as the baseline for each patient. Each patient was instructed to continue drinking fluids they were accustomed to during waking hours, and to supplement, as evenly as possible, an amount of extra water based on the volume calculated from the excretion of total urine solutes. They were given calibrated containers to assist in meeting the supplementary water goal. They also kept a record of the fluid intake apart from the supplementary amounts. They were also instructed to continue eating their regular diets. For 3 consecutive days (days 5, 6, and 7) they collected all urine, which was transported to the GCRC and submitted for analysis of electrolytes, urea, creatinine, and osmolality after measuring volume.
Dietary compliance was evaluated by comparing the total osmoles, electrolytes, and urea in urine. Completeness of urine collections were evaluated from the amounts of creatinine collected. Compliance with the supplemental water prescription was judged from the difference between baseline and experimental urine volumes. Sodium, potassium, chloride, urea, creatinine, and osmolality concentrations in plasma and urine were determined in the laboratory of the University of Kansas Hospital by generally accepted methods. Combined kidney volume was estimated from renal MR TI images using the equation for an ellipsoid, π/6 (length × width × depth). Descriptive statistics and standard t tests were employed to determine levels of significance.
Determination of Urine Osmolality
Three analytical methods were used to measure urine osmolality: freezing point depression, vapor pressure, and the sum of individual urinary solutes (2 × (Na + K) + urea) in mmol/L. Freezing point determination was determined in the clinical laboratory by a certified method, vapor pressure was determined in the Kidney Institute laboratory using a Webcor 5500 vapor pressure osmometer, and the sum of urinary osmolytes was calculated.
Statistical Analyses
Data were presented as mean ± SD, where appropriate. Differences between groups were determined using the paired t tests. Pearson correlation coefficients were used to test for the degree of correlation between variables measured by different assays.
Results
Eight healthy individuals (seven women, one man) with ADPKD were enrolled (Table 1). The participants were relatively young, were normotensive, and had eGFRs in the CKD stages 1 and 2. The combined kidney volumes determined in five of the volunteers averaged 1039 ± 784 cm3 (range 333 to 2086 cm3).
Table 1.
Baseline characteristics
| Age, years | 38.0 ± 10.0 |
| Gender, n (%) women | 7 (87.5) |
| Weight (kg) | 66.2 ± 10.5 |
| Height (cm) | 168 ± 7.18 |
| Body surface area (m2)a | 1.76 ± 0.17 |
| Serum creatinine (mg/dl) | 0.7 ± 0.1 |
| eGFR (cm3/min)b | 113 ± 31 |
| Blood pressure (mmHg) | 117/75 ± 11/9 |
| TKV (cm3)c | 1039 ± 784 |
Data expressed as mean ± SD. TKV, total kidney volume.
Mostella formula.
Cockroft-Gault formula.
Ellipsoid formula.
In phase I, three consecutive 24-hour urine samples were collected from each individual at baseline while they ate and drank typical amounts of food and fluids. In phase II, each patient ate their usual diet but increased the intake of fluids, by adding extra water, for 5 consecutive days, the amount of extra water predicated on the amounts of solute and urine volume excreted in phase I. In phase II they collected urine for the last 3 consecutive days while drinking the prescribed increased volume of water.
The mean urine volume of 1.57 L/d in phase I was typical for ADPKD patients (Table 2; Figure 1A). The mean Uosm of 496 mosm/kg (freezing point method) was increased above that of normal plasma (285 mosm/kg) in all of the patients in phase I (Figure 1B), indicating that they were probably antidiuretic for most of the day and night. The mean osmolar excretion (673 mosmol/d) was dominated by the seven women and was in general agreement with published values for women (3). The urinary osmolality, measured by freezing point depression, agreed well with the osmolar excretion determined from the sum of electrolytes and urea (Uosm est = 25.3 + 0.88 × measured Uosm, R2 = 0.98). (Figure 2). Urine osmolality determined by freezing point was not significantly different from that determined by the vapor pressure method (16.5 ± 37.6 mmol/L, P = 0.52).
Table 2.
Mean urine volume, osmolality, and solute excretion (24 hours) during phase I and phase II
| Urine Phase I | CV | Urine Phase II | CV | Urine Phase (II − I)/I × 100 | P valuea | |
|---|---|---|---|---|---|---|
| V (L) | 1.57 ± 0.75 | 26% | 2.35 ± 1.06 | 20% | 50.0% | 0.015 |
| Uosm (mosm/kg) | 496 ± 172 | 17% | 325 ± 111 | 12% | −34.5% | 0.015 |
| UosmV (mosmol) | 673 ± 207 | 16% | 689 ± 239 | 19% | 2.4% | 0.847 |
| UNaV (mEq) | 132 ± 41 | 30% | 136 ± 79 | 26% | 3.0% | 0.878 |
| UKV (meq) | 42 ± 11 | 16% | 48 ± 15 | 20% | 14.3% | 0.191 |
| UClV (meq) | 127 ± 6 | 21% | 120 ± 61 | 21% | −5.5% | 0.736 |
| UUrea (mmol) | 131.7 ± 40.0 | 15% | 138.3 ± 38.3 | 18% | 5.1% | 0.656 |
| UCreatinine (gm) | 1.20 ± 0.2 | 15% | 1.20 ± 0.2 | 14% | 0.0% | 0.908 |
Data expressed as mean ± SD. n = 8.
Comparison between Urine Phase I and Urine Phase II.
Figure 1.

Individual changes in urine volume, osmolality, and osmolar excretion. (A) 24-hour urine volume; (B) mean 24-hour urine osmolality; (C) total 24-hour urine osmolality. The horizontal line in (B) indicates urine osmolality of 285 mosm/kg.
Figure 2.

Relationship between mean urine osmolality (freezing point) and mean urine osmolality estimated from the sum of solutes. Estimated Uosm = 25.26 + 0.88 × measured Uosm, R2 = 0.98.
In phase II the patients drank extra water based on the urine volume and osmolar excretion determined in phase I. The amount of extra water each patient was asked to drink for 5 consecutive days ranged from 356 to 1404 ml (788 ± 344 ml). The urine volume increased in seven of eight patients from a mean of 1.57 ± 0.75 L/d in phase I to 2.35 ± 1.06 L/d in phase II, an amount 50.0% greater than baseline (P < 0.015) (Figure 1 A; Table 2). This increased amount of water was reflected in the decrease of mean urine osmolality from 496 ± 172 to 325 ± 111 mosm/kg (P < 0.025). Five of the eight patients reached or exceeded the target urine osmolality of 285 mosm/kg and three fell short. The patient with the highest urine volume in phase I failed to increase urine volume in phase II despite being requested to drink an additional 570 ml of water. All seven patients who complied with the instruction to drink additional water lowered the urine osmolality below that of phase I (Figure 1B). Although the participants ate food ad libitum over both weeks of the study, the overall urinary excretion of total osmoles, individual electrolytes, and urea, did not differ appreciably between phase I and phase II (Table 2) but one patient did experience a substantial increase in solute excretion. All of the participants reported that drinking frequent sips of water throughout the day did not interfere with doing their normal activities nor did it affect their regular appetites for solid food. None reported edema or perceived a gain in weight; the mean weights did not change significantly between phase I and the completion of phase II (Table 3). No significant changes in BP, serum sodium concentration, or eGFR were detected at the completion of phase II (Table 3).
Table 3.
General features
| Parameters | Baseline | Water Intake Phase | P |
|---|---|---|---|
| Weight (kg) | 66.2 ± 10.5 | 65.9 ± 10.1 | 0.50 |
| Blood pressure (mmHg) | 117/75 ± 11/9 | 121/82 ± 11/3 | 0.20 |
| Serum Na (meq/L) | 138 ± 1.8 | 138 ± 1.0 | 0.67 |
| eGFR (ml/min) | 113 ± 31 | 103 ± 17 | 0.11 |
Discussion
Patients with ADPKD can dilute the urine to a normal degree after ingesting a water load (3,13). The major goal of this study was to determine if measurement of the 24-hour excretion of total solutes was useful in devising the amount of water needed to effectively and safely lower the urine osmolality over extended periods of time in patients with ADPKD. Upon the continuous ingestion of increased amounts of water during the second week of the study, the mean osmolality decreased and mean urine volume increased in seven of the eight patients; five patients met or exceeded the urine osmolality target of 285 mosm/kg. One patient had difficulty supplementing the usual water intake and urine osmolality decreased only 7 mosm/kg, which was insignificantly different from baseline. This outlier patient illustrates that despite careful instruction by highly trained nurse coordinators, patients may not completely understand the procedure and will require reinforcement in subsequent visits. Although we collected urine samples only during the last 3 days of the week, examination of the fluid intake diaries indicated that it was highly likely that the osmolality values reflected in those samples were representative of the entire week. None of the patients reported any side effects. The increase in fluid intake was tolerated well.
Surveys conducted in renal stone clinics indicate that compliance with a prescription for increased water intake is difficult to achieve (22). That is why we chose a relatively modest osmolality target in this pilot study. The overall mean 24-hour urine volume was increased to 2352 ml and this was sufficient to achieve a mean osmolality of 325 mosm/kg, significantly reduced but 40 mosm/kg short of the 285 mosm/kg goal. One patient was unable to adhere to the water prescription; in the remaining seven participants, the mean urine osmolality was 293 mosm/kg.
It is interesting to note that the excretion of total urinary solutes did not differ significantly between the two phases of the study. Thus, the ingestion of extra water did not appear to alter the appetite for food. Total urine creatinine content was not significantly different between the two phases of the study, indicating there was a high degree of compliance in the collection of multiple urine samples. Considered altogether, the results indicate that the prescription of increased water intake to patients can be approached more quantitatively than is the usual practice. Prospective measurement of total osmoles or total urine solutes in 24-hour collections of urine can provide important guidance for the rational prescription of water appropriate for the individual patient's needs and renal status with minimum inconvenience and cost.
The rational prescription of water targeted to specific renal disorders such as nephrolithiasis and polycystic kidney disease will mitigate against the promotion of hyponatremia in patients who ingest low caloric diets containing reduced amounts of salt and other electrolytes. Low rates of urinary solute excretion should raise a red flag that tempers the amount of extra water that is prescribed. And, as shown in this study, it is relatively simple to calculate the amount of water for each patient to achieve a prescribed urine osmolality goal.
Although we think that the principle method to compute water intake to reach a target urine osmolality is supported by the study results, we acknowledge several important limitations. First, the sample size was intentionally small as we were developing and verifying a methodology rather than conducting a clinical trial to examine the effects of water on the course of ADPKD. Second, all but one participant was a Caucasian woman, and because daily solute intake, mean urine osmolality, and plasma AVP levels are affected by gender and race (11,12,23), our findings cannot be quantitatively generalized to a more diverse population. Third, our patients were normotensive with eGFRs within CKD stages 1 and 2. ADPKD patients with more advanced kidney disease may have significantly different fluid and solute intake than our study patients. In clinical practice we recommend that in addition to the initial measurement of urine solute excretion that periodic 24-hour urine follow-up collections are advisable to ensure that solute excretion remains within bounds. Importantly, we do not recommend increasing water intake above their usual amounts for those with advanced disease (CKD stages 3, 4, and 5).
An “optimum” urine osmolality target for the treatment of ADPKD was not explored in this study. Rather, our aim was to determine if using urine solute to compute the amount of water to lower urine osmolality to a target value was practical, and indeed it is. We think it is appropriate to consider a larger study to determine if reducing urine osmolality, and presumably cellular cAMP, in patients with ADPKD will diminish the progressive enlargement of the cysts and the kidneys.
In summary, we demonstrated that, in ADPKD patients with preserved renal function, urine can be effectively and safely diluted to approximately 285 mosm/kg in the majority of patients. Appropriate water prescriptions resulted in isosthenuria in all patients who were able to adhere to a study protocol requiring them to drink water evenly over the course of 16 waking hours. Low intrapatient variability in solute intake suggests that prescribing water is potentially a viable therapeutic option, and fears that extra water intake may adversely affect appetite, resulting in less caloric intake, or provoke hyponatremia appear unfounded in compliant patients. Whether water drinking can affect the natural history of ADPKD by suppressing ADH throughout the waking hours is a critical question requiring future study.
Disclosures
F.T.W. is site principal investigator of a clinical trial examining the effect of tolvaptan in ADPKD supported by Otsuka. J.J.G. is a consultant for Otsuka.
Acknowledgments
The General Clinical Research Center (GCRC) of the University of Kansas Medical Center is acknowledged for funding this study. The authors thank Dr. James B. Wetmore for his comments on the manuscript. This study is registered on ClinicalTrials.gov, number NCT00759369.
Footnotes
Published online ahead of print. Publication date available at www.cjasn.org.
Access to UpToDate on-line is available for additional clinical information at http://www.cjasn.org/
References
- 1. Grantham JJ, Chapman AB, Torres VE: Volume progression in autosomal dominant polycystic kidney disease: The major factor determining clinical outcomes. Clin J Am Soc Nephrol 1: 148–157, 2006 [DOI] [PubMed] [Google Scholar]
- 2. Grantham JJ: Lillian Jean Kaplan International Prize for advancement in the understanding of polycystic kidney disease. Understanding polycystic kidney disease: A systems biology approach. Kidney Int 64: 1157–1162, 2003 [DOI] [PubMed] [Google Scholar]
- 3. Torres VE, Bankir L, Grantham JJ: A case for water in the treatment of polycystic kidney disease. Clin J Am Soc Nephrol 4: 1140–1150, 2009 [DOI] [PubMed] [Google Scholar]
- 4. Gattone VH, 2nd, Maser RL, Tian C, Rosenberg JM, Branden MG: Developmental expression of urine concentration-associated genes and their altered expression in murine infantile-type polycystic kidney disease. Dev Genet 24: 309–318, 1999 [DOI] [PubMed] [Google Scholar]
- 5. Gattone VH, 2nd, Wang X, Harris PC, Torres VE: Inhibition of renal cystic disease development and progression by a vasopressin V2 receptor antagonist. Nat Med 9: 1323–1326, 2003 [DOI] [PubMed] [Google Scholar]
- 6. Nagao S, Nishii K, Katsuyama M, Kurahashi H, Marunouchi T, Takahashi H, Wallace DP: Increased water intake decreases progression of polycystic kidney disease in the PCK rat. J Am Soc Nephrol 17: 2220–2227, 2006 [DOI] [PubMed] [Google Scholar]
- 7. Borghi L, Meschi T, Amato F, Briganti A, Novarini A, Giannini A: Urinary volume, water and recurrences in idiopathic calcium nephrolithiasis: A 5-year randomized prospective study. J Urol 155: 839–843, 1996 [PubMed] [Google Scholar]
- 8. Borghi L, Meschi T, Schianchi T, Briganti A, Guerra A, Allegri F, Novarini A: Urine volume: Stone risk factor and preventive measure. Nephron 81 [Suppl 1]: 31–37, 1999 [DOI] [PubMed] [Google Scholar]
- 9. Frank M, De Vries A: Prevention of urolithiasis. Education to adequate fluid intake in a new town situated in the Judean Desert Mountains. Arch Environ Health 13: 625–630, 1966 [DOI] [PubMed] [Google Scholar]
- 10. Schwartz BF, Schenkman NS, Bruce JE, Leslie SW, Stoller ML: Calcium nephrolithiasis: Effect of water hardness on urinary electrolytes. Urology 60: 23–27, 2002 [DOI] [PubMed] [Google Scholar]
- 11. Bankir L, Perucca J, Weinberger MH: Ethnic differences in urine concentration: possible relationship to blood pressure. Clin J Am Soc Nephrol 2: 304–312, 2007 [DOI] [PubMed] [Google Scholar]
- 12. Perucca J, Bouby N, Valeix P, Bankir L: Sex difference in urine concentration across differing ages, sodium intake, and level of kidney disease. Am J Physiol Regul Integr Comp Physiol 292: R700–R705, 2007 [DOI] [PubMed] [Google Scholar]
- 13. Barash I, Ponda MP, Goldfarb DS, Skolnik EY: A pilot clinical study to evaluate changes in urine osmolality and urine cAMP in response to acute and chronic water loading in autosomal dominant polycystic kidney disease. Clin J Am Soc Nephrol 5: 693–697, 2010 [DOI] [PMC free article] [PubMed] [Google Scholar]
- 14. Chapman AB, Guay-Woodford LM, Grantham JJ, Torres VE, Bae KT, Baumgarten DA, Kenney PJ, King BF, Jr., Glockner JF, Wetzel LH, Brummer ME, O'Neill WC, Robbin ML, Bennett WM, Klahr S, Hirschman GH, Kimmel PL, Thompson PA, Miller JP: Renal structure in early autosomal-dominant polycystic kidney disease (ADPKD): The Consortium for Radiologic Imaging Studies of Polycystic Kidney Disease (CRISP) cohort. Kidney Int 64: 1035–1045, 2003 [DOI] [PubMed] [Google Scholar]
- 15. Curhan GC, Willett WC, Speizer FE, Stampfer MJ: Twenty-four-hour urine chemistries and the risk of kidney stones among women and men. Kidney Int 59: 2290–2298, 2001 [DOI] [PubMed] [Google Scholar]
- 16. Gabow PA, Kaehny WD, Johnson AM, Duley IT, Manco-Johnson M, Lezotte DC, Schrier RW: The clinical utility of renal concentrating capacity in polycystic kidney disease. Kidney Int 35: 675–680, 1989 [DOI] [PubMed] [Google Scholar]
- 17. Gowans EM, Fraser CG: Biological variation in analyte concentrations in urine of apparently healthy men and women. Clin Chem 33: 847–850, 1987 [PubMed] [Google Scholar]
- 18. Grampsas SA, Chandhoke PS, Fan J, Glass MA, Townsend R, Johnson AM, Gabow P: Anatomic and metabolic risk factors for nephrolithiasis in patients with autosomal dominant polycystic kidney disease. Am J Kidney Dis 36: 53–57, 2000 [DOI] [PubMed] [Google Scholar]
- 19. Ricos C, Jimenez CV, Hernandez A, Simon M, Perich C, Alvarez V, Minchinela J, Macia M: Biological variation in urine samples used for analyte measurements. Clin Chem 40: 472–477, 1994 [PubMed] [Google Scholar]
- 20. Shephard MD, Penberthy LA, Fraser CG: Short- and long-term biological variation in analytes in urine of apparently healthy individuals. Clin Chem 27: 569–573, 1981 [PubMed] [Google Scholar]
- 21. Torres VE, King BF, Chapman AB, Brummer ME, Bae KT, Glockner JF, Arya K, Risk D, Felmlee JP, Grantham JJ, Guay-Woodford LM, Bennett WM, Klahr S, Meyers CM, Zhang X, Thompson PA, Miller JP: Magnetic resonance measurements of renal blood flow and disease progression in autosomal dominant polycystic kidney disease. Clin J Am Soc Nephrol 2: 112–120, 2007 [DOI] [PubMed] [Google Scholar]
- 22. Bankir L, Daudon M: Recurrent stone formers failed to increase urine volume significantly over a 3-y period in spite of recommendations to more, and still showed a higher Tiselius index in morning urine. J Am Soc Nephrol 19: 294A, 2008 [Google Scholar]
- 23. Perucca J, Bouby N, Valeix P, Jungers P, Bankir L: [Difference in urine concentration according to gender and ethnicity: Possible involvement in the different susceptibility to various renal and cardiovascular diseases]. Nephrol Ther 4: 160–172, 2008 [DOI] [PubMed] [Google Scholar]