Figure 5.
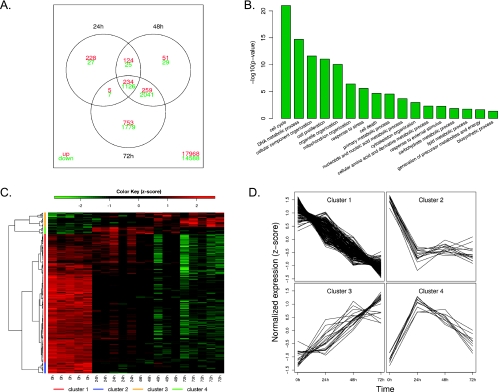
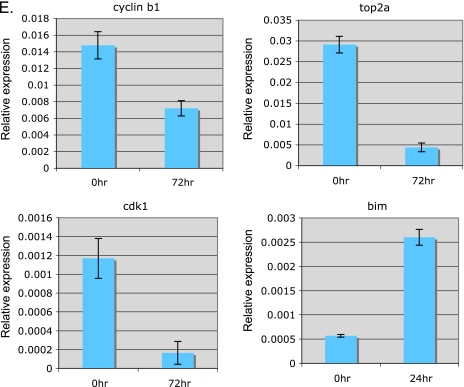
Microarray analysis gene expression profile after TAE684 treatment of H2228 xenograft tumors. (A) Venn diagram showing the overlap between the differentially expressed genes at three time points. (B) Top biologic processes represented by the differentially expressed genes. P values were from hypergeometric tests. (C) Hierarchical clustering of the expression profile of the genes involved in cell cycle and apoptosis pathways revealed four major groups. Each row represents one gene, whose expression values were scaled to means of zero and SDs of 1 (z-score transformation), and color-coded according to the color key. (D) Expression profiles of the four major clusters. Each line in the plots represents one gene. The normalized expression value of a gene at each time point is represented by the mean of z-scores from the five replicates. (E) Expression of representative genes by quantitative polymerase chain reaction. Quantitative polymerase chain reaction was performed on several selected genes using RNA samples from untreated or 24 hours (bim) or 72 hours (cyclin B1, CDK1, and TOP2A) after TAE684 treatment. Relative expression levels are shown.


