

Prior to orthotopic liver transplant (OLT), renal function in patients with end-stage liver disease (ESLD) may be diminished as a result of the hepatorenal syndrome (HRS); or, after OLT, the potential nephrotoxic effects of antirejection regimens superimposed.
We have attempted to make a more precise definition of the renal effects of FK 506 and cyclosporine (CyA) by the measurement of effective renal plasma flow (ERPF), the glomerular filtration rate (GFR), and the filtration fraction (FF) or GFR/ERPF. EPRF, in milliliters per minute, measures the total plasma flow acted upon by the nephron mass, and is traced by orthoiodo-hippurate (131 I-OIH). It is both filtered by the glomerulus and cleared by the proximal convoluted tubules. GFR, also in milliliters per minute, traced by 125-I iothalamate, is only filtered by the glomeruli. The FF measures the global fraction of the total plasma flow through the nephrons that is filtered by the glomeruli. Thus, FF is a measure of the integrity of the filtering membrane.
It is generally believed that this membrane is a target for agents that are prescribed to inhibit transplanted organ rejection. We have, therefore, elected to elucidate and to compare these effects in a large population of liver transplantees.
MATERIALS AND METHODS
Group 1 consisted of 27 adult patients awaiting liver transplantation. Group 2 consisted of 25 recently transplanted patients (within 2 months), who had received specific antirejection treatment only with CyA. Group 3 consisted of 116 patients, who had received only FK 506.
ERPF data were related to predictive algorithms based on age and sex, from a group of 345 adult normal subjects prior to kidney transplantation, 1 32 of whom also had simultaneous GFR determinations. Both ERPF2 and GFR3 were studied by previously described techniques based on single-injection, single-plasma sample procedures that have been evaluated in a wide variety of patients.1,4
RESULTS
The mean values of ERPF, GFR, and FF, the expected values of each, and the percentage of deviation from the values of ERPF and FF are all tabulated (Table 1). One standard deviation is indicated by parentheses. Actual values for the groups are depicted as ERPF, GFR, and FF while expected values are indicated by the prefix exp; the prefix d indicates the difference form the expected normal value.
Table 1.
Renal Function Effects of FK 506 and CyA in Liver Transplant Recipients
| Group | n | ERPF (mL/min) | expERPF (mL/min) | dERPF (%) | GFR (mL/min) | expGFR) (mL/min) | dGFR (%) | FF | expFF |
|---|---|---|---|---|---|---|---|---|---|
| 1 | 27 | 360 (147) | 513 (62) | −35 (23) | 74 (29) | 92 (28) | −15 (35) | 0.21 (0.11) | 0.18 (0.04) |
| 2 | 25 | 268 (113) | 567 (55) | −53 (20) | 55 (22) | 78 (28) | −25 (21) | 0.21 (0.08) | 0.14 (0.05) |
| 3 | 116 | 336 (152) | 581 (74) | −42 (24) | 76 (29) | 86 (28) | −9 (33) | 0.23 (0.10) | 0.15 (0.05) |
Data from group 1 patients showed that ESLD alone was the chief contributor to the impairment of renal function. ERPF was diminished by 35% below expected normal values. In patients subsequently transplanted and treated with CyA, the cumulative mean ERPF diminution was 53%, thus these patients begin their posttransplant course with a functional renal mass of less than one-half their expected normal value. For group 3, the mean ERPF was found to be 336 mL/min, or 42% below the expected normal value, 11% higher than that of group 2.
These ERPF data are depicted graphically in Fig 1, where insignificant differences are observed between groups 1 and 3, but group 2 ERPF values are significantly lower than those of groups 1 and 3. The same general pattern was observed in the GFR groups (Fig 2).
Fig 1.
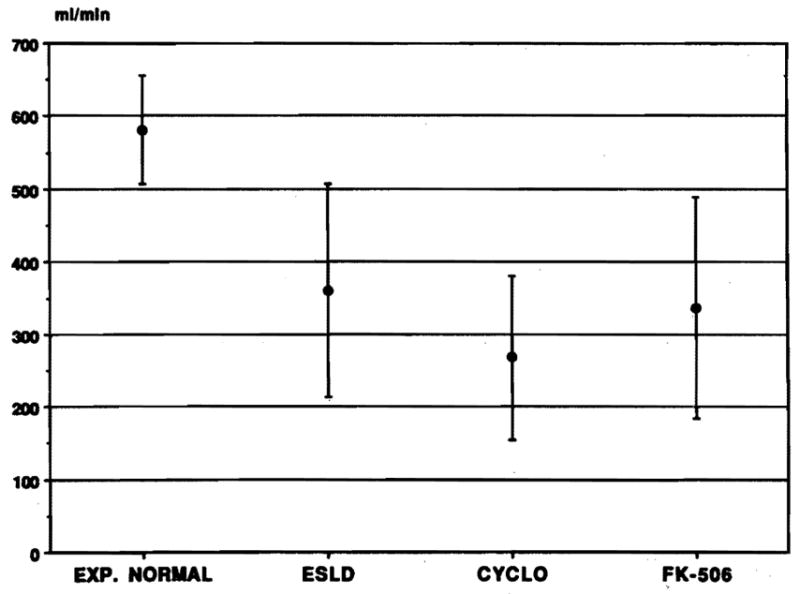
The graph depicts the mean expected normal global milliliters per minute for all patients studied. The mean and 1 SD are indicated in group 1; the mean value was 35% lower for ESLD with a relatively wide range of error. Group 2 values (patients on CyA) were significantly lower, global ERPF being 53% below expected normal values. Group 3 values (patients on FK 506) were only moderately lower than those in group 1.
Fig 2.
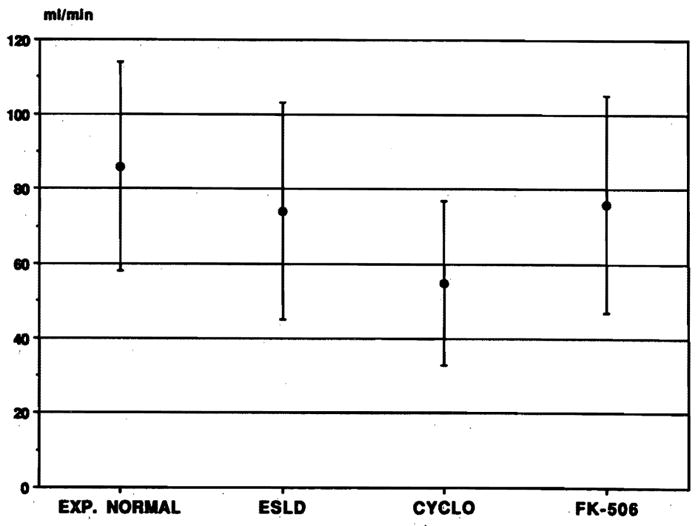
The graph depicts the expected normal global GFR in milliliters per minute for the whole group in a manner similar to that shown in Fig 1; groups 1 to 3 are the same. Group 1 data from the pretransplant patients exhibited a mean value significantly below those observed in the expected normal group, but significantly less than that observed in ERPF. Groups 1 and 3 are not significantly different from each other, indicating that FK 506 had no demonstrable effect on GFR. Group 2 values are significantly lower than those of group 1 though less than those of ERPF.
The differences between GFR among groups are significantly less than those of ERPF. All FFs and their SDs were significantly above expected values from matched normal subjects, but on the FF/ERPF regression line previously reported. 1,4 The high sigmas in both directions were indicative of filtering membrane damage. Values above the line were compatible with leaky membranes, and those below the expected mean value with plugged membranes.
SUMMARY AND CONCLUSION
The mean “cost” in milliliters per minute of ESLD alone, prior to transplantation, was 35% + 23% (1 SD). In GFR it was 15%.
The additional burden of CyA + OLT increases the loss in ERPF an additional 18%; in GFR, it increases loss another 10%. Thus, the total loss in CyA-treated patients was 53% and 25%, respectively.
The decrease imposed by FK 506 + OLT on ERPF was only 7%, with no decrease in GFR.
Therefore, from the renal point of view, FK 506 would appear to be the superior drug.
The large error around mean values underlines the desirability of performing these tests on the individual patient rather than on information from groups, since many values fall near the threshold of the azotemic range (ERPF approximately 175 mL/min).
As renal mass was compromised, ie, fall in the ERPF, the GFR increased relatively, ie, the renal filtering membrane became more permeable and the FFs gradually increased.
The loss of renal function was significantly less in OLT patients on FK 506 than CyA. However, the greatest lose in expected renal function was due to the basic ESLD itself.
References
- 1.Tauxe WN, Dubovsky EV. Nuclear Medicine in Clinical Urology and Nephrology. Norwalk, CT: Appleton-Century-Crofts; 1985. [Google Scholar]
- 2.Tauxe WN, Dubovsky EV, Kidd T, et al. Eur J Nucl Med. 1982;7:51. doi: 10.1007/BF00251641. [DOI] [PubMed] [Google Scholar]
- 3.Tauxe WN. J Nucl Med. 1986;27:45. [PubMed] [Google Scholar]
- 4.Tauxe WN, Kundu D, Klein HA. In: Blaufox MD, editor. Contributions to Nephrology; Proceedings of the 7th International Symposium; Basel, Karger. 1990. p. 58. [DOI] [PubMed] [Google Scholar]