

Abstract
Study Objectives:
Although blood pressure during sleep and the difference in blood pressure between sleep and wakefulness carry prognostic information, little is known on their central neural mechanisms. Hypothalamic neurons releasing hypocretin (orexin) peptides control wake-sleep behavior and autonomic functions and are lost in narcolepsy-cataplexy. We investigated whether chronic lack of hypocretin signaling alters blood pressure during sleep.
Design:
Comparison of blood pressure as a function of the wake-sleep behavior between 2 different hypocretin-deficient mouse models and control mice with the same genetic background.
Setting:
N/A.
Subjects:
Hypocretin-ataxin3 transgenic mice with genetic ablation of hypocretin neurons (TG, n = 12); hypocretin gene knock-out mice (KO, n = 8); congenic wild-type controls (WT, n = 10).
Interventions:
Instrumentation with electrodes for sleep recordings and a telemetric blood pressure transducer.
Measurements and Results:
Blood pressure was significantly higher in either TG or KO than in WT during non–rapid eye movement sleep (NREMS; 4 ± 2 and 7 ± 2 mm Hg, respectively) and rapid eye movement sleep (REMS; 11 ± 2 and 12 ± 3 mm Hg, respectively), whereas it did not differ significantly between groups during wakefulness. Accordingly, the decrease in blood pressure between either NREMS or REMS and wakefulness was significantly blunted in TG and KO with respect to WT.
Conclusions:
Chronic lack of hypocretin signaling may entail consequences on blood pressure that are potentially adverse and that vary widely among wake-sleep states.
Citation:
Bastianini S; Silvani A; Berteotti C; Elghozi JL; Franzini C; Lenzi P; Lo Martire V; Zoccoli G. Sleep related changes in blood pressure in hypocretin-deficient narcoleptic mice. SLEEP 2011;34(2):213-218.
Keywords: Hypertension, nervous system, peptides, physiology, sleep
HIGH VALUES OF BLOOD PRESSURE (BP) DURING SLEEP AND A REDUCED DIFFERENCE IN BP BETWEEN SLEEP AND WAKEFULNESS CARRY NEGATIVE prognostic information.1–4 Physiologically, BP is lower during sleep than during wakefulness because of vagal activation5 and vascular sympathetic withdrawal6 in non–rapid eye movement sleep (NREMS) and because of a complex re-patterning of sympathetic outflow in rapid eye movement sleep (REMS).7 Little is known on the central neural pathways that determine these cardiovascular changes, limiting therapeutic targeting of BP derangements during sleep.
Hypocretin8 1 and 2 (HCRT, also known as orexin9 A and B) are promising targets of investigation on the neural control of BP during sleep, being selectively expressed in hypothalamic neurons that control wake-sleep behavior and the autonomic nervous system.10 HCRT neurons decrease in number in Parkinson disease11 and, more dramatically, in narcolepsy-cataplexy,12,13 conferring clinical relevance to chronic impairment of HCRT signaling. Such impairment may also play a role in the pathophysiology of the metabolic syndrome because HCRT neurons are inhibited by leptin and glucose,14 whereas, conversely, diet-induced obesity is prevented by enhanced HCRT signaling.15 Finally, pharmacological inhibition of HCRT signaling represents a potential chronic treatment of insomnia and drug addiction.16,17
We investigated whether chronic lack of HCRT signaling impairs the control of BP during sleep. To this aim, we performed simultaneous recordings of sleep and BP in 2 different mouse models with chronic lack of HCRT signaling and the same genetic background: HCRT knock-out mice, in which homozygosis for a nonsense mutation of the HCRT gene causes congenital deficiency of HCRT peptides,18 and HCRT-ataxin3 transgenic mice, in which targeted expression of a transgenic neurotoxin causes selective postnatal death of HCRT neurons.19 Finally, to test whether findings critically depended on the genetic background of the mice under study, we replicated experiments on hybrid mice with transgenic ablation of HCRT neurons on a mixed genetic background.20
METHODS
The study protocol was approved by the Bologna University ethics committee on animal experimentation and complied with the National Institutes of Health guide for the care and use of laboratory animals. Experiments were performed on 3 age-matched groups of male mice congenic (≥ 9 generations of backcrossing) on C57Bl/6J genetic background: (i) mice hemizygous for a transgene (HCRT-ataxin3) coding for a neurotoxin, the targeted expression of which causes selective ablation of HCRT neurons19 (TG, n = 12); (ii) HCRT gene knock-out mice with congenital deficiency of HCRT peptides18 (KO, n = 8); and (iii) wild-type controls (WT, n = 10). Experiments were replicated on 2 age-matched groups of male mice with mixed (3:1) C57Bl/6J:DBA/2J background: (i) hybrid HCRT neuron-ablated mice hemizygous for the HCRT-ataxin3 transgene20 (hTG, n = 7); and (ii) hybrid wild-type controls (hWT, n = 6). Mice were kept on a light-dark cycle of 12-h periods with ambient temperature set at 25°C and free access to water and food (4RF21 diet, Mucedola, Settimo Milanese, Italy). Please refer to the Data Supplement for full details on the materials and methods of this study.
Experimental Protocol
Surgical and recording procedures were performed as recently described.21,22 Mice were implanted subcutaneously under deep isoflurane anesthesia with a telemetric BP transducer (TA11PA-C10, DSI, Tilburg, the Netherlands) connected to a catheter inserted into the abdominal aorta through the femoral artery. The telemetry system also yielded a motor activity signal by quantifying spatial shifts of the transducer. Two pairs of electrodes were implanted to obtain electroencephalographic (EEG) and electromyographic (EMG) signals, which were transmitted via cable. A rotating swivel (SL2+2C/SB, Plastics One, Roanoke, VA, USA) and a balanced cable suspensor allowed unhindered movements to the mice. Simultaneous recordings of BP, EEG, EMG, and motor activity were performed continuously for 3 days on mice undisturbed and freely behaving in their own cages after a 12-day period of recovery and habituation. Thereafter, a subgroup of animals (TG, n = 6; KO, n = 8; WT, n = 7) was recorded in a condition of highly aroused wakefulness, which was induced by transferring each mouse to a cage previously occupied by another male mouse for 50 minutes during the first half of the light period. This cage-switch test was replicated in all hTG and hWT mice.
Data Analysis
A visual scoring of wake-sleep states was performed on all consecutive 4-s epochs based on EEG and EMG recordings as previously described.21,22 Sleep-onset REMS periods representing cataplexy-like states were scored following consensus criteria23 and excluded from all analyses. Beat-to-beat values of mean BP and heart rate were computed from the raw BP signal in all artifact-free 4-s epochs as previously described.21,22 Overall, cardiovascular data analysis was performed on 2855 hours of artifact-free recordings.
Statistical Analysis
Data were analyzed by analysis of variance (ANOVA) and t-tests using SPSS (SPSS Inc., Chicago, IL, USA), with P < 0.05 considered to be statistically significant. Data are reported as mean ± SEM.
RESULTS
Analysis of Wake-Sleep Behavior
Both TG and KO showed fragmentation of waking behavior and significant reduction of REMS latency with respect to WT (Table 1). REMS episode duration was also significantly lower in KO than in WT. On the other hand, no significant differences in EEG power spectra were apparent among groups during either NREMS or REMS (Figure S1). Cataplexy-like episodes were detected in all TG mice and in 7 out of 8 KO mice at a rate of 5 ± 2 in 24 h in each strain, representing < 0.5% of total recording time. These episodes did not occur in WT mice, with the single exception of 1 episode during the light period in 1 WT mouse.
Table 1.
Results of the analysis of wake-sleep behavior in congenic mice
| State | Measure | Strain |
P value (ANOVA) | ||
|---|---|---|---|---|---|
| WT | TG | KO | |||
| W | % of time | 51.0 ± 1.2 | 50.8 ± 2.0 | 46.4 ± 0.9 | 0.126 |
| eps/24h | 141 ± 14 | 202 ± 7* | 196 ± 5* | < 0.001 | |
| D (s) | 334 ± 35 | 216 ± 13* | 199 ± 5* | < 0.001 | |
| MA (au) | 12 ± 2 | 8 ± 1 | 10 ± 2 | 0.275 | |
| NREMS | % of time | 40.1 ± 1.1 | 40.5 ± 1.9 | 44.0 ± 1.7 | 0.250 |
| eps/24h | 472 ± 46 | 399 ± 22 | 465 ± 30 | 0.222 | |
| D (s) | 80 ± 9 | 88 ± 4 | 84 ± 7 | 0.666 | |
| REMS | % of time | 5.2 ± 0.5 | 5.4 ± 0.4 | 5.6 ± 0.4 | 0.789 |
| eps/24h | 72 ± 7 | 72 ± 6 | 87 ± 6 | 0.281 | |
| D (s) | 62 ± 2 | 65 ± 3 | 55 ± 1* | 0.021 | |
| latency (s) | 508 ± 52 | 301 ± 19* | 350 ± 41* | 0.001 | |
W, wakefulness; NREMS, non–rapid eye movement sleep; REMS, rapid eye movement sleep; % of time, percentage of total recording time spent in each state; eps/24h, number of episodes in 24 hours; D, episode duration; MA, motor activity (arbitrary units, au); latency, time between onset of REMS episodes and termination of previous W episodes. Data are mean ± SEM in congenic mice with ablation of hypocretin neurons (TG, n = 12), congenital hypocretin deficiency (KO, n = 8), and wild-type controls (WT, n = 10) with C57Bl/6J genetic background.
P < 0.05 vs. WT (t-test).
Mean BP and Heart Rate as a Function of the Light-Dark Period and Wake-Sleep Behavior
During the light period, which is the rest period in nocturnal animals such as mice, BP was significantly higher in either TG or KO than in WT, and heart rate was significantly higher in KO than in WT (Figure 1). Analysis of cardiovascular variables as a function of the wake-sleep state revealed that BP was significantly higher in either TG or KO than in WT during NREMS and, particularly, during REMS, but not during wakefulness (Table 2). Heart rate was significantly higher in either TG or KO than in WT during REMS and was significantly higher in KO than in WT during wakefulness and NREMS (Table 2). The physiological sleep related decrease in BP was blunted in HCRT-deficient mice: the decrease in BP during either NREMS or REMS with respect to wakefulness was significantly smaller in either TG or KO than in WT (Figure 2, top). This difference was superimposed on a substantial within- and between-subject variability of BP values during each 4-s epoch of NREMS and REMS (Figure 2, bottom). All significant differences between WT and either TG or KO were replicated in ancillary analyses restricted to dark periods (P < 0.037). As far as the light periods are concerned, the differences between TG and WT in BP during NREMS (P = 0.079), in heart rate during REMS (P = 0.625) and in the BP decrease in NREMS with respect to wakefulness (P = 0.052) lost statistical significance; all other significant differences between WT and either TG or KO were maintained.
Figure 1.

Mean blood pressure (MBP) and heart rate (HR) expressed as 24-h profiles (left panels) and as averages in the light (L) and dark (D) periods (right panels). Bpm, beats per minute. For each mouse, each point in left panels was computed as the average MBP or HR value over all artifact-free 4-s epochs in the appropriate hourly interval of each recording day. Data are mean values in congenic mice with ablation of hypocretin neurons (TG, n = 12), congenital hypocretin deficiency (KO, n = 8), and wild-type controls (WT, n = 10) with C57Bl/6J genetic background. Error bars indicate SEM. ANOVA: L-D period and L-D period × strain interaction: P ≤ 0.001 for MBP and HR; strain: P = 0.066 (MBP), P = 0.008 (HR). *P < 0.05 vs. WT (same L-D period, t-test).
Table 2.
Values of mean blood pressure and heart rate as a function of the wake-sleep state in congenic mice
| Measure | State | Strain |
||
|---|---|---|---|---|
| WT | TG | KO | ||
| MBP (mm Hg) | W | 116 ± 2 | 117 ± 1 | 118 ± 2 |
| NREMS | 96 ± 1 | 100 ± 1* | 104 ± 1* | |
| REMS | 100 ± 2 | 111 ± 1* | 112 ± 2* | |
| HR (bpm) | W | 607 ± 7 | 614 ± 6 | 639 ± 7* |
| NREMS | 515 ± 11 | 503 ± 8 | 552 ± 9* | |
| REMS | 541 ± 10 | 576 ± 9* | 593 ± 7* | |
W, wakefulness; NREMS, non–rapid eye movement sleep; REMS, rapid eye movement sleep; MBP, mean blood pressure; HR, heart rate (beats per minute, bpm). Values are mean ± SEM in congenic mice with ablation of hypocretin neurons (TG, n = 12), congenital hypocretin deficiency (KO, n = 8), and wild-type controls (WT, n = 10) with C57Bl/6J genetic background. ANOVA: state and state × strain interaction, P < 0.001 for MBP and HR; strain: P = 0.004 for MBP and HR.
P < 0.05 vs. WT (same state, t-test).
Figure 2.

Difference in mean blood pressure (ΔMBP) between either non–rapid eye movement sleep (NREMS) or rapid eye movement sleep (REMS) and wakefulness. The upper panel shows mean values of ΔMBP in groups of congenic mice with ablation of hypocretin neurons (TG, n = 12), congenital hypocretin deficiency (KO, n = 8), and wild-type controls (WT, n = 10) with C57Bl/6J genetic background. Error bars indicate SEM. *P < 0.05 vs. WT (same state, t-test). The lower panel shows values of ΔMBP in each TG, KO, and WT mouse. Error bars in the lower panel indicate the standard deviation of MBP values among 4-s epochs in NREMS (x axis) and REMS (y axis) in each mouse.
A time-locked analysis of BP at state transitions between NREMS and REMS indicated that in both TG and KO, BP was significantly higher than in WT during NREMS before state transition and increased significantly more than in WT on passing from NREMS to REMS (Figure 3). This phenomenon was readily evident at observation of raw tracings (Figure S2).
Figure 3.

Changes in mean blood pressure (MBP) on passing from non–rapid eye movement sleep (NREMS) to rapid eye movement sleep (REMS). Data are expressed as absolute MBP values (upper panel) or as differences in MBP (ΔMBP, lower panel) with respect to baseline (thick horizontal bar). Data are mean ± SEM in congenic mice with ablation of hypocretin neurons (TG, n = 12), congenital hypocretin deficiency (KO, n = 8), and wild-type controls (WT, n = 10) with C57Bl/6J genetic background. Statistical tests were performed on baseline MBP in NREMS and on both MBP and ΔMBP in REMS (thin horizontal bars). ANOVA, MBP: state, strain, and state × strain interaction, P < 0.001; ΔMBP: strain, P < 0.001; * and †, P < 0.05 for WT vs. TG and WT vs. KO, respectively (same state, t-test).
In the heightened arousal conditions of the cage-switch test, both TG and KO were capable to sustain prolonged and active episodes of wakefulness at levels comparable to those in WT. In these conditions, neither BP nor heart rate differed significantly among strains (Table 3).
Table 3.
Analysis of aroused wakefulness (cage-switch test) in congenic mice
| Measure | Strain |
P value (ANOVA) | ||
|---|---|---|---|---|
| WT | TG | KO | ||
| D (s) | 2925 ± 73 | 2965 ± 65 | 2965 ± 65 | 0.891 |
| MA (au) | 58 ± 8 | 56 ± 11 | 56 ± 5 | 0.982 |
| MBP (mm Hg) | 123 ± 3 | 126 ± 2 | 125 ± 3 | 0.786 |
| HR (bpm) | 666 ± 16 | 689 ± 13 | 685 ± 11 | 0.461 |
D, episode duration; MA, motor activity (arbitrary units, au); MBP, mean blood pressure; HR, heart rate (beats per minute, bpm). Values are mean ± SEM in congenic mice with ablation of hypocretin neurons (TG, n = 6), congenital hypocretin deficiency (KO, n = 8), and wild-type controls (WT, n = 7) with C57Bl/6J genetic background.
Replication Experiments on HCRT-Neuron Ablated Mice with Mixed Genetic Background
Cataplexy-like episodes occurred in all hTG mice at a rate of 1.7 ± 0.4 in 24 h, representing < 0.2% of total recording time. These episodes did not occur in hWT, with the exception of 2 episodes in the light period in 1 hWT mouse. Results on hTG and hWT are reported in the Data Supplement (Tables S1–S3, Figures S3–S6). With respect to hWT, hTG did not show any significant increase in BP during either the light period of the day (Figure S4) or NREMS (Table S2 and Figure S6), and did not show any significant increase in heart rate during REMS (Table S2). However, the BP decrease on passing from wakefulness to NREMS was significantly smaller in hTG than in hWT in ancillary analyses during light and the dark periods (P < 0.027). With these exceptions, results on hTG exactly replicated those on TG.
DISCUSSION
The main finding of our study was that the sleep related decrease in BP was blunted in HCRT-deficient mice. Similar to narcoleptic patients,13 adult TG lack not only HCRT peptides, but also other signaling molecules, such as dynorphin, which are expressed by HCRT neurons in WT and KO.24 The phenotype associated with HCRT neuron deficiency depends on genetic background, the difference between the pure background of TG and the mixed background of hTG leading to late-onset obesity in the latter.20 On the other hand, hypothalamic HCRT expression in rat embryos25 suggests that developmental compensatory processes may occur in KO, which have congenital HCRT deficiency.18 Developmental compensation is less likely in TG, in which death of HCRT neurons starts after birth.19 We observed a blunted sleep related decrease in BP in TG, KO, and hTG, attesting to the statistical robustness of this phenomenon. However, sleep BP values showed substantial variability both within and among individuals in each group (Figures 2 and S5). Such variability highlights the complexity and redundancy of sleep related cardiovascular control, the functional neuroanatomy of which includes the medulla, midbrain, and amygdala, in addition to hypothalamic circuits.7 In this context, our results suggest that HCRT signaling does not play a necessary role, but rather a robust modulatory role that is more prominent in REMS. It is worth noting that in this study, BP did not decrease on passing from NREMS to REMS, as it had been previously reported in different inbred mouse strains including C57Bl/6J,26 but rather increased significantly (Figures 3, S2, and S6), similar to what occurs in rats and human subjects.7 The longer postoperative recovery (i.e., 12 days vs. 2 days26) allowed to mice in the present study by telemetric BP recordings may explain in part this discrepancy, as it has been shown to occur in cats.27
The second key finding of our study was that BP values in HCRT-deficient mice did not differ from those in controls during wakefulness and increased above those in controls during sleep (Tables 2 and S2). This finding contrasts with previous careful studies on BP in TG and KO mice, which did not take sleep into account and reported substantial hypotension in both models with respect to control mice.28,29 We have no conclusive explanation for this discrepancy, which partially reconciles BP data in narcoleptic mice with those in narcoleptic patients. To our knowledge, significant hypotension has never been reported in patients with narcolepsy-cataplexy, who suffer from a selective loss of functional HCRT neurons.12,13 Rather, these patients are hypertensive with respect to patients with idiopathic central nervous system hypersomnia.30,31 In our study, the BP increase in HCRT-deficient mice with respect to wild-type controls was more prominent and apparently more robust to changes in genetic background in REMS. However, nonsignificance of the difference in BP between hTG and hWT in NREMS (4 ± 3 mm Hg, Table S2) may have been a type II statistical error, this difference being similar to that between TG and WT in NREMS (4 ± 2 mm Hg, Table 2). Sleep related derangements in BP have been investigated in a small sample of narcoleptic patients by only one study, which measured BP intermittently, did not include BP measurements in wakefulness, and yielded negative results.32 This pioneering work is worth replicating in light of our observations on within- and between-subject variability in sleep BP.
In humans, even a 2 mm Hg sustained decrease in systolic BP is estimated to involve 10% lower stroke mortality and 7% lower mortality from other cardiovascular causes in middle age.33 Sleep related BP control may be even more relevant because in the Ohasama study, each 5% decrease in the decline in nocturnal systolic BP was associated with a 20% greater risk of cardiovascular mortality.1 In the later Dublin Outcome Study, the hazard ratio for each 10 mm Hg increase in nighttime systolic BP was 1.30 for stroke mortality and 1.21 for mortality from other cardiovascular causes.2 The powerful prognostic value of nighttime BP is also supported by more recent studies.3,4 These considerations raise the hypothesis that not only the clear-cut BP alterations that we found in REMS, but also the subtler BP changes that we found in NREMS in HCRT-deficient mice would have physiological and clinical significance if translated to human patients. To our knowledge, information on cardiovascular risk associated with HCRT deficiency and narcolepsy is altogether lacking. Further studies on aged mouse models of narcolepsy may help clarify this issue.
The results of our study do not easily fit with, and hence may challenge, the present view of HCRT signaling as mainly contributing to increase sympathetic outflow and BP.10 In order to assess the robustness of our findings, we thus felt it necessary to undertake an extensive phenotyping effort, which involved the analysis of > 2800 hours of recordings in 3 different genetic groups of HCRT-deficient mice and 2 independent control groups. With this effort, we laid the basis for additional experiments, which will be indispensable to unravel the detailed mechanisms that link HCRT signaling to sleep related BP control. We found similar BP derangements in TG and KO with respect to WT, suggesting that lack of HCRT release, as opposed to lack of HCRT neurons, is sufficient to alter BP during sleep. On the other hand, BP elevations in HCRT-deficient mice were not invariably associated with increases in heart rate. Such BP elevations were never associated with decreases in heart rate (Tables 2 and S2), suggesting involvement of vascular resistance increases and cardiac baroreflex resetting. These cardiovascular changes were not apparently linked to obesity because body weight did not differ significantly between HCRT-deficient mice and controls (Supplementary Materials and Methods). This was expected because obesity does not occur in TG and KO mice on a pure C57Bl/6J genetic background,20 and to avoid confounders, we studied hTG at the age at which obesity starts to ensue.20
Our findings on BP are strikingly similar to the observation by Mochizuki et al. that the sleep related decrease in body temperature is blunted in KO, so that body temperature in KO remains similar to that in WT in wakefulness and becomes higher than that in WT during sleep.34 Three hypothetical explanations have been proposed for these findings: a causative role of behavioral alterations, loss of HCRT effects during sleep, and carryover during sleep of mechanisms, which compensate for loss of HCRT effects during wakefulness.34 The first hypothesis cannot easily explain our findings. NREMS fragmentation may occur in HCRT-deficient mice35,36 but this effect was not significant in our study (Tables 1 and S1), in agreement with original reports on TG and KO.18,19 We observed fragmentation of waking behavior, which has been consistently reported in HCRT-deficient mice18,19,35,36; but BP did not differ between HCRT-deficient mice and controls even during sustained episodes of active wakefulness elicited by the cage-switch test (Tables 3 and S3). In terms of BP control, the second hypothesis implies that volume transmission exerted by low interstitial levels of HCRT37–39 during sleep, when synaptic activity of HCRT neurons is almost nil,40 entails a vasodepressive effect. Accordingly, HCRT injected in the nucleus tractus solitarii41 or cerebral ventricles42,43 decreases sympathetic outflow and BP at low doses and exerts the opposite effect at high doses. If this hypothesis is true, sleep related differences in BP between HCRT-deficient mice and wild-type controls will be more evident during the dark period, when interstitial HCRT in wild-type controls is physiologically the highest.37 This prediction was supported by ancillary analyses on our data in TG and hTG, but not in KO. Finally, the third hypothesis remains speculative at present. This hypothesis is intriguing because it implies that long-term regulation is exerted on BP in wakefulness rather than in sleep; it may also explain the discrepancy between our findings and previous ones on BP in TG and KO28,29 in terms of variable recruitment of long-term BP regulatory mechanisms in different experimental conditions.
In conclusion, we found that in HCRT-deficient mice, differences in BP between wakefulness and sleep states were blunted with respect to control mice, leading to sleep related increases in BP that were most prominent during REMS. These results provide proof of principle that chronic lack of HCRT signaling entails consequences on BP that are potentially adverse and differ among wake-sleep states. This conclusion should be regarded as preliminary until additional experiments elucidate its mechanisms and demonstrate its relevance for human cardiovascular risk.
DISCLOSURE STATEMENT
This was not an industry supported study. The authors have indicated no financial conflicts of interest.
ACKNOWLEDGMENTS
The Authors wish to thank Ms. Laura Lumachi for skillful technical assistance. This work was funded by the University of Bologna (RFO 07 and RFO 08). Institution at which the work was performed: Dipartimento di Fisiologia Umana e Generale, Alma Mater Studiorum - Università di Bologna, Italy.
ABBREVIATIONS
- ANOVA
Analysis of variance
- BP
Blood pressure
- EEG
Electroencephalogram
- EMG
Electromyogram
- HCRT
Hypocretin
- NREMS
Non–rapid eye movement sleep
- REMS
Rapid eye movement sleep
SUPPLEMENT
EXPANDED MATERIALS AND METHODS
Mouse Colonies
Experiments were performed on the following 5 age-matched groups of male mice:
Mice with postnatal ablation of hypocretin (HCRT) neurons (TG, n = 12) congenic to C57Bl/6J (13 generations of backcrossing). TG mice were hemizygous for a transgenic construct, which includes the N-terminally truncated cDNA of human Machado-Joseph disease gene (ataxin-3) with an expanded polyglutamine stretch as well as the 3.2 kb fragment of the 5′-upstream region of the human HCRT gene as a promoter.1 The HCRT-ataxin3 transgene is expressed selectively in HCRT neurons, which, as a result, are selectively and progressively destroyed after birth.1
Mice with congenital HCRT deficiency (KO, n = 8) homozygous for null mutation of the HCRT gene2 and congenic (9 generations of backcrossing) to C57Bl/6J.
Wild-type littermates of TG (WT, n = 10), which were studied as control mice with C57Bl/6J genetic background.
HCRT-neuron ablated mice (hTG, n = 7) hemizygous for the HCRT-ataxin3 transgene with mixed (3:1) C57Bl/6J:DBA/2J genetic background. This mixed background has been shown to enhance the metabolic phenotype associated with loss of HCRT neurons.3
Wild-type littermates of hTG (hWT, n = 6), which were studied as control mice with mixed (3:1) C57Bl/6J:DBA/2J genetic background.
Table S1.
Results of the analysis of wake-sleep behavior in hybrid mice with mixed genetic background
| State | Measure | Strain |
P value (t-test) | |
|---|---|---|---|---|
| hWT | hTG | |||
| W | % of time | 49.3 ± 1.7 | 48.8 ± 1.4 | 0.829 |
| eps/24h | 138 ± 10 | 184 ± 8 | 0.004 | |
| D (s) | 312 ± 32 | 228 ± 12 | 0.023 | |
| MA (au) | 13 ± 3 | 8 ± 1 | 0.262 | |
| NREMS | % of time | 43.2 ± 2.1 | 41.6 ± 1.2 | 0.503 |
| eps/24h | 381 ± 18 | 449 ± 40 | 0.157 | |
| D (s) | 99 ± 7 | 84 ± 10 | 0.281 | |
| REMS | % of time | 5.3 ± 0.5 | 5.3 ± 0.7 | 0.980 |
| eps/24h | 72 ± 7 | 73 ± 11 | 0.957 | |
| D (s) | 64 ± 2 | 65 ± 2 | 0.635 | |
| latency (s) | 516 ± 40 | 336 ± 12 | 0.001 | |
W, wakefulness; NREMS, non–rapid eye movement sleep; REMS, rapid eye movement sleep; % of time, percentage of total recording time spent in each state; eps/24h, number of episodes per 24-hour day; D, episode duration; MA, motor activity (arbitrary units, au); latency, time between onset of REMS episodes and termination of previous W episodes. Data are mean ± SEM in hybrid mice (mixed genetic background) with ablation of hypocretin neurons (hTG, n = 7) and their wild-type controls (hWT, n = 6).
Mouse colonies were maintained in the facilities of the Department of Human and General Physiology at the University of Bologna, Italy. Founder mice were generously provided by Prof. E. Mignot (Stanford University, USA) and consisted of the following individuals: 2 female and 1 male mice hemizygous for the HCRT-ataxin3 transgene and fully congenic (12 generations of backcrossing) to C57Bl/6J; 4 mice carrying a null mutation of the HCRT gene and congenic to C57Bl/6J (2 male homozygotes, 9 generations of backcrossing; 2 female heterozygotes, 10 generations of backcrossing). Founder mice hemizygous for the HCRT-ataxin3 transgene were backcrossed once to C57Bl/6J mice and then maintained by hemizygote × wild-type mating. Mice carrying a null mutation of the HCRT gene were maintained by heterozygote × heterozygote and heterozygote × homozygote mating. To obtain hTG, male mice hemizygous for the HCRT-ataxin3 transgene and congenic to C57Bl/6J (13 generations of backcrossing) were crossed with female (C57Bl/6J × DBA/2J)F1 hybrid mice (strain B6D2F1/J). C57Bl/6J mice and B6D2F1/J mice were purchased from Charles River, Calco, Italy.
Table S2.
Values of mean blood pressure and heart rate as a function of the wake-sleep state in hybrid mice with mixed genetic background
| Measure | State | Strain |
|
|---|---|---|---|
| hWT | hTG | ||
| MBP (mm Hg) | W | 112 ± 1 | 112 ± 3 |
| NREMS | 93 ± 2 | 97 ± 2 | |
| REMS | 97 ± 2 | 108 ± 3* | |
| HR (bpm) | W | 609 ± 16 | 600 ± 8 |
| NREMS | 533 ± 23 | 502 ± 14 | |
| REMS | 557 ± 20 | 560 ± 7 | |
W, wakefulness; NREMS, non-rapid-eye-movement sleep; REMS, rapid-eye-movement sleep; MBP, mean blood pressure; HR, heart rate (beats per minute, bpm). Values are mean ± SEM in hybrid mice (mixed genetic background) with ablation of hypocretin neurons (hTG, n = 7) and their wild-type controls (hWT, n = 6). ANOVA: state, P < 0.001 for MBP and HR; strain, P = 0.180 (MBP), P = 0.557 (HR); state × strain interaction, P < 0.001 (MBP), P = 0.040 (HR).
P < 0.05 vs. hWT (same state, t-test).
Table S3.
Analysis of aroused wakefulness (cage-switch test) in hybrid mice with mixed genetic background
| Measure | Strain |
P value (t-test) | |
|---|---|---|---|
| WT | TG | ||
| D (s) | 2091 ± 376 | 2146 ± 378 | 0.921 |
| MA (au) | 57 ± 7 | 56 ± 7 | 0.930 |
| MBP (mm Hg) | 121 ± 1 | 119 ± 4 | 0.703 |
| HR (bpm) | 668 ± 20 | 656 ± 17 | 0.678 |
D, episode duration; MA, motor activity (arbitrary units, au); MBP, mean blood pressure; HR, heart rate (beats per minute, bpm). Values are mean ± SEM in hybrid mice (mixed genetic background) with ablation of hypocretin neurons (hTG, n = 7) and their wild-type controls (hWT, n = 6).
Power spectral density (PSD) of the electroencephalographic signal (arbitrary units, au) during non–rapid eye movement sleep (NREMS) and rapid eye movement sleep (REMS) in congenic mice with ablation of hypocretin neurons (TG, n = 12), congenital hypocretin deficiency (KO, n = 8), and wild-type controls (WT, n = 10) with C57Bl/6J genetic background. Data are mean ± SEM. ANOVA: strain, P > 0.520 (NREMS), P > 0.321 (REMS).
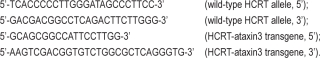
Mouse genotype was assessed in the facilities of the Centre for Applied Biomedical Research – CRBA, S. Orsola University Hospital, Bologna, Italy. DNA was extracted from bioptic tissue, amplified by polymerase chain reaction and resolved by gel electrophoresis. Primer sequences used for TG and hTG were:
 |
Primers sequences used for KO were:
Measurement of Brain HCRT1
In order to verify complete genetic ablation of HCRT neurons in TG mice on a pure C57Bl/6J genetic background, brain HCRT1 was measured after completion of recordings in all TG mice included in cardiovascular analysis (n = 12). For the purpose of comparison, brain HCRT1 was also measured in all WT mice (n = 10) as well as in 1 KO mouse, which were included in cardiovascular analysis. The whole brain was immediately removed after decapitation under deep isoflurane/N2O anesthesia and frozen at −80°C for subsequent processing. Processing consisted of thawing, gross dissection (8 blocks), boiling for 10 minutes in 2.5 mL acetic acid 0.5 mol/L, and flash-cooling on ice. One aliquot (50 μL) of the supernatant was taken for measurement of total protein concentration in duplicate with the Lowry technique (DC protein assay, Bio-Rad Italy, Segrate, Italy, with bovine serum albumin as standard). Two 50 μL aliquots were dried overnight in siliconized (Sigmacote, Sigma-Aldrich Italy, Milano, Italy) cryotubes under a fume cupboard hood for HCRT1 measurement. HCRT1 measurement was performed in triplicate with a fluorescent immunoassay kit (FEK 003-30, Phoenix Pharm. Inc., Burlingame, CA, USA; range 0-10,000 pg HCRT1/mL) after reconstituting the dried peptide solutions in 125 μL assay buffer and following manufacturer's instructions. All samples were processed simultaneously on the same immunoassay plate with a manufacturer-determined detection threshold of 46.6 pg HCRT1/mL. The measured intra-assay coefficient of variation was 4.5%. As expected, brain HCRT1 was below detection threshold in all TG mice and in the KO mouse, whereas it was above detection threshold in all WT mice. Brain HCRT1 in WT mice was 133 ± 45 fmol HCRT1/mg total protein, which agrees well with reported values in C57Bl/6J mice.4
Representative raw recordings showing transitions from non-rapid-eye-movement to rapid-eye-movement sleep. BP, blood pressure; EEG, electroencephalogram; EMG, electromyogram. Recordings were obtained in a wild-type mouse (WT, panels A and A′) and a congenic mouse with ablation of hypocretin neurons (TG. panels B and B′) with C57Bl/6J genetic background. Arrows in panels A and B evidence between-state transitions. Panels A′ and B′ show recordings at higher temporal resolution during the 12-s periods enclosed by green frames in panels A and B, respectively. EEG and EMG are shown in arbitrary units.
Age and Weight of the Mice Studied
At surgery, TG, KO, and WT mice were aged 14.6 ± 0.3 weeks, 14.4 ± 0.5 weeks, and 15.0 ± 0.4 weeks, respectively, and weighed 27.8 ± 0.4 g, 28.8 ± 0.6 g, and 28.1 ± 0.6 g, respectively. At surgery, hTG and hWT mice were aged 14.1 ± 0.3 weeks and 13.7 ± 0.3 weeks, respectively, and weighed 32.4 ± 1.3 g and 28.5 ± 1.3 g, respectively. Body weight did not differ significantly among TG, KO, and WT (P = 0.430; one-way ANOVA). Body weight tended to be significantly higher in hTG than in hWT (P = 0.060, t-test).
Power spectral density (PSD) of the electroencephalographic signal (arbitrary units, au) during non–rapid eye movement sleep (NREMS) and rapid eye movement sleep (REMS) in hybrid mice with mixed genetic background and ablation of hypocretin neurons (hTG, n = 7) and their wild-type controls (hWT, n = 6). Data are mean ± SEM. t-test: P > 0.132 (NREMS), P > 0.252 (REMS).
Mean blood pressure (MBP) and heart rate (HR) expressed as 24-hour profiles (left panels) or as averages in the light (L) and dark (D) periods (right panels). Bpm, beats per minute. For each mouse, each point in left panels was computed as the average MBP or HR value over all artifact-free 4-s epochs in the appropriate hourly interval of each recording day. Data are mean values in hybrid mice with mixed genetic background and ablation of hypocretin neurons (hTG, n = 7) and their wild-type controls (hWT, n = 6). Error bars indicate SEM. ANOVA: L-D period, P < 0.001 for MBP and HR; strain: P = 0.495 (MBP), P = 0.453 (HR); L-D period × strain interaction: P = 0.262 (MBP), P = 0.624 (HR). *P < 0.05 vs. hWT (same L-D period, t-test).
Difference in mean blood pressure (ΔMBP) between either non–rapid eye movement sleep (NREMS) or rapid eye movement sleep (REMS) and wakefulness. The upper panel shows mean values of ΔMBP within groups of hybrid mice with mixed genetic background and ablation of hypocretin neurons (hTG, n = 7) and their wild-type controls (hWT, n = 6). Error bars indicate SEM. *P < 0.05 vs. hWT (same state, t-test). The lower panel shows values of ΔMBP in each hTG and hWT mouse. Error bars in the lower panel indicate the standard deviation of MBP values among 4-s epochs in NREMS (x axis) and REMS (y axis) in each mouse.
Changes in mean blood pressure (MBP) on passing from non–rapid eye movement sleep (NREMS) to rapid eye movement sleep (REMS) in hybrid mice with mixed genetic background and ablation of hypocretin neurons (hTG, n = 7) and their wild-type controls (hWT, n = 6). Data are mean ± SEM and are expressed as absolute MBP values (upper panel) or as difference in MBP (ΔMBP, lower panel) with respect to baseline (thick horizontal bar). Statistical tests were performed on baseline MBP in NREMS and on both MBP and ΔMBP in REMS (thin horizontal bars). ANOVA, MBP: state, P < 0.001; strain, P = 0.030; state × strain interaction, P = 0.015. *P < 0.05 vs. hWT (same state, t-test).
Discrimination of Wake-Sleep States
Data analysis was performed with custom software developed in Matlab and its Signal Processing Toolbox (The MathWorks Inc., Natick, MA, USA). A visual scoring of wake-sleep states (wakefulness; non–rapid eye movement sleep [NREMS]; rapid eye movement sleep [REMS]) was performed by 3 trained investigators (S.B., C.B., and V.L.M.) on all consecutive 4-s epochs. Scoring was based on raw electroencephalographic (EEG) and electromyographic (EMG) recordings following criteria that were described in detail by our group.5,6 Artifacts in the EEG and EMG signals partially impeded discrimination of wake-sleep states only in 1 TG mouse (0.1% of recording time), 1 WT mouse (5.7% of recording time), and 1 hTG mouse (16.4% of recording time). The EEG and EMG signals showed features intermediate between different wake-sleep states in the following percentage of total recording time, expressed as mean ± SEM within group: TG, 2.9% ± 0.4%; KO, 3.6% ± 0.8%; WT, 3.7% ± 0.8%; hTG, 3.9% ± 0.8%; hWT, 2.1% ± 0.5%. Analysis of sleep macrostructure was performed with a threshold of 12 s (i.e., 3 consecutive 4-s epochs) for wake-sleep episode duration, and results were expressed with respect to recording time free of EEG and EMG artifacts.
Analysis of Cardiovascular Variables
While performing visual scoring of the wake-sleep states, investigators identified the 4-s epochs, in which noise in the pulse waveforms made the blood pressure (BP) signal of insufficient quality to allow accurate automatic determination of beat-to-beat mean BP and heart rate. This identification was performed on the basis of standardized time series of BP in a 12-s window centered on the 4-s epoch under evaluation, and, hence, with the investigators blind to the mean value of BP. BP artifact detection was then refined with a semi-automated procedure as previously described.5,6 After completion of this procedure, BP artifacts represented the following percentage of total recording time, expressed as mean ± SEM within group: TG, 2.9% ± 0.6%; KO, 3.2% ± 0.9%; WT, 8.3% ± 3.8%; hTG, 3.6% ± 0.5%; hWT, 4.9% ± 1.0%. Mean BP and heart rate were computed from the raw BP signal (sampling frequency 1024 Hz) in each artifact-free 4-s epoch. Beat-to-beat values of mean BP were computed by averaging all digitized raw BP values in each cardiac cycle. Heart rate was computed in each 4-s epoch as the reciprocal of the average time between the onset of successive systolic upstrokes. Transitions between full-blown (> 40 s) sleep episodes were automatically detected to analyze changes in mean BP on passing from NREMS to REMS. The following number of transitions from NREMS to REMS, expressed as mean ± SEM within group, were detected and analyzed: TG, 126 ± 9; KO, 145 ± 11; WT, 141 ± 11; hTG, 127 ± 17; hWT, 122 ± 12.
Statistical Analysis
Data were analyzed by analysis of variance (ANOVA) and t-test. Separate ANOVAs were performed on congenic mice (3-level between-subject factor: TG, KO, and WT) and on the replication set of hybrid mice (2-level between-subject factor: hTG and hWT). Analyses involving within-subject factors were performed with the GLM procedure and mixed-model design. In different analyses, the within-subject factor was either the light-dark period (2 levels), the wake-sleep state (3 levels), or the sleep state (sleep-state transitions, 2 levels). In case of significant interaction effects, the simple effect of the mouse strain was tested in each light-dark period, wake-sleep state, or sleep state with t-tests and pre-planned comparisons (congenic mice: TG vs. WT and KO vs. WT; hybrid mice: hTG vs. hWT). Statistical analyses were performed with the SPSS software (SPSS Inc., Chicago, IL, USA) with P < 0.05 considered to be statistically significant.
SUPPLEMENTAL REFERENCES
- 1.Hara J, Beuckmann CT, Nambu T, et al. Genetic ablation of orexin neurons in mice results in narcolepsy, hypophagia, and obesity. Neuron. 2001;30:345–54. doi: 10.1016/s0896-6273(01)00293-8. [DOI] [PubMed] [Google Scholar]
- 2.Chemelli RM, Willie JT, Sinton CM, et al. Narcolepsy in orexin knockout mice: molecular genetics of sleep regulation. Cell. 1999;98:437–51. doi: 10.1016/s0092-8674(00)81973-x. [DOI] [PubMed] [Google Scholar]
- 3.Hara J, Yanagisawa M, Sakurai T. Difference in obesity phenotype between orexin-knockout mice and orexin neuron-deficient mice with same genetic background and environmental conditions. Neurosci Lett. 2005;380:239–42. doi: 10.1016/j.neulet.2005.01.046. [DOI] [PubMed] [Google Scholar]
- 4.Mondal MS, Nakazato M, Matsukura S. Characterization of orexins (hypocretins) and melanin-concentrating hormone in genetically obese mice. Regul Pept. 2002;104:21–5. doi: 10.1016/s0167-0115(01)00345-7. [DOI] [PubMed] [Google Scholar]
- 5.Silvani A, Bastianini S, Berteotti C, et al. Sleep modulates hypertension in leptin-deficient obese mice. Hypertension. 2009;53:251–5. doi: 10.1161/HYPERTENSIONAHA.108.125542. [DOI] [PubMed] [Google Scholar]
- 6.Silvani A, Bastianini S, Berteotti C, et al. Dysregulation of heart rhythm during sleep in leptin-deficient obese mice. Sleep. 2010;33:355–61. doi: 10.1093/sleep/33.3.355. [DOI] [PMC free article] [PubMed] [Google Scholar]
REFERENCES
- 1.Ohkubo T, Hozawa A, Yamaguchi J, et al. Prognostic significance of the nocturnal decline in blood pressure in individuals with and without high 24-h blood pressure: the Ohasama study. J Hypertens. 2002;20:2183–9. doi: 10.1097/00004872-200211000-00017. [DOI] [PubMed] [Google Scholar]
- 2.Dolan E, Stanton A, Thijs L, et al. Superiority of ambulatory over clinic blood pressure measurement in predicting mortality. The Dublin Outcome Study. Hypertension. 2005;46:156–61. doi: 10.1161/01.HYP.0000170138.56903.7a. [DOI] [PubMed] [Google Scholar]
- 3.Ben-Dov IZ, Kark JD, Ben-Ishay D, Mekler J, Ben-Arie L, Bursztyn M. Predictors of all-cause mortality in clinical ambulatory monitoring. Unique aspects of blood pressure during sleep. Hypertension. 2007;49:1235–41. doi: 10.1161/HYPERTENSIONAHA.107.087262. [DOI] [PubMed] [Google Scholar]
- 4.Boggia J, Li Y, Thijs L, et al. Prognostic accuracy of day versus night ambulatory blood pressure: a cohort study. Lancet. 2007;370:1219–29. doi: 10.1016/S0140-6736(07)61538-4. [DOI] [PubMed] [Google Scholar]
- 5.Baust W, Bohnert B. The regulation of heart rate during sleep. Exp Brain Res. 1969;7:169–80. doi: 10.1007/BF00235442. [DOI] [PubMed] [Google Scholar]
- 6.Somers VK, Dyken ME, Mark AL, Abboud FM. Sympathetic nerve activity during sleep in normal subjects. New Engl J Med. 1993;328:303–7. doi: 10.1056/NEJM199302043280502. [DOI] [PubMed] [Google Scholar]
- 7.Silvani A. Physiological sleep-dependent changes in arterial blood pressure: central autonomic commands and baroreflex control. Clin Exp Pharmacol Physiol. 2008;35:987–94. doi: 10.1111/j.1440-1681.2008.04985.x. [DOI] [PubMed] [Google Scholar]
- 8.De Lecea L, Kilduff TS, Peyron C, et al. The hypocretins: hypothalamus-specific peptides with neuroexcitatory activity. Proc Natl Acad Sci USA. 1998;95:322–7. doi: 10.1073/pnas.95.1.322. [DOI] [PMC free article] [PubMed] [Google Scholar]
- 9.Sakurai T, Amemiya A, Ishii M, et al. Orexins and orexin receptors: a family of hypothalamic neuropeptides and G protein-coupled receptors that regulate feeding behavior. Cell. 1998;92:573–85. doi: 10.1016/s0092-8674(00)80949-6. [DOI] [PubMed] [Google Scholar]
- 10.Sakurai T. The neural circuit of orexin (hypocretin): maintaining sleep and wakefulness. Nat Rev Neurosci. 2007;8:171–81. doi: 10.1038/nrn2092. [DOI] [PubMed] [Google Scholar]
- 11.Thannickal TC, Lai YY, Siegel JM. Hypocretin (orexin) cell loss in Parkinson's disease. Brain. 2007;130:1586–95. doi: 10.1093/brain/awm097. [DOI] [PMC free article] [PubMed] [Google Scholar]
- 12.Peyron C, Faraco J, Rogers W, et al. A mutation in a case of early onset narcolepsy and a generalized absence of hypocretin peptides in human narcoleptic brains. Nat Med. 2000;6:991–7. doi: 10.1038/79690. [DOI] [PubMed] [Google Scholar]
- 13.Crocker A, España RA, Papadopoulou M, et al. Concomitant loss of dynorphin, NARP, and orexin in narcolepsy. Neurology. 2005;65:1184–8. doi: 10.1212/01.wnl.0000168173.71940.ab. [DOI] [PMC free article] [PubMed] [Google Scholar]
- 14.Yamanaka A, Beuckmann CT, Willie JT, et al. Hypothalamic orexin neurons regulate arousal according to energy balance in mice. Neuron. 2003;38:701–13. doi: 10.1016/s0896-6273(03)00331-3. [DOI] [PubMed] [Google Scholar]
- 15.Funato H, Tsai AL, Willie JT, et al. Enhanced orexin receptor-2 signaling prevents diet-induced obesity and improves leptin sensitivity. Cell Metab. 2009;9:64–76. doi: 10.1016/j.cmet.2008.10.010. [DOI] [PMC free article] [PubMed] [Google Scholar]
- 16.Brisbare-Roch C, Dingemanse J, Koberstein R, et al. Promotion of sleep by targeting the orexin system in rats, dogs and humans. Nat Med. 2007;13:150–5. doi: 10.1038/nm1544. [DOI] [PubMed] [Google Scholar]
- 17.Winrow CJ, Tanis KQ, Reiss DR, et al. Orexin receptor antagonism prevents transcriptional and behavioral plasticity resulting from stimulant exposure. Neuropharmacology. 2010;58:185–94. doi: 10.1016/j.neuropharm.2009.07.008. [DOI] [PubMed] [Google Scholar]
- 18.Chemelli RM, Willie JT, Sinton CM, et al. Narcolepsy in orexin knockout mice: molecular genetics of sleep regulation. Cell. 1999;98:437–51. doi: 10.1016/s0092-8674(00)81973-x. [DOI] [PubMed] [Google Scholar]
- 19.Hara J, Beuckmann CT, Nambu T, et al. Genetic ablation of orexin neurons in mice results in narcolepsy, hypophagia, and obesity. Neuron. 2001;30:345–54. doi: 10.1016/s0896-6273(01)00293-8. [DOI] [PubMed] [Google Scholar]
- 20.Hara J, Yanagisawa M, Sakurai T. Difference in obesity phenotype between orexin-knockout mice and orexin neuron-deficient mice with same genetic background and environmental conditions. Neurosci Lett. 2005;380:239–42. doi: 10.1016/j.neulet.2005.01.046. [DOI] [PubMed] [Google Scholar]
- 21.Silvani A, Bastianini S, Berteotti C, et al. Sleep modulates hypertension in leptin-deficient obese mice. Hypertension. 2009;53:251–5. doi: 10.1161/HYPERTENSIONAHA.108.125542. [DOI] [PubMed] [Google Scholar]
- 22.Silvani A, Bastianini S, Berteotti C, et al. Dysregulation of heart rhythm during sleep in leptin-deficient obese mice. Sleep. 2010;33:355–61. doi: 10.1093/sleep/33.3.355. [DOI] [PMC free article] [PubMed] [Google Scholar]
- 23.Scammell TE, Willie JT, Guilleminault C, Siegel JM. A consensus definition of cataplexy in mouse models of narcolepsy. Sleep. 2009;32:111–6. [PMC free article] [PubMed] [Google Scholar]
- 24.Chou TC, Lee CE, Lu J, et al. Orexin (hypocretin) neurons contain dynorphin. J Neurosci. 2001;21:RC168. doi: 10.1523/JNEUROSCI.21-19-j0003.2001. [DOI] [PMC free article] [PubMed] [Google Scholar]
- 25.Van Den Pol AN, Patrylo PR, Ghosh PK, Gao XB. Lateral hypothalamus: early developmental expression and response to hypocretin (orexin) J Comp Neurol. 2001;433:349–63. doi: 10.1002/cne.1144. [DOI] [PubMed] [Google Scholar]
- 26.Campen MJ, Tagaito Y, Jenkins TP, Smith PL, Schwartz AR, O'Donnel CP. Phenotypic differences in the hemodynamic response during REM sleep in six strains of inbred mice. Physiol Genomics. 2002;11:227–34. doi: 10.1152/physiolgenomics.00031.2002. [DOI] [PubMed] [Google Scholar]
- 27.Sei H, Sakai K, Kanamori N, Salvert D, Vanni-Mercier G, Jouvet M. Long-term variations of arterial blood pressure during sleep in freely moving cats. Physiol Behav. 1994;55:673–79. doi: 10.1016/0031-9384(94)90043-4. [DOI] [PubMed] [Google Scholar]
- 28.Kayaba Y, Nakamura A, Kasuya Y, et al. Attenuated defense response and low basal blood pressure in orexin knockout mice. Am J Physiol. 2003;285:R581–93. doi: 10.1152/ajpregu.00671.2002. [DOI] [PubMed] [Google Scholar]
- 29.Zhang W, Sakurai T, Fukuda Y, Kuwaki T. Orexin neuron-mediated skeletal muscle vasodilation and shift of baroreflex during defense response in mice. Am J Physiol. 2006;290:R1654–63. doi: 10.1152/ajpregu.00704.2005. [DOI] [PubMed] [Google Scholar]
- 30.Baker TL, Guilleminault C, Nino-Murcia G, Dement WC. Comparative polysomnographic study of narcolepsy and idiopathic central nervous system hypersomnia. Sleep. 1986;9:232–42. doi: 10.1093/sleep/9.1.232. [DOI] [PubMed] [Google Scholar]
- 31.Poli F, Plazzi G, Di Dalmazi G, et al. Body mass index-independent metabolic alterations in narcolepsy with cataplexy. Sleep. 2009;32:1491–7. doi: 10.1093/sleep/32.11.1491. [DOI] [PMC free article] [PubMed] [Google Scholar]
- 32.Guilleminault C, Salva MA, Mancuso J, Hayes B. Narcolepsy, cataplexy, heart rate, and blood pressure. Sleep. 1986;9:222–6. doi: 10.1093/sleep/9.1.222. [DOI] [PubMed] [Google Scholar]
- 33.Lewington S, Clarke R, Qizilbash N, Peto R, Collins R. Age-specific relevance of usual blood pressure to vascular mortality: a meta-analysis of individual data for one million adults in 61 prospective studies. Lancet. 2002;360:1903–13. doi: 10.1016/s0140-6736(02)11911-8. [DOI] [PubMed] [Google Scholar]
- 34.Mochizuki T, Klerman EB, Sakurai T, Scammell TE. Elevated body temperature during sleep in orexin knockout mice. Am J Physiol. 2006;291:R533–40. doi: 10.1152/ajpregu.00887.2005. [DOI] [PMC free article] [PubMed] [Google Scholar]
- 35.Mochizuki T, Crocker A, McCormack S, Yanagisawa M, Sakurai T, Scammell TE. Behavioral state instability in orexin knock-out mice. J Neurosci. 2004;24:6291–300. doi: 10.1523/JNEUROSCI.0586-04.2004. [DOI] [PMC free article] [PubMed] [Google Scholar]
- 36.Zhang S, Zeitzer JM, Sakurai T, Nishino S, Mignot E. Sleep/wake fragmentation disrupts metabolism in a mouse model of narcolepsy. J Physiol. 2007;581:649–63. doi: 10.1113/jphysiol.2007.129510. [DOI] [PMC free article] [PubMed] [Google Scholar]
- 37.Yoshida Y, Fujiki N, Nakajima T, et al. Fluctuation of extracellular hypocretin-1 (orexin A) levels in the rat in relation to the light-dark cycle and sleep-wake activities. Eur J Neurosci. 2001;14:1075–81. doi: 10.1046/j.0953-816x.2001.01725.x. [DOI] [PubMed] [Google Scholar]
- 38.Kiyashchenko LI, Mileykovskiy BY, Maidment N, et al. Release of hypocretin (orexin) during waking and sleep states. J Neurosci. 2002;22:5282–6. doi: 10.1523/JNEUROSCI.22-13-05282.2002. [DOI] [PMC free article] [PubMed] [Google Scholar]
- 39.Zheng H, Patterson LM, Berthoud HR. Orexin-A projections to the caudal medulla and orexin-induced c-Fos expression, food intake, and autonomic function. J Comp Neurol. 2005;485:127–42. doi: 10.1002/cne.20515. [DOI] [PubMed] [Google Scholar]
- 40.Mileykovskiy BY, Kiyashchenko LI, Siegel JM. Behavioral correlates of activity in identified hypocretin/orexin neurons. Neuron. 2005;46:787–98. doi: 10.1016/j.neuron.2005.04.035. [DOI] [PMC free article] [PubMed] [Google Scholar]
- 41.Shih CD, Chuang YC. Nitric oxide and GABA mediate bi-directional cardiovascular effects of orexin in the nucleus tractus solitarii of rats. Neuroscience. 2007;149:625–35. doi: 10.1016/j.neuroscience.2007.07.016. [DOI] [PubMed] [Google Scholar]
- 42.Tanida M, Niijima A, Shen J, et al. Dose-different effects of orexin-A on the renal sympathetic nerve and blood pressure in urethane-anesthetized rats. Exp Biol Med. 2006;231:1616–25. doi: 10.1177/153537020623101006. [DOI] [PubMed] [Google Scholar]
- 43.Shen J, Tanida M, Yao JF, Niijima A, Nagai K. Biphasic effects of orexin-A on autonomic nerve activity and lipolysis. Neurosci Lett. 2008;444:166–71. doi: 10.1016/j.neulet.2008.08.031. [DOI] [PubMed] [Google Scholar]
Associated Data
This section collects any data citations, data availability statements, or supplementary materials included in this article.
Supplementary Materials
Table S1.
Results of the analysis of wake-sleep behavior in hybrid mice with mixed genetic background
| State | Measure | Strain |
P value (t-test) | |
|---|---|---|---|---|
| hWT | hTG | |||
| W | % of time | 49.3 ± 1.7 | 48.8 ± 1.4 | 0.829 |
| eps/24h | 138 ± 10 | 184 ± 8 | 0.004 | |
| D (s) | 312 ± 32 | 228 ± 12 | 0.023 | |
| MA (au) | 13 ± 3 | 8 ± 1 | 0.262 | |
| NREMS | % of time | 43.2 ± 2.1 | 41.6 ± 1.2 | 0.503 |
| eps/24h | 381 ± 18 | 449 ± 40 | 0.157 | |
| D (s) | 99 ± 7 | 84 ± 10 | 0.281 | |
| REMS | % of time | 5.3 ± 0.5 | 5.3 ± 0.7 | 0.980 |
| eps/24h | 72 ± 7 | 73 ± 11 | 0.957 | |
| D (s) | 64 ± 2 | 65 ± 2 | 0.635 | |
| latency (s) | 516 ± 40 | 336 ± 12 | 0.001 | |
W, wakefulness; NREMS, non–rapid eye movement sleep; REMS, rapid eye movement sleep; % of time, percentage of total recording time spent in each state; eps/24h, number of episodes per 24-hour day; D, episode duration; MA, motor activity (arbitrary units, au); latency, time between onset of REMS episodes and termination of previous W episodes. Data are mean ± SEM in hybrid mice (mixed genetic background) with ablation of hypocretin neurons (hTG, n = 7) and their wild-type controls (hWT, n = 6).
Table S2.
Values of mean blood pressure and heart rate as a function of the wake-sleep state in hybrid mice with mixed genetic background
| Measure | State | Strain |
|
|---|---|---|---|
| hWT | hTG | ||
| MBP (mm Hg) | W | 112 ± 1 | 112 ± 3 |
| NREMS | 93 ± 2 | 97 ± 2 | |
| REMS | 97 ± 2 | 108 ± 3* | |
| HR (bpm) | W | 609 ± 16 | 600 ± 8 |
| NREMS | 533 ± 23 | 502 ± 14 | |
| REMS | 557 ± 20 | 560 ± 7 | |
W, wakefulness; NREMS, non-rapid-eye-movement sleep; REMS, rapid-eye-movement sleep; MBP, mean blood pressure; HR, heart rate (beats per minute, bpm). Values are mean ± SEM in hybrid mice (mixed genetic background) with ablation of hypocretin neurons (hTG, n = 7) and their wild-type controls (hWT, n = 6). ANOVA: state, P < 0.001 for MBP and HR; strain, P = 0.180 (MBP), P = 0.557 (HR); state × strain interaction, P < 0.001 (MBP), P = 0.040 (HR).
P < 0.05 vs. hWT (same state, t-test).
Table S3.
Analysis of aroused wakefulness (cage-switch test) in hybrid mice with mixed genetic background
| Measure | Strain |
P value (t-test) | |
|---|---|---|---|
| WT | TG | ||
| D (s) | 2091 ± 376 | 2146 ± 378 | 0.921 |
| MA (au) | 57 ± 7 | 56 ± 7 | 0.930 |
| MBP (mm Hg) | 121 ± 1 | 119 ± 4 | 0.703 |
| HR (bpm) | 668 ± 20 | 656 ± 17 | 0.678 |
D, episode duration; MA, motor activity (arbitrary units, au); MBP, mean blood pressure; HR, heart rate (beats per minute, bpm). Values are mean ± SEM in hybrid mice (mixed genetic background) with ablation of hypocretin neurons (hTG, n = 7) and their wild-type controls (hWT, n = 6).
Power spectral density (PSD) of the electroencephalographic signal (arbitrary units, au) during non–rapid eye movement sleep (NREMS) and rapid eye movement sleep (REMS) in congenic mice with ablation of hypocretin neurons (TG, n = 12), congenital hypocretin deficiency (KO, n = 8), and wild-type controls (WT, n = 10) with C57Bl/6J genetic background. Data are mean ± SEM. ANOVA: strain, P > 0.520 (NREMS), P > 0.321 (REMS).
Representative raw recordings showing transitions from non-rapid-eye-movement to rapid-eye-movement sleep. BP, blood pressure; EEG, electroencephalogram; EMG, electromyogram. Recordings were obtained in a wild-type mouse (WT, panels A and A′) and a congenic mouse with ablation of hypocretin neurons (TG. panels B and B′) with C57Bl/6J genetic background. Arrows in panels A and B evidence between-state transitions. Panels A′ and B′ show recordings at higher temporal resolution during the 12-s periods enclosed by green frames in panels A and B, respectively. EEG and EMG are shown in arbitrary units.
Power spectral density (PSD) of the electroencephalographic signal (arbitrary units, au) during non–rapid eye movement sleep (NREMS) and rapid eye movement sleep (REMS) in hybrid mice with mixed genetic background and ablation of hypocretin neurons (hTG, n = 7) and their wild-type controls (hWT, n = 6). Data are mean ± SEM. t-test: P > 0.132 (NREMS), P > 0.252 (REMS).
Mean blood pressure (MBP) and heart rate (HR) expressed as 24-hour profiles (left panels) or as averages in the light (L) and dark (D) periods (right panels). Bpm, beats per minute. For each mouse, each point in left panels was computed as the average MBP or HR value over all artifact-free 4-s epochs in the appropriate hourly interval of each recording day. Data are mean values in hybrid mice with mixed genetic background and ablation of hypocretin neurons (hTG, n = 7) and their wild-type controls (hWT, n = 6). Error bars indicate SEM. ANOVA: L-D period, P < 0.001 for MBP and HR; strain: P = 0.495 (MBP), P = 0.453 (HR); L-D period × strain interaction: P = 0.262 (MBP), P = 0.624 (HR). *P < 0.05 vs. hWT (same L-D period, t-test).
Difference in mean blood pressure (ΔMBP) between either non–rapid eye movement sleep (NREMS) or rapid eye movement sleep (REMS) and wakefulness. The upper panel shows mean values of ΔMBP within groups of hybrid mice with mixed genetic background and ablation of hypocretin neurons (hTG, n = 7) and their wild-type controls (hWT, n = 6). Error bars indicate SEM. *P < 0.05 vs. hWT (same state, t-test). The lower panel shows values of ΔMBP in each hTG and hWT mouse. Error bars in the lower panel indicate the standard deviation of MBP values among 4-s epochs in NREMS (x axis) and REMS (y axis) in each mouse.
Changes in mean blood pressure (MBP) on passing from non–rapid eye movement sleep (NREMS) to rapid eye movement sleep (REMS) in hybrid mice with mixed genetic background and ablation of hypocretin neurons (hTG, n = 7) and their wild-type controls (hWT, n = 6). Data are mean ± SEM and are expressed as absolute MBP values (upper panel) or as difference in MBP (ΔMBP, lower panel) with respect to baseline (thick horizontal bar). Statistical tests were performed on baseline MBP in NREMS and on both MBP and ΔMBP in REMS (thin horizontal bars). ANOVA, MBP: state, P < 0.001; strain, P = 0.030; state × strain interaction, P = 0.015. *P < 0.05 vs. hWT (same state, t-test).