

Abstract
This study uses quantitative T2* imaging to track ferumoxides-protamine sulfate (FEPro) labeled MDA-MB-231BRL human breast cancer cells (231BRL) that metastasize to the nude rat brain. Four cohorts of nude rats were intracardiac (IC) injected with either FEPro labeled, unlabeled, TRIAL treated (to induce apoptosis) 231BRL cells or saline in order to develop metastatic breast cancer in the brain. The rat heads were imaged serially over 3-4 weeks using a gradient multi-echo and turbo spin echo pulse sequences at 3 Tesla with a solenoid receive only 4cm diameter coil. Quantitative T2* maps of whole brain were obtained by applying single exponential fitting to the signal intensity of T2* images and the distribution of T2* values in brain voxels were calculated. MRI findings were correlated with Prussian blue (PB) stain and immunohistochemical stain for iron in breast cancer and macrophages. Quantiative analysis of T2* from the brain voxels demonstrated a significant shift to lower values following IC injection of FEPro labeled 231BRL cells as compared to animals that received unlabeled cells or apoptotic cells or saline. Quartile analysis based on the T2* distribution obtained from brain voxels demonstrated significant differences (p<0.0083) in number of voxels with T2* values between 10-35 (Q1), 36-60 (Q2) and 61-86 (Q3) milliseconds from day 1 to 3 weeks post infusion of labeled 231BRL cells compared to baseline scans. There was no significant differences in the distribution of T2* obtained from serial MRI in rats receiving unlabeled or TRIAL treated cells or saline. Histological analysis demonstrated isolated PB positive breast cancer cells scattered in brains of rats that received labeled cells compared to animals that received unlabeled or apoptotic cells. Quantitative T2* analysis of FEPro labeled metastasized cancer cells was possible even after the hypointense voxels are no longer visible on T2*-weighted images.
Keywords: MRI, quantification, cellular tracking, T2* map, histogram, brain metastasis, breast cancer, superparamagnetic iron oxides (SPIO)
INTRODUCTION
Magnetic labeling of cells with superparamagnetic iron oxides (SPIO) particles provides the ability to monitor the migration of labeled cells into tissues by MRI following direct implantation or intravenous or arterial infusion (1-18). Single or clusters of magnetically labeled cells in tissues are usually detected as hypointense voxels on T2 and T2* weighted images (4,9,11,13,19-21) or hyperintense voxels on “white marker” images (22). As cells divide the SPIO in the cells are distributed symmetrically or asymmetrically in daughter cells (23) potentially limiting the ability to visualize transplanted cells in tissues by MRI (2,24).
Quantifying the numbers of SPIO labeled cells in a voxel on T2* weighted (T2*w) images from experimental studies is challenging (25). Recently, in vitro (26) and in vivo (27) visualization of single breast cancer cells labeled with micron sized superparamagnetic iron oxide nanoparticles (MPIO) at 1.5T has been reported. There are also reports of single stem cell or immune cell detection using high field strength systems when cells are labeled with MPIO (28-31) or SPIO nanoparticles (16,27,32,33). However, validation of the number of magnetically labeled cells within tissues by counting the hypointense voxels is inefficient and identification of these voxels is dependent on their conspicuity in comparison to signal intensities (SI) from surrounding parenchyma. Several investigators have suggested that between 500-1,000 SPIO nanoparticles labeled dendritic cells or stem cells can be detected as hypointense regions on T2*-weighted images at clinically relevant MRI field strengths (14,34,35). However, these studies depend on the qualitative evaluation of the images to detect or delineate the migration of magnetically labeled cells within target tissues or by double labeling of cells with Indium111 oxine and SPIO, and quantifying the numbers of labeled cells using single photon emission computerized tomography (14). MR hardware instability, partial volume effects and or poor signal to noise of T2*-weighted images may also limit the detection of relatively few numbers of SPIO labeled cells within a voxel (39). However, quantitative T2* maps derived from multi echo gradient echo pulse sequences (MGRE) that are not routinely used to determine the presence of iron labeled cells have been used to quantify small numbers of SPIO labeled cells within tumors (36).
The purpose of this study was to determine the utility of using T2* maps derived from MGRE pulse sequence to track the dilution of SPIO labeled breast cancer cells over time that subsequently developed into brain metastases in the nude rat model.
EXPERIMENTAL
Cell Line And Fepro Labeling
The brain seeking metastatic breast cancer cell line MDA-MB-231BR-Luc (231BRL) (provided by Diane Palmieri, National Cancer Institute NIH) were cultured with DMEM growth media containing 10% fetal bovine serum and 1 % penicillin streptomycin antibiotics at 37 C° in a 5% CO2 as previously described (37,38). Culture media and related supplies were purchased from Gibco® (Invitrogen, Carlsbad, CA). Labeling procedure of the 231BRL cells with ferumoxides (Feridex IV ®, 11.2 mg/ml, Berlex Laboratories, Wayne, NJ, USA) contrast agent complexed to preservative free protamine sulfate (10 mg/ml, American Pharmaceuticals Partner, Schaumburg, IL, USA) followed established protocol (3). After incubation, trypsinized cells were purified by washing with 10 units/ml heparinized phosphate buffered saline (PBS) 3 times and filtered through 40μm nylon mesh (BD Bioscience, Bedford, MA, USA). Cellular viability and proliferation of FEPro labeled and unlabeled cells were evaluated as previously described by trypan blue exclusion test and cell proliferation assay using the manufacturer’s standard protocol (3, 36).
FEPro labeled 231BRL cells were incubated overnight with 500 ng/ml of tumor necrosis factor-related apoptosis inducing ligand (Recombinant Human TRAIL/APO2L, Chemicon International, Temecula, CA) to determine the effect of dead labeled cells on the T2* measurements from the brain. Apoptotic cells were determined using the VYBRANT® apoptosis assay kit #2-Alexa flour 588 annexin V/ propidium iodide (Invitrogen, Carlsbad, CA) and flow cytometry (FACS Calibur, Becton Dickinson, Franklin Lakes, NJ).
Animal model
All animal studies were approved by the animal care and use committee at the National Institutes of Health. All animal procedures for producing the metastatic breast cancer in the brain of nude rats have been previously described (38). In brief, rats were anesthetized with isoflurane gas and intracardiac (IC) injection of breast cancer cells in heparinized phosphate buffered saline (PBS) or PBS alone was performed using sterile technique under ultrasound guidance into the left ventricle (37). For this study, twenty nine 6-7-week-old female nude rats (Crl:NIH-rnu, Charles River, Wilmington, MA) were divided into 4 groups: Group 1 rats (n=12) received FEPro labeled 231BRL cells; Group 2 rats (n=5) received unlabeled 231BRL cells; Group 3 rats (n=4) were injected 200μl PBS without cells; Group 4 rats (n=4) received TRAIL treated FEPro labeled 231 BRL cells.
Magnetic Resonance Imaging
MRI scanning of the rat was performed prior to and subsequently on days 1, 2 or 3 and weekly post IC infusion of 231BRL cells. A 3-Tesla MRI unit (Intera, Philips Medical System, Netherlands, B.V.) with a solenoid 4 cm receive only coil that is mounted perpendicular to the main magnetic field (Philips Research Laboratories, Germany) was used with the following pulse sequences: T2-weighted turbo spin echo (TSE) imaging, TR/TE = 3200/60 ms, TSE factor = 12, number of average = 8, FOV 50 mm, slice thickness 0.5 mm, matrix 224×256, reconstructed resolution 100×100 μm; T2*-weighted multi-shot echo planar imaging sequence with blip-off echo planar readout (MEPI) was used for creating T2* maps with TR/TE = 4560/28 ms, 15 echos, flip angle 30°, number of average = 2, FOV = 50 mm, slice thickness 0.5 mm, matrix 176×256, reconstructed resolution 200×200 μm. The MEPI research pulse sequence as used in this study at 3T in order to maximize the use of the clinical scanner gradients resulting in high resolution images in reasonable scan times. The conventional multiple gradient echo sequence used for routine clinical MRI studies did not have the performance features (i.e., echo train length, slice thickness, matrix size and field of view) required for this study. The total MRI scanning time was approximately 40 minutes per rat.
Pulse chase experiment and iron content measurement
To validate changes in T2* as a result of dilution of SPIO with cancer cell division, a pulse chase experiment was performed. FEPro labeled and unlabeled 231BRL cells were allowed to proliferate in culture with media changes every 3 days and were harvested at different time points (i.e., day 1, 3 and weeks 1, 2, 3 and 4) following initial labeling. FEPro labeled and unlabeled 231BRL cells were collected centrifuged and 106 cells were resuspended homogeneously in 1 ml of 1% agar at 60°C and then chilled at 4°C to allow the suspensions to solidify. Tubes containing cells in agar were kept at 4°C until further study. MRI T2* map was performed using same scan parameters as in vivo study to determine T2* values. Prussian blue (PB) stains were preformed on cytospins of harvested cells and iron content on the samples was performed using NMR relaxometry. FEPro labeled and unlabeled 106 cells were completely dissolved in 1ml of 5N hydrochloric acid. By using variable-field relaxometer (Southwest Research Institute, San Antonio, TX) intracellular iron concentration per cell was determined as previously described (2,4,7).
Image and statistical analysis
Quantitative T2* maps of the brain were obtained from MEPI images using MEDx image analysis software (Medical Numerics, Bethesda, MD) fitting the signal (S) intensity of each voxel from the gradient echo images to a mono-exponential decay as a function of echo time.
| (1) |
Region of interests were drawn to extract brain voxels from the T2* maps by an experienced technologist (B.K.L.). The total number of voxels from the brain was determined and used to normalize the frequency distribution of the number of voxels with a specific T2* value using standard spreadsheet software. Normalization allowed for comparison over time and across subjects and groups. Normalized histograms of the T2* data were used for further statistical analysis. Only voxels with T2* values between 10-110 milliseconds were used for this study because less than 0.005% of total brain voxels had a T2* value <10 ms or >110 ms. Quartile (Q) analysis was performed from the T2* normalized histogram by summing the number of voxels per quartile (i.e., Q1 = 10-35 ms, Q2 = 36-60 ms, Q3 = 61-85 ms, and Q4 = 66-110 ms). Statistical analysis was performed using standard spreadsheet software and JMP (version 7.0.1.2 SAS, Cary NC) using descriptive statistics to determine histogram means and one way analysis of variance to compare different time points among the groups of animals for each quartile. Statistical significance was based on a one-way analysis of variance comparing means for all pairs with Tukey-Kramer HSD (39). Statistical significant p values (<0.05) were calculated with Bonferroni correction for multiple comparisons
Histopathology
Euthanized rats were perfused with heparinzed saline and PBS containing 4 % paraformaldehyde and 3% sucrose for histological examination. Sliced whole brain in the MR imaging plane was embedded in paraffin and 6 micron thick sections were obtained. Deparaffinized slides were stained with Perl’s reagent (PB) for the presence of intracellular iron (Prussian blue) and counterstained with nuclear fast red as previously described (7). Consecutive sections were immunohistochemically (IHC) stained with IgG anti-human cytokeratin antibody (AE1/AE3, DacoCytomation, Denmark) to detect the presence of human breast cancer, or stained with mouse IgG anti rat CD68 EDX1 antibody (Abcam, Cambridge, MA) to detect rat macrophages. Deparaffinized slides were hydrated with graded alcohol series, treated with 3 % H2O2 for 15min to neutralize cellular peroxidase and then washed with PBS buffer and incubated with Scytek superblock (Scytek Laboratories, Logan, UT) for 4 min. After blotting excess of serum cytokeratin or CD68 primary antibody was applied at 4 °C overnight. Slides were treated with HRP conjugated secondary antibody for 2-3 hours and then the slides stained with ImPACT DAB (3,3′-diaminobenzidine) for less than 5 min and counterstained with Nuclear Fast Red (Scytek Laboratories, Logan, UT). PBS buffer washing was done between each step of procedure. Three to five sections were reviewed from 4 different brain slices from each rat. Histopathology slides were reviewed and photographed using light microscopy (BX50F, Olympus Optical Co., LTD., Japan) and the images were processed using Adobe Photoshop 7.0 (San Jose, CA).
RESULTS
Cell labeling
There was no difference in cell viability between FEPro labeled (98.9 ± 0.8 %) and unlabeled 231BRL cells (99.3 ± 0.8 %) using the trypan blue exclusion assay. In addition, there was no difference in optical densities of unlabeled (1.25 ± 0.09) and FEPro labeled cells (1.18 ± 0.18) measured by MTS cell proliferation assay. Approximately 100% 231 BRL were Prussian blue positive by light microscopy. FACS analysis of TRAIL treated FEPro labeled 231BRL cells showed that 92.6% of cells were apoptotic and 0.4% cells were dead. The average iron content for the FEPro labeled 231BRL cells was 14 ± 2.3 pg iron/cell and TRAIL treated labeled 231BRL cells was 6.7 ± 1.4 pg iron/cell, whereas iron content for unlabeled 231BRL cells was 0.2 ± 0.1 pg.
In vitro analysis
Figure 1 contains a summary of the pulse chase experiments monitoring the serial dilution of FEPro in 231BRL cells over 4 weeks by MRI and histology. T2* maps and R2* (1/ T2*) analysis of label cell phantoms at different time points was performed. T2* maps from the cell phantom demonstrated an increase in T2* values as tumor cells proliferated with time that was consistent with the dilution of PB staining (Figure 1B) and iron content (Figure 1D). There was a linear correlation between R2* and iron content in the FEPro labeled 231BRL cells (R2 = 0.976) (Figure 1E). In FEPro labeled 231BRL cells, intracellular iron contents were as follows: 13.9 ± 3 pg/cell at day 0, 7.2 ± 1.7 pg/cell at day 1, 2.1 ± 0.4 pg/cells at day 3, with a plateau about 1.3 pg/cell during week 1-4. The iron content of unlabeled control cells was 0.2 ± 0.1 pg/cell. Histogram plots of the distribution of T2* values from cell phantoms demonstrate the changes that occur over time as FEPro labeled cells proliferate and in comparison to unlabeled cells or agarose phantoms (Figure 1F). Box plot derived demonstrate the mean T2* differences over time from labeled cell phantoms. The T2* changes that are observed in the labeled cell proliferation study should be used as an approximation of the T2* changes observed in the Group 1 rats following injection of labeled cells (Figure 2) since other factors such as metabolism of the SPIO, dilution through cell division and clearance into the circulation of apoptotic or dead cells would result in a changes in T2* maps similar to baseline images.
Figure 1.

In vitro pulse chase experiment of FEPro labeled 231 BRL cells. (A) Changes in T2* signal intensities with serial dilution of proliferating SPIO labeled cells. (B) PB stained micrographs of a period of 4 weeks. Some cells retain SPIO nanoparticles until week 4. (C) Mean R2* values obtained from T2* map at each time point. (D) Iron content per cell of each time points. (E) R2* and iron content plot shows linear correlation between R2* value and iron content in the diluting 231 BRL cells (R2 = 0.976). (F) T2* histograms derived from T2* map of cell phantoms shows the shifting over time which concordant with the change of iron contents. (g) Box plot of T2* value shows the distribution of major voxels of each time point.
Figure 2.

Serial T2-weighted image (upper), T2* map images (middle), and MEPI T2*-weighted images at TE 20 from baseline to week 3 following IC injection of FEPro labeled 231BRL cells. Day 1 T2* map image shows T2* signal changes (red shifted) in the whole rat brain. T2*-weighted image also shows numerous hypointense voxels (arrowheads) on day 1 images. By week 1 T2* map still shows signal changes to lower T2* values whereas the T2*w image depicts relatively few hypointense voxels in gray or white matter. T2-weighted image at week 3 shows multiple metastases (arrowheads).
MRI of Brain Metastases
Figure 2 contains serial T2-weighted, calculated T2* map, and T2*-weighted (MEPI TE 20ms) MRIs from a representative Group 1 rat that received 106 FEPro labeled 231 BRL cells. T2*-weighted images show numerous hypointense voxels with a range of signal intensities at day 1 that became isointense over time. T2* map demonstrates an apparent decrease in T2* values at day 1 compared to baseline (red and yellow color in supplemental material 1, movie) with a shift to higher T2* values over time. Brain metastases were observed as multiple hyperintense regions on T2-weighted images by week 3 in all animals that received either labeled or unlabeled cells (Figure 2 and 3). Rats that received IC injection of TRAIL treated FEPro labeled 231BRL did not develop brain metastases. Minimal or no changes were observed on T2* maps or T2*-weighted images as compared to baseline MRIs in rats that were injected with unlabeled (Figure 3) or TRAIL treated 231BRL cells or saline (data not shown).
Figure 3.

T2-weighted image (upper), T2* map images (middle), and MEPI T2*-weighted images at TE 20 from baseline to week 3 after intracardiac injection of unlabeled 231BRL cells. No signal change is observed on MEPI images as compared to baseline. T2-weighted image on week 3 shows multiple metastatic lesions (arrowheads).
Quantitative analysis
Figure 4 contains mean normalized histograms of the distribution of T2* values from Group 1 (Figure 4A) and Group 2 (Figure 4B) rats obtained from images acquired at baseline and serially after injection of breast cancer cells. Rats that received FEPro labeled 231BRL cells had significantly lower (p<0.0083) T2* values from brain voxels from day 1 through week 3 on histogram plots and quartile analysis as compared to baseline measurements. In comparison, Group 2 rats did not exhibit changes in the mean T2* measures during the study evaluation period. Table 1 summarizes the mean T2* values at various time points for the histograms in Figure 4 from the four groups of rats. T2* histograms and quartile analysis from rats that received IC injection with FEPro labeled TRAIL treated cells or saline were unchanged compared to baseline values (supplemental material 2).
Figure 4.

Histogram and quartile analysis. (A) FEPro labeled 231BRL cell injected Group 1. (B) Unlabeled cancer cell injected Group 2. Only Group 1 rats demonstrated a left shift to lower T2* values following injection of FEPro labeled cells and significant change of the number of voxels during the follow up studies. For rats that received unlabeled cells there was no significant differences in the distribution of mean T2* values for the 3 weeks following IC injection of cells compared to baseline studies.
Table 1.
Calculated Mean T2* values (ms) from all Brain voxels
| Group and number of rats |
Baseline |
Days |
Weeks |
||||
|---|---|---|---|---|---|---|---|
| 1 | 2 | 3* | 1 | 2 | 3 | ||
| Group 1: FEPro Labeled (N=12) |
64.4 (1.61) |
54.8§ (1.57) |
57.6§ (0.47) |
60.3§ (1.98) |
61.9§ (1.23) |
61.8§ (0.73) |
62.4§ (0.91) |
| Group 2: Unlabeled (N=5) |
64.2 (0.99) |
- | - | 64.0 (0.71) | 63.9 (0.99) |
63.1 (0.59) |
63.4 (1.00) |
| Group 3: Saline (N=5) | 63.1 (0.86) |
- | - | 64.2 (0.42) | 63.6 (0.45) |
63.5 (2.29) |
62.1 (1.16) |
| Group 4: TRAIL (N= 4) | 63.5 (2.08) |
- | - | 63.4 (1.27) | 63.1 (0.34) |
- | - |
Note.—Number in parenthesis is standard deviation.
Day 3 for Group 2 and 3 rats were combined from day 1 because of limited number of animals scanned at the initial time point.
p<0.0083 significant difference for Days 1, 2, 3 in Group 1 rats that received FEPro labeled MB231 BRL cells compared to baseline or other groups of rats.
Histopathology
Figure 5 contains the brain sections from a representative Group 1 rat that was euthanized at week 3. Figure 5A is pre-mortem T2-weighted MRI and Figure 5B is corresponding hematoxylin and eosin stained section displaying multiple breast cancer metastases. Brain sections in Figure 5C through 5F were stained either PB for iron or by DAB enhanced IHC stains for CD68 to detect macrophages. A clear mismatch between PB positive cells and CD 68 positive cells can be detected in hippocampal (Figure 5C) and subcortical (Figure 5D-F) metastatic lesions. Scattered isolated breast cancer cells near brain metastases were shown to be cytokeratin and PB positive indicative of dormant or non-dividing labeled cells (Figure 6). There was no evidence of metastatic breast cancer in Group 3 and 4 rats.
Figure 5.

Mismatch on Prussian blue stain with macrophage detection. (A) T2-weighted MR image shows multiple metastatic foci as hyperintensity (arrowheads) (B) Whole brain section from a rat that was euthanized at week 3 shows numerous metastatic foci (open arrowheads). Hippocampal (C) and subcortical (D-F) metastatic lesions are magnified. (D) Magnified view of a subcortical metastatic lesion (arrowheads). PB stained breast cancer cells (upper, yellow arrowheads) and DAB stain corresponds anti CD68 for macrophage detection (lower, black arrowheads). (C, E-F) Mismatched staining between PB positive cell (upper, yellow arrowheads) and CD68 positive macrophage (lower, black arrowheads). Co-option of vessels by the breast cancer cells can also be appreciated.
Figure 6.
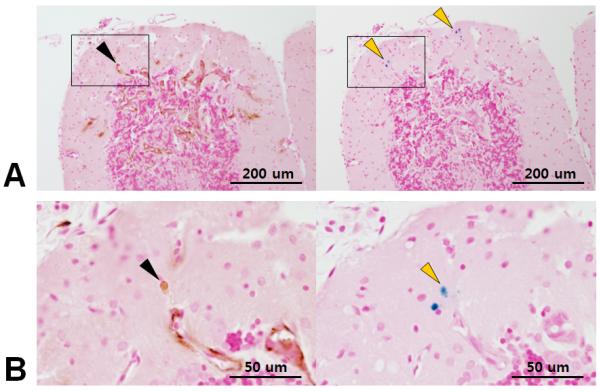
Cytokeratin positive breast cancer cell (left, black arrowhead) and corresponding Prussian blue positive cells (right, yellow arrowhead) in same location. These results suggest the possibility of dormant cancer cells at the periphery of the tumor.
DISCUSSION
The major finding of this study was the ability to use quantitative MRI to monitor the changes in T2* values with time in the rat brain following IC injection of FEPro labeled brain seeking human breast cancer cell line over time. One day following IC injection of FEPro labeled cells, multiple hypointense voxels were detected scattered throughout the rat brain as compared to animals receiving unlabeled or apoptotic cells. Ferumoxides is cleared from the circulation in the rat within the first 1.5 hours after infusion the SPIO and therefore FEPro complexes are not responsible for T2* changes observed in the rat brain (40). By week 1, the hypointense voxels on T2*-weighted images became isointense with the surrounding brain and qualitative discrimination of between the four groups of rats was no longer possible. In contrast, analysis of brain T2* values could discriminate between the four cohorts of animals as well as the serial dilution of FEPro or clearance of labeled 231BRL cells from the brain with time. Moreover, in vitro analysis of FEPro labeled cells that were allowed to proliferate demonstrated the shift from lower to higher T2* values with time. The in vitro phantom results with labeled cells was developed to approximately model the changes observed in the distribution of T2* values in the rat brain following administration of labeled cells. However, the in vitro clearance of iron from the breast cancer cells primarily accounts for serial dilution of the contrast agent and not a decrease in concentration due to loss by clearance mechanisms of labeled cells from the brain. The differences in normalized distribution of T2* values and quartile analysis of Group 1 rats indicates that 3 weeks post infusion of labeled cells would suggest the presence of either isolated dormant breast cancer cells or higher iron content in the rat brains containing metastases compared to animals that received unlabeled cells. Histological analysis of brain sections from Group 1 rats euthanized at 3 weeks revealed rare PB positive tumor cells in the gray matter and that were not localized in microglia or macrophages. Immunohistochemical staining of the isolated PB cells were shown to be positive for cytokeratin indicating that these were breast cancer cells.
MRI tracking of magnetically labeled cells has primarily focused on the ability to visualize single or clusters of cells as hypointense voxels on T2-weighted, T2*-weighted or balanced steady state images (16,18,41,42). Alternative approaches have also been developed to improve the conspicuity of magnetically labeled cells using off-resonance imaging sequences or post processing techniques to map the local susceptibility gradient from the echo shifting in k-space (41-46). Mowat et al has recently shown that the threshold to detect hypointense voxels from SPIO labeled cells was dependent on the intracellular iron and echo time used to acquire T2*-weighted images (47). There are other reports that suggest the inability to monitor over time magnetically labeled cells in vivo. Kraitchman et al infused MSCs labeled with Indium111 oxine and ferumoxides and reported focal and diffuse uptake of MSC in the area of the myocardial infarction by single photon emission tomography at day 7 post intravenous injection of cells (48). However, ferumoxides labeled MSCs that were not detected at 1.5 Tesla were observed on PB staining around the rim of the infarction. The authors concluded that MRI has lower sensitivity compared to detect dual labeled MSC compared to radionuclide approaches. Walczak et al labeled LacZ positive neural stem cells (NSC) with ferumoxides and monitored the dilution of the contrast agent over time following intraventricular injection in shi/shi neonate mice (23). NSCs proliferated and there was dilution of ferumoxides in cells to undetectable levels by two weeks. Fluorescent microscopy demonstrated LacZ positive NSCs distributed in the parenchyma that was not correlated to the hypointense region on T2*-weighted images. These authors stated that based on these results that MRI should only be applied for non-proliferating (i.e., progenitor or differentiated) cells or for the short term monitoring of cell undergoing rapid cell division. Quantitative MRI approaches were not used in these studies.
Quantitative MRI techniques have been used to detect invisible pathological processes in normal appearing white and gray matter that were not apparent using conventional techniques (49-51). Histogram plots of MR metrics are a global method of displaying quantitative data and therefore removing location biases associated with attempting to delineate the extent of invisible pathological process over time. T1, T2 or T2* maps have not been routinely used to monitor magnetically labeled cells in tissues. Granot et al used 1/T1 (R1) maps to demonstrate the migration of labeled tumor infiltrating fibroblasts into model of ovarian cancer in mice (52) by monitoring small incremental changes in R1 that corresponded to areas of labeled cells by confocal microscopy. Quantitative T2* imaging has also been used to demonstrate the early infiltration of SPIO labeled T-cells sensitized to the B16 OVA tumor antigen in an adoptive transfer flank tumor model (53).
In the current study, the alteration in T2* values on follow-up studies compared to baseline allowed for the determination of labeled cells within the rat brain over 3 weeks despite the breast cancer cell proliferation. The changes in the distribution of brain T2* values over time may represent the various stages of metastasis formation. Recently, it has been suggested that the formation of brain metastasis evolves over 4 steps including the initial cancer cell intravascular arrest, extravasation into the parenchyma, co-option of vessels and peri-vascular location of cells and angiogenic dependent growth (54). In addition, cancer cells may die in the vasculature, micro-metastases may regress or individual cells may become dormant within the parenchyma. The rapid changes in the distribution of brain T2* values immediately following (i.e., days 1-3) IC infusion of labeled cells would be consistent with the early clearance of breast cancer cells from the vasculature and the subsequent formation of metastases from cells that were able to marginate into the parenchyma. The lower T2* values 3 weeks following infusion of cell may represent the presence of dormant cancer cells in the brain (36) or low levels of iron in the metastases that are below the detection threshold by PB staining techniques.
There are several limitations in using MR quantitative maps (e.g., T1, T2, T2*) to monitor changes in pathology in the brain. As compared to conventional imaging approaches relaxation time maps usually require off-line image analysis and registration to anatomical images. In order to obtain reliable and reproducible T2* results more rigorous and stringent demands on the MRI scanner. Inaccuracies in the MR maps using the clinical scanner from induced eddy currents, gradient duty cycle and gradient direction, and gradient coil heating resulting in magnetic field drift, coil design, coil loading and location of sample in the coil can affect the image quality and reproducibility of quantitative measures (43). Another limitation of expressing the frequency distribution of T2* values in the brain as normalized histograms is the loss of spatial localization. However, it is possible to link through software the measured T2* values from the histogram to locations on the quantitative image maps (55) thereby providing the ability to identify regional changes over time. Song et al (38) has previously reported in this model that only 3-5% of all the diffuse hypointense regions visualized on early post infusion MRI develop into visible breast cancer metastasis therefore the early T2* changes can only be used to identify where labeled cells existed but not the conditions that are suitable for margination resulting in metastases.
In the current study, an analytical approach was used to determine the distribution of FEPro labeled breast cancer cells in the rat brain from T2* images at 3-Tesla. These results demonstrate the feasibility of using imaging and quantitative analysis approaches to track SPIO labeled cells following the intravenous injection to target tissues as part of cell therapy trials.
Supplementary Material
Acknowledgement
This research was supported by the Intramural Research Program in the Clinical Center at the National Institutes of Health. We would also like to acknowledge Philips Medical Systems as part of a cooperative research and development agreement for providing the radiofrequency coil.
Abbreviations used
- 231BRL
MDA-MB-231BR-Luc
- FDA
Food and Drug Administration
- FEPro
ferumoxides protamine sulfate complex
- IC
intracardiac
- MPIO
micron-sized superparamagnetic iron oxide
- SPIO
superparamagnetic iron oxide
- MEPI
multi-shot echo planar imaging
References
- 1.Arbab AS, Bashaw LA, Miller BR, Jordan EK, Bulte JW, Frank JA. Intracytoplasmic tagging of cells with ferumoxides and transfection agent for cellular magnetic resonance imaging after cell transplantation: methods and techniques. Transplantation. 2003;76(7):1123–1130. doi: 10.1097/01.TP.0000089237.39220.83. [DOI] [PubMed] [Google Scholar]
- 2.Arbab AS, Bashaw LA, Miller BR, Jordan EK, Lewis BK, Kalish H, Frank JA. Characterization of biophysical and metabolic properties of cells labeled with superparamagnetic iron oxide nanoparticles and transfection agent for cellular MR imaging. Radiology. 2003;229(3):838–846. doi: 10.1148/radiol.2293021215. [DOI] [PubMed] [Google Scholar]
- 3.Arbab AS, Yocum GT, Kalish H, Jordan EK, Anderson SA, Khakoo AY, Read EJ, Frank JA. Efficient magnetic cell labeling with protamine sulfate complexed to ferumoxides for cellular MRI. Blood. 2004;104(4):1217–1223. doi: 10.1182/blood-2004-02-0655. [DOI] [PubMed] [Google Scholar]
- 4.Bulte JW, Douglas T, Witwer B, Zhang SC, Strable E, Lewis BK, Zywicke H, Miller B, van Gelderen P, Moskowitz BM, Duncan ID, Frank JA. Magnetodendrimers allow endosomal magnetic labeling and in vivo tracking of stem cells. Nature biotechnology. 2001;19(12):1141–1147. doi: 10.1038/nbt1201-1141. [DOI] [PubMed] [Google Scholar]
- 5.Daldrup-Link HE, Rudelius M, Oostendorp RA, Settles M, Piontek G, Metz S, Rosenbrock H, Keller U, Heinzmann U, Rummeny EJ, Schlegel J, Link TM. Targeting of hematopoietic progenitor cells with MR contrast agents. Radiology. 2003;228(3):760–767. doi: 10.1148/radiol.2283020322. [DOI] [PubMed] [Google Scholar]
- 6.Frank JA, Anderson SA, Kalsih H, Jordan EK, Lewis BK, Yocum GT, Arbab AS. Methods for magnetically labeling stem and other cells for detection by in vivo magnetic resonance imaging. Cytotherapy. 2004;6(6):621–625. doi: 10.1080/14653240410005267-1. [DOI] [PubMed] [Google Scholar]
- 7.Frank JA, Miller BR, Arbab AS, Zywicke HA, Jordan EK, Lewis BK, Bryant LH, Jr., Bulte JW. Clinically applicable labeling of mammalian and stem cells by combining superparamagnetic iron oxides and transfection agents. Radiology. 2003;228(2):480–487. doi: 10.1148/radiol.2281020638. [DOI] [PubMed] [Google Scholar]
- 8.Frank JA, Zywicke H, Jordan EK, Mitchell J, Lewis BK, Miller B, Bryant LH, Jr., Bulte JW. Magnetic intracellular labeling of mammalian cells by combining (FDA-approved) superparamagnetic iron oxide MR contrast agents and commonly used transfection agents. Academic radiology. 2002;9(Suppl 2):S484–487. doi: 10.1016/s1076-6332(03)80271-4. [DOI] [PubMed] [Google Scholar]
- 9.Hoehn M, Kustermann E, Blunk J, Wiedermann D, Trapp T, Wecker S, Focking M, Arnold H, Hescheler J, Fleischmann BK, Schwindt W, Buhrle C. Monitoring of implanted stem cell migration in vivo: a highly resolved in vivo magnetic resonance imaging investigation of experimental stroke in rat. Proceedings of the National Academy of Sciences of the United States of America. 2002;99(25):16267–16272. doi: 10.1073/pnas.242435499. [DOI] [PMC free article] [PubMed] [Google Scholar]
- 10.Zhu J, Zhou L, XingWu F. Tracking neural stem cells in patients with brain trauma. N Engl J Med. 2006;355(22):2376–2378. doi: 10.1056/NEJMc055304. [DOI] [PubMed] [Google Scholar]
- 11.Anderson SA, Glod J, Arbab AS, Noel M, Ashari P, Fine HA, Frank JA. Noninvasive MR imaging of magnetically labeled stem cells to directly identify neovasculature in a glioma model. Blood. 2005;105(1):420–425. doi: 10.1182/blood-2004-06-2222. [DOI] [PubMed] [Google Scholar]
- 12.Anderson SA, Shukaliak-Quandt J, Jordan EK, Arbab AS, Martin R, McFarland H, Frank JA. Magnetic resonance imaging of labeled T-cells in a mouse model of multiple sclerosis. Ann Neurol. 2004;55(5):654–659. doi: 10.1002/ana.20066. [DOI] [PubMed] [Google Scholar]
- 13.Arbab AS, Liu W, Frank JA. Cellular magnetic resonance imaging: current status and future prospects. Expert review of medical devices. 2006;3(4):427–439. doi: 10.1586/17434440.3.4.427. [DOI] [PubMed] [Google Scholar]
- 14.de Vries IJ, Lesterhuis WJ, Barentsz JO, Verdijk P, van Krieken JH, Boerman OC, Oyen WJ, Bonenkamp JJ, Boezeman JB, Adema GJ, Bulte JW, Scheenen TW, Punt CJ, Heerschap A, Figdor CG. Magnetic resonance tracking of dendritic cells in melanoma patients for monitoring of cellular therapy. Nature biotechnology. 2005;23(11):1407–1413. doi: 10.1038/nbt1154. [DOI] [PubMed] [Google Scholar]
- 15.Bulte JW, Kraitchman DL. Iron oxide MR contrast agents for molecular and cellular imaging. NMR in biomedicine. 2004;17(7):484–499. doi: 10.1002/nbm.924. [DOI] [PubMed] [Google Scholar]
- 16.Heyn C, Ronald JA, Ramadan SS, Snir JA, Barry AM, MacKenzie LT, Mikulis DJ, Palmieri D, Bronder JL, Steeg PS, Yoneda T, MacDonald IC, Chambers AF, Rutt BK, Foster PJ. In vivo MRI of cancer cell fate at the single-cell level in a mouse model of breast cancer metastasis to the brain. Magn Reson Med. 2006;56(5):1001–1010. doi: 10.1002/mrm.21029. [DOI] [PubMed] [Google Scholar]
- 17.Arbab AS, Pandit SD, Anderson SA, Yocum GT, Bur M, Frenkel V, Khuu HM, Read EJ, Frank JA. Magnetic resonance imaging and confocal microscopy studies of magnetically labeled endothelial progenitor cells trafficking to sites of tumor angiogenesis. Stem cells (Dayton, Ohio) 2006;24(3):671–678. doi: 10.1634/stemcells.2005-0017. [DOI] [PubMed] [Google Scholar]
- 18.Modo M, Hoehn M, Bulte JW. Cellular MR imaging. Mol Imaging. 2005;4(3):143–164. doi: 10.1162/15353500200505145. [DOI] [PubMed] [Google Scholar]
- 19.Bulte JW, Zhang S, van Gelderen P, Herynek V, Jordan EK, Duncan ID, Frank JA. Neurotransplantation of magnetically labeled oligodendrocyte progenitors: magnetic resonance tracking of cell migration and myelination. Proceedings of the National Academy of Sciences of the United States of America. 1999;96(26):15256–15261. doi: 10.1073/pnas.96.26.15256. [DOI] [PMC free article] [PubMed] [Google Scholar]
- 20.Heyn C, Bowen CV, Rutt BK, Foster PJ. Detection threshold of single SPIO-labeled cells with FIESTA. Magn Reson Med. 2005;53(2):312–320. doi: 10.1002/mrm.20356. [DOI] [PubMed] [Google Scholar]
- 21.Shapiro EM, Skrtic S, Koretsky AP. Sizing it up: cellular MRI using micron-sized iron oxide particles. Magn Reson Med. 2005;53(2):329–338. doi: 10.1002/mrm.20342. [DOI] [PubMed] [Google Scholar]
- 22.Liu W, Dahnke H, Jordan EK, Schaeffter T, Frank JA. In vivo MRI using positive-contrast techniques in detection of cells labeled with superparamagnetic iron oxide nanoparticles. NMR in biomedicine. 2008;21(3):242–250. doi: 10.1002/nbm.1187. [DOI] [PubMed] [Google Scholar]
- 23.Walczak P, Kedziorek DA, Gilad AA, Barnett BP, Bulte JW. Applicability and limitations of MR tracking of neural stem cells with asymmetric cell division and rapid turnover: the case of the shiverer dysmyelinated mouse brain. Magn Reson Med. 2007;58(2):261–269. doi: 10.1002/mrm.21280. [DOI] [PubMed] [Google Scholar]
- 24.Pawelczyk E, Arbab AS, Pandit S, Hu E, Frank JA. Expression of transferrin receptor and ferritin following ferumoxides-protamine sulfate labeling of cells: implications for cellular magnetic resonance imaging. NMR in biomedicine. 2006;19(5):581–592. doi: 10.1002/nbm.1038. [DOI] [PubMed] [Google Scholar]
- 25.Rad AM, Arbab AS, Iskander AS, Jiang Q, Soltanian-Zadeh H. Quantification of superparamagnetic iron oxide (SPIO)-labeled cells using MRI. J Magn Reson Imaging. 2007;26(2):366–374. doi: 10.1002/jmri.20978. [DOI] [PMC free article] [PubMed] [Google Scholar]
- 26.Foster-Gareau P, Heyn C, Alejski A, Rutt BK. Imaging single mammalian cells with a 1.5 T clinical MRI scanner. Magn Reson Med. 2003;49(5):968–971. doi: 10.1002/mrm.10417. [DOI] [PubMed] [Google Scholar]
- 27.Heyn C, Ronald JA, Mackenzie LT, MacDonald IC, Chambers AF, Rutt BK, Foster PJ. In vivo magnetic resonance imaging of single cells in mouse brain with optical validation. Magn Reson Med. 2006;55(1):23–29. doi: 10.1002/mrm.20747. [DOI] [PubMed] [Google Scholar]
- 28.Sumner JP, Shapiro EM, Maric D, Conroy R, Koretsky AP. In vivo labeling of adult neural progenitors for MRI with micron sized particles of iron oxide: quantification of labeled cell phenotype. Neuroimage. 2009;44(3):671–678. doi: 10.1016/j.neuroimage.2008.07.050. [DOI] [PMC free article] [PubMed] [Google Scholar]
- 29.Shapiro EM, Sharer K, Skrtic S, Koretsky AP. In vivo detection of single cells by MRI. Magn Reson Med. 2006;55(2):242–249. doi: 10.1002/mrm.20718. [DOI] [PubMed] [Google Scholar]
- 30.Shapiro EM, Skrtic S, Sharer K, Hill JM, Dunbar CE, Koretsky AP. MRI detection of single particles for cellular imaging. Proceedings of the National Academy of Sciences of the United States of America. 2004;101(30):10901–10906. doi: 10.1073/pnas.0403918101. [DOI] [PMC free article] [PubMed] [Google Scholar]
- 31.Ye Q, Wu YL, Foley LM, Hitchens TK, Eytan DF, Shirwan H, Ho C. Longitudinal tracking of recipient macrophages in a rat chronic cardiac allograft rejection model with noninvasive magnetic resonance imaging using micrometer-sized paramagnetic iron oxide particles. Circulation. 2008;118(2):149–156. doi: 10.1161/CIRCULATIONAHA.107.746354. [DOI] [PMC free article] [PubMed] [Google Scholar]
- 32.Dodd SJ, Williams M, Suhan JP, Williams DS, Koretsky AP, Ho C. Detection of single mammalian cells by high-resolution magnetic resonance imaging. Biophysical journal. 1999;76(1 Pt 1):103–109. doi: 10.1016/S0006-3495(99)77182-1. [DOI] [PMC free article] [PubMed] [Google Scholar]
- 33.Lewin M, Carlesso N, Tung CH, Tang XW, Cory D, Scadden DT, Weissleder R. Tat peptide-derivatized magnetic nanoparticles allow in vivo tracking and recovery of progenitor cells. Nature biotechnology. 2000;18(4):410–414. doi: 10.1038/74464. [DOI] [PubMed] [Google Scholar]
- 34.Dahnke H, Schaeffter T. Limits of detection of SPIO at 3.0 T using T2 relaxometry. Magn Reson Med. 2005;53(5):1202–1206. doi: 10.1002/mrm.20435. [DOI] [PubMed] [Google Scholar]
- 35.Verdijk P, Scheenen TW, Lesterhuis WJ, Gambarota G, Veltien AA, Walczak P, Scharenborg NM, Bulte JW, Punt CJ, Heerschap A, Figdor CG, de Vries IJ. Sensitivity of magnetic resonance imaging of dendritic cells for in vivo tracking of cellular cancer vaccines. Int J Cancer. 2007;120(5):978–984. doi: 10.1002/ijc.22385. [DOI] [PubMed] [Google Scholar]
- 36.Kircher MF, Allport JR, Graves EE, Love V, Josephson L, Lichtman AH, Weissleder R. In vivo high resolution three-dimensional imaging of antigen-specific cytotoxic T-lymphocyte trafficking to tumors. Cancer research. 2003;63(20):6838–6846. [PubMed] [Google Scholar]
- 37.Yoneda T, Williams PJ, Hiraga T, Niewolna M, Nishimura R. A bone-seeking clone exhibits different biological properties from the MDA-MB-231 parental human breast cancer cells and a brain-seeking clone in vivo and in vitro. J Bone Miner Res. 2001;16(8):1486–1495. doi: 10.1359/jbmr.2001.16.8.1486. [DOI] [PubMed] [Google Scholar]
- 38.Song HT, Jordan EK, Lewis BK, Liu W, Ganjei J, Klaunberg B, Despres D, Palmieri D, Frank JA. Rat model of metastatic breast cancer monitored by MRI at 3 tesla and bioluminescence imaging with histological correlation. J Transl Med. 2009;7:88. doi: 10.1186/1479-5876-7-88. [DOI] [PMC free article] [PubMed] [Google Scholar]
- 39.Tukey JW. Some selected quick and easy methods of statistical analysis. Transactions of the New York Academy of Sciences. 1953;16(2):88–97. doi: 10.1111/j.2164-0947.1953.tb01326.x. [DOI] [PubMed] [Google Scholar]
- 40.Majumdar S, Zoghbi SS, Gore JC. Pharmacokinetics of superparamagnetic iron-oxide MR contrast agents in the rat. Invest Radiol. 1990;25(7):771–777. doi: 10.1097/00004424-199007000-00004. [DOI] [PubMed] [Google Scholar]
- 41.Mani V, Briley-Saebo KC, Itskovich VV, Samber DD, Fayad ZA. Gradient echo acquisition for superparamagnetic particles with positive contrast (GRASP): sequence characterization in membrane and glass superparamagnetic iron oxide phantoms at 1.5T and 3T. Magn Reson Med. 2006;55(1):126–135. doi: 10.1002/mrm.20739. [DOI] [PubMed] [Google Scholar]
- 42.Seppenwoolde JH, Viergever MA, Bakker CJ. Passive tracking exploiting local signal conservation: the white marker phenomenon. Magn Reson Med. 2003;50(4):784–790. doi: 10.1002/mrm.10574. [DOI] [PubMed] [Google Scholar]
- 43.Liu W, Frank JA. Detection and quantification of magnetically labeled cells by cellular MRI. Eur J Radiol. 2009;70(2):258–264. doi: 10.1016/j.ejrad.2008.09.021. [DOI] [PMC free article] [PubMed] [Google Scholar]
- 44.Stuber M, Gilson WD, Schar M, Kedziorek DA, Hofmann LV, Shah S, Vonken EJ, Bulte JW, Kraitchman DL. Positive contrast visualization of iron oxide-labeled stem cells using inversion-recovery with ON-resonant water suppression (IRON) Magn Reson Med. 2007;58(5):1072–1077. doi: 10.1002/mrm.21399. [DOI] [PubMed] [Google Scholar]
- 45.Zurkiya O, Hu X. Off-resonance saturation as a means of generating contrast with superparamagnetic nanoparticles. Magn Reson Med. 2006;56(4):726–732. doi: 10.1002/mrm.21024. [DOI] [PubMed] [Google Scholar]
- 46.Farrar CT, Dai G, Novikov M, Rosenzweig A, Weissleder R, Rosen BR, Sosnovik DE. Impact of field strength and iron oxide nanoparticle concentration on the linearity and diagnostic accuracy of off-resonance imaging. NMR in biomedicine. 2008;21(5):453–463. doi: 10.1002/nbm.1209. [DOI] [PMC free article] [PubMed] [Google Scholar]
- 47.Mowat P, Franconi F, Chapon C, Lemaire L, Dorat J, Hindre F, Benoit JP, Richomme P, Le Jeune JJ. Evaluating SPIO-labelled cell MR efficiency by three-dimensional quantitative T2* MRI. NMR in biomedicine. 2007;20(1):21–27. doi: 10.1002/nbm.1084. [DOI] [PubMed] [Google Scholar]
- 48.Kraitchman DL, Tatsumi M, Gilson WD, Ishimori T, Kedziorek D, Walczak P, Segars WP, Chen HH, Fritzges D, Izbudak I, Young RG, Marcelino M, Pittenger MF, Solaiyappan M, Boston RC, Tsui BM, Wahl RL, Bulte JW. Dynamic imaging of allogeneic mesenchymal stem cells trafficking to myocardial infarction. Circulation. 2005;112(10):1451–1461. doi: 10.1161/CIRCULATIONAHA.105.537480. [DOI] [PMC free article] [PubMed] [Google Scholar]
- 49.Vrenken H, Pouwels PJ, Ropele S, Knol DL, Geurts JJ, Polman CH, Barkhof F, Castelijns JA. Magnetization transfer ratio measurement in multiple sclerosis normal-appearing brain tissue: limited differences with controls but relationships with clinical and MR measures of disease. Mult Scler. 2007;13(6):708–716. doi: 10.1177/1352458506075521. [DOI] [PubMed] [Google Scholar]
- 50.Ostuni JL, Richert ND, Lewis BK, Frank JA. Characterization of differences between multiple sclerosis and normal brain: a global magnetization transfer application. AJNR Am J Neuroradiol. 1999;20(3):501–507. [PMC free article] [PubMed] [Google Scholar]
- 51.Pagani E, Bammer R, Horsfield MA, Rovaris M, Gass A, Ciccarelli O, Filippi M. Diffusion MR imaging in multiple sclerosis: technical aspects and challenges. AJNR Am J Neuroradiol. 2007;28(3):411–420. [PMC free article] [PubMed] [Google Scholar]
- 52.Granot D, Addadi Y, Kalchenko V, Harmelin A, Kunz-Schughart LA, Neeman M. In vivo imaging of the systemic recruitment of fibroblasts to the angiogenic rim of ovarian carcinoma tumors. Cancer research. 2007;67(19):9180–9189. doi: 10.1158/0008-5472.CAN-07-0684. [DOI] [PMC free article] [PubMed] [Google Scholar]
- 53.Kircher MF, Mahmood U, King RS, Weissleder R, Josephson L. A multimodal nanoparticle for preoperative magnetic resonance imaging and intraoperative optical brain tumor delineation. Cancer research. 2003;63(23):8122–8125. [PubMed] [Google Scholar]
- 54.Kienast Y, von Baumgarten L, Fuhrmann M, Klinkert WE, Goldbrunner R, Herms J, Winkler F. Real-time imaging reveals the single steps of brain metastasis formation. Nature medicine. 2010;16(1):116–122. doi: 10.1038/nm.2072. [DOI] [PubMed] [Google Scholar]
- 55. www.medx.com.
Associated Data
This section collects any data citations, data availability statements, or supplementary materials included in this article.