

Abstract
Previous studies suggest consumption of red pepper (RP) promotes negative energy balance. However, the RP dose provided in these studies (up to 10 g/meal) usually exceeded the amount preferred by the general population in the United States (mean = ~ 1 g/meal). The objective of this study was to evaluate the effects of hedonically acceptable RP doses served at a single meal in healthy, lean individuals on thermogenesis and appetite. Twenty-five men and women (aged 23.0 ± 0.5 y, BMI 22.6 ± 0.3 kg/m2, 13 spicy food users and 12 non-users) participated in a randomized crossover trial during which they consumed a standardized quantity (1 g); their preferred quantity (regular spicy foods users 1.8 ± 0.3 g/meal, non-users 0.3 ± 0.1 g/meal); or no RP. Energy expenditure, core body and skin temperature, and appetite were measured. Postprandial energy expenditure and core body temperature were greater, and skin temperature was lower, after test loads with 1 g RP than no RP. Respiratory quotient was lower after the preferred RP dose was ingested orally, compared to in capsule form. These findings suggest that RP’s effects on energy balance stem from a combination of metabolic and sensory inputs, and that oral exposure is necessary to achieve RP’s maximum benefits. Energy intake was lower after test loads with 1 g RP than no RP in non-users, but not in users. Preoccupation with food, and the desire to consume fatty, salty, and sweet foods were decreased more (or tended to be decreased more) in non-users than users after a 1 g RP test load, but did not vary after a test load with no RP. This suggests that individuals may become desensitized to the effects of RP with long-term spicy food intake.
Keywords: capsaicin, oral irritation, energy expenditure, energy intake, temperature, palatability
1. Introduction
Obesity is one of the most pressing national public health problems [1]. There are a variety of strategies available for individuals attempting to reduce body weight [2]. Foods that evoke multiple actions should theoretically hold greater benefit. This can be complimented through modification of foods with various spices and seasonings. Previous studies have reported that capsaicin, the pungent principle in hot red peppers (RP), reduces hunger, stimulates thermogenesis, and alters substrate oxidation in humans [3–8]. However, there have been conflicting reports on these outcomes, including a recent study noting no effects on satiety or thermogenesis [9]. An improved understanding of the basis of these inconsistencies is required to establish the role of dietary oral irritants, such as capsaicin, in weight management.
One methodological issue that may account for much of the inconsistent data on RP concerns the characteristics of study populations. RP test loads in previous studies have been widely divergent, ranging from ~ 1 g [4, 5, 9] to 10 g [6–8, 10]. These doses mirror wide variances in RP consumption. High concentrations are a hallmark of Asian and Latin American cuisines (e.g., average daily consumption among Koreans = ~ 7 g) [11], while RP is a more variable component of diets in the United States (e.g., daily consumption of peppers of any kind = 10.5% [12] and mean preference in our study population = ~ 1 g/meal). It is well established that there are individual differences in the sensitivity to the burn of spicy foods and to the affective interpretation of that sensation (e.g., regular spicy food users rate capsaicin’s burn as less intense and more pleasant than non-users) [13–17]. This may be attributable to familiarity effects as repeated exposure to high capsaicin concentrations, during a 16-day period, lowers burn intensity ratings [15]. Further, hedonic effects have been documented with controlled feeding trials that entail chronic adherence to low [18] or high [19] sodium and low-fat diets [20]. Similarly, in a Mexican highland village where chili pepper is a predominant spice, repeated experience with gradually increasing levels of spiciness enhanced preference and tolerance for spicy foods as documented through interviews, direct observations, and sensory measurements [21]. Another possibility is that the variable palatability of spicy foods is related to consequences of physiological processes, independent of sensory responsiveness. One possibility involves cephalic phase responses which are generally stronger for more palatable sensory stimuli. Cephalic phase responses, including release of satiety hormones [22] and catecholamines that stimulate thermogenesis [23, 24], could provide positive metabolic feedback. Although a cephalic phase insulin response to oral irritation has not been explored, exposure to spicy foods leads to increased insulin sensitivity in regular spicy food users versus those with less frequent exposure [25]. Thus, it is vital that the acceptability of RP and frequency of exposure be controlled in studies of the satiety and thermogenic responses to RP. The present study was designed to document potential variances in thermogenic and appetitive responses to RP between regular spicy food users and non-users. If differential responses are demonstrated, further study will be warranted to document the potential mechanisms (e.g., cephalic phase responses). The hypothesis of the current study was that RP would lead to greater increases in thermogenesis and moderation of orexigenic appetitive sensations than no RP, and that these changes would be more pronounced among non-users than users.
Capsaicin has been documented to increase thermogenesis through stimulation of catecholamine secretion and subsequent sympathetic nervous system (SNS) activation. However, the effects are variable in magnitude and duration [3, 5, 7, 17]. SNS stimulation preferentially increases fat oxidation [26], which is consistent with studies reporting that RP enhances fat oxidation [8, 27]. However, some studies report that RP augments carbohydrate oxidation [6, 10] or has no effect on substrate oxidation [9]. A possible explanation for these seemingly contradictory observations is that RP increases the oxidation of available substrate regardless of its nature. To determine if RP exerts substrate-specific effects, the present study used macronutrient-controlled lead-in diets, administered in random order, prior to assessments. It was posited that RP would enhance postprandial energy expenditure, irrespective of lead-in diet, and that fat oxidation would be increased on high fat (HF) diets and carbohydrate oxidation would be increased on high carbohydrate (HC) diets.
An additional question concerns the role played by sensory stimulation in the thermogenic and appetitive responses to capsaicin. The capsaicin receptor, transient receptor potential vanilloid 1 (TRPV1), has unique physiological functions in allowing humans to detect to the oral burn associated with chili pepper consumption, regulate core body temperature, and sense external temperature (≥ 42° C) [28]. Mixed findings have been reported concerning the necessity of sensory stimulation. One previous study indicated that thermogenesis and appetitive control were greater when RP was ingested orally, compared to in capsule form [4]. These stronger effects with oral exposure were believed to indicate a sensory effect of RP, given that consumption in capsule form bypasses oral irritation [4]. However, another study showed no added effect with oral stimulation [5]. A possible explanation is that maximum effects may be achieved when stimulus concentrations match individual preferences. Again, this may be attributable to activation of cephalic phase responses [22]. The present trial measured the thermogenic and appetitive responses of regular users and non-users of spicy foods to determined preferred capsaicin concentrations in a food system delivered orally or in capsule form. It was hypothesized that RP would lead to greater increases in thermogenesis and moderation of appetitive sensations when delivered orally rather than gastrically.
2. Methods
2.1. Subjects
Eligibility criteria included: 1) age 18 to 65 years; 2) body mass index (BMI) 18.5 to 27 kg/m2; 3) weight stable within five kg in the past six months; 4) constant habitual diet and activity patterns in the past three months; 5) willingness to eat all test foods; 6) no allergies to foods provided in the study; 7) good health; 8) not taking medications known to influence appetite or metabolism; and 9) non-smoker for one year or more. Approximately equal numbers of regular spicy food users and non-users were desired. Additionally, about half 6-n-propylthiouracil (PROP) tasters and non-tasters were desired in each user group, since sensitivity to the bitter compound PROP is genetically-determined and believed to influence flavor preferences [29].
One hundred sixty-eight individuals, median age 22 years (range 18–51), completed a laboratory screening visit. The age of the sample is reflective of the high student population and relative inflexibility of staff work schedules on the university campus on which recruitment occurred. Exclusions occurred due to: BMI outside specified range (13), unwillingness to consume all test foods (5) or swallow temperature sensor capsule (1), scheduling constraints (5), and user status and/or PROP taster classification fully recruited (109).
Thirty-five subjects were enrolled in the study. Prior to beginning test visits, three subjects dropped out due to scheduling constraints. Thirty-two subjects began the study. Five subjects dropped out during the study due to: intolerance of RP (i.e., vomiting: 1 after 2 visits), unwillingness to abstain from caffeine (1 after 1 visit), and scheduling constraints (2 after 1 visit, 1 after 3 visits). Two subjects were terminated during the study due to non-compliance due to: consuming outside foods during test visit (1 after 1 visit) and refusal to consume test meal (1 after 3 visits). Twenty-five healthy men and women completed the study. Their characteristics are shown in Table 1.
Table 1.
Subject characteristics.
| Spice Users (n = 13) | Spice Non-Users (n = 12) | |
|---|---|---|
| Age (years) | 23.2 ± 0.8 | 22.8 ± 0.5 |
| Sex (male/female) | 10/3 | 4/8 |
| Race (Asian/Black/Caucasian) | 6/0/7 | 1/1/10 |
| PROP (taster/non-taster) | 7/6 | 6/6 |
| Body mass index (BMI, kg/m2)* | 22.9 ± 0.6 | 22.3 ± 0.4 |
| Body fat (%) | 19.4 ± 2.4 | 23.4 ± 2.1 |
Mean ± SE
BMI (range 19.1–26.2; 1 user, 0 non-users = BMI > 25)
The study was approved by the Biomedical Institutional Review Board at Purdue University. All subjects provided written informed consent and received monetary compensation for participation.
2.2. General protocol
Testing was conducted through a randomized cross-over design. Potential subjects responded to public advertisements posted on campus and completed questionnaires regarding their spicy food consumption, as well as their weight, diet, physical activity, and medical histories. Those meeting preset criteria were scheduled for a screening visit where height, weight, body composition, PROP taster status [30], and physical activity level [31] were assessed. Study foods were also rated for acceptability. If preset criteria were met, the subject was scheduled to complete six study visits in random order. Visits were separated by at least one week. For the three days prior to testing visits subjects adhered to a high fat (HF) diet (2 visits), high carbohydrate (HC) diet (2 visits), or their customary (i.e., habitual) diet (2 visits). They repeated these food records, consuming the same foods and liquids at comparable times, for the three days before their second HF, HC, or customary diet visit. Additionally, they were instructed to abstain from drinking alcohol for three days before test visits, avoid strenuous physical activity for two days before study visits, avoid caffeinated beverages for one day before study visits, and refrain from exposure to any oral health products or beverages for two hours prior to arrival at the laboratory. Subjects arrived in the laboratory approximately one hour before their typical lunch time, following a minimum 12-hour overnight fast (regular spicy foods users 14.7 ± 0.3 hours, non-users 14.4 ± 0.3 hours). Subjects rested for 20 minutes and underwent baseline measurements for the next 45 minutes including: resting energy expenditure (REE), core body and skin temperature, and appetite. A test meal was consumed at the subjects’ typical lunch time, 65 minutes after reporting to the laboratory. Test meals following HF and HC diets included a standardized quantity of cayenne red pepper (RP) (RP: 1995 ug/g capsaicin, 247 ug/g nordihydrocapsaicin, and 1350 ug/g dihydrocapsaicin equivalent to 53,800 Scoville Heat Units (McCormick Science Institute, Hunt Valley MD)) or no RP. Test meals following customary diets included the subjects’ preferred quantity of RP in oral or capsule form. RP was compounded in hard gelatin shells (Hawkins Pharmaceutical Group, Minneapolis MN) with a dissolving time of 15 minutes. Postprandial energy expenditure (PPEE), core body and skin temperature, and appetite were measured at stipulated times for the next 4.5 hours. Finally, an ad libitum homogenous challenge meal was served to quantify differences in satiety following consumption of the test meals. The test visit timeline is shown in Figure 1.
Figure 1.
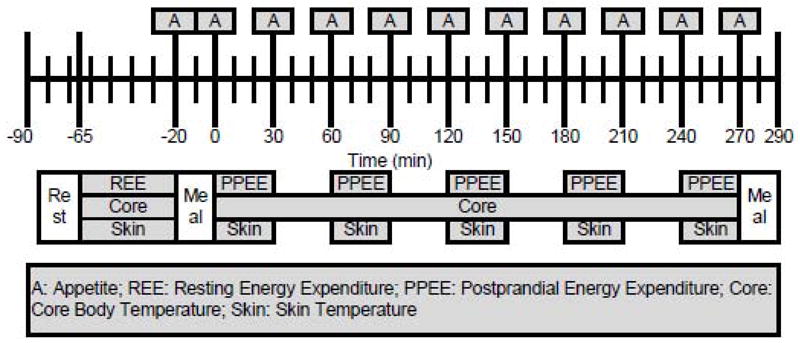
Test visit timeline.
2.3. Dietary intake
Subjects recorded all food and liquid intake over the three days prior to test sessions. They were given a guide on portion size and instructed to use a calorie, carbohydrate, and fat counter [32]. At study visits, the food records were reviewed by a registered dietitian and discrepancies/questions were addressed.
Basal metabolic rate (BMR) estimated by bioelectrical impedance (BIA) using validated equations [33] and multiplied by an activity factor [31], which was estimated from each subject’s self-reported usual physical activity level at work and leisure to derive an estimate of energy needs. During the HC and HF lead-in phases, subjects were provided 500 kcal of HC or HF foods. In addition, subjects were instructed to consume ≥ 65% and ≥ 45% kcal from carbohydrate and fat, respectively, for the remainder of the lead-in period.
The test meal was served after baseline measurements, at the subject’s typical lunch time (Figure 1). Test meals following HF and HC diets included a standardized quantity (1 g) of RP or no RP on randomized days. Depending on the subject’s preference, which was determined during the screening visit, 0.1 to 1 g RP was consumed orally with the remaining RP in capsule form. For no RP test visits, an equivalent number of placebo capsules were served. Test meals following customary diets included the subject’s preferred quantity of RP in oral or capsule form (1.8 ± 0.3 g in users, 0.3 ± 0.1 g in non-users). The preferred quantity was determined at screening. Subjects sampled tomato soup with ascending RP concentrations (0, 0.5, 1, 1.5, 2, 2.5, and 3 g per 290 g serving). Then, a full serving of tomato soup containing 0.5 g below the concentration rated most palatable was provided. Subjects were given 1 g of RP and asked to slowly season the tomato soup to their preferred palatability level. Subjects were instructed to consume all of the food and drink items served. Palatability data were collected using a computerized data collection system (Compusense® five, version 4.6, Compusense Inc., Guelph ON, Canada). An ad libitum challenge meal was served 4.5 hours after the test meal. Subjects were instructed to eat until they were comfortably full. All foods and drinks were weighed before and after to determine intake in grams. Energy and macronutrient intakes were calculated from food labels and using the Nutrition Data System for Research (NDSR 2008, University of Minnesota, Nutrition Coordinating Center, Minneapolis MN). Nutrient composition and weight of the lead-in diets (raw data, not adjusted for underreporting), test lunch, and challenge dinner is shown in Table 2. Provided foods during HF and HC lead-ins, as well as the test lunch, were the same for all participants and not adjusted for BMI. A complete list of foods provided during the high carbohydrate and high fat lead-in days, as well as test day meals, is given in Table 3.
Table 2.
Nutrient composition of lead-in diets, test lunch, and challenge dinner.
| HF Lead-In | HF Lead-In Provided Foods | HC Lead-In | HC Lead-In Provided Foods | Customary Lead-In | Test Meal | Challenge Meal | |
|---|---|---|---|---|---|---|---|
| Energy (kcal) | 2884 ± 61 | 500 | 2844 ± 60 | 500 | 2374 ± 59 | 500 | 671 ± 20 |
| Weight (g) | 2524 ± 88 | 522 | 3075 ± 103 | 498 | 2484 ± 90 | 560 | 163 ± 3 |
| Fat (%) | 45.3 ± 0.5 | 55.8 | 23.1 ± 0.4 | 18.4 | 32.0 ± 0.7 | 34.9 | 15.6 |
| Carbohydrate (%) | 39.1 ± 0.6 | 24.8 | 62.4 ± 0.4 | 62.2 | 51.8 ± 0.8 | 50.2 | 72.8 |
| Protein (%) | 15.5 ± 0.3 | 19.4 | 14.5 ± 0.3 | 19.4 | 16.2 ± 0.5 | 14.9 | 11.6 |
| Sodium (mg) | 4429 ± 143 | 315 | 3960 ± 143 | 430 | 4099 ± 130 | 1027 | 1468 ± 25 |
Mean ± SE
Table 3.
Foods provided during lead-in and test days.
|
High Fat Lead-In Provided Foods |
| Planters Go-Nuts NUTrition Heart Healthy Mix (1.5 oz/day) |
| Horizon Organic Reduced Fat Milk, Plain (2 × 8 oz cartons/day) |
|
High Carbohydrate Lead-In Provided Foods |
| Capri Sun Fruit Dive (2 × 200 ml pouches/day) |
| Odwalla Super Protein Bar (1 bar/day) |
| Kraft Twist-Um and String-Ums – Mozzarella and Cheddar Super Long String Cheese (1 piece/day) |
|
Test Meal |
| Campbells Condensed Tomato Soup (150 g/meal) |
| Lactaid Whole Milk (125 g/meal) |
| Lactaid 2% Milk (240 g/meal) |
| Market Pantry Heavy Cream (15 g/meal) |
| McCormick Ground (Cayenne) Red Pepper (0–3.5 g/meal) |
| Pepperidge Farm Cheddar Goldfish Crackers (26.5–30 g/meal) |
|
Challenge Meal |
| Kraft Easy Mac Big Packs (ad libitum) |
| Deionized water (ad libitum) |
2.4. Body composition
Height was measured to the nearest 0.1 cm using a wall-mounted stadiometer while subjects were shoeless. Weight (in gown) was measured to the nearest 0.1 kg and body composition was assessed via bioelectrical impedance (Body Fat Analyzer Scale, Model TBF-410, Tanita Corporation of America, Inc., Arlington Heights IL). Percentage of body fat and fat-free mass were estimated using air displacement plethysmography (Bod Pod, Life Measurement, Inc., Concord CA), at each subject’s first test visit, after an overnight fast [34].
2.5. Energy expenditure
Indirect calorimetry was used to measure energy expenditure (MedGraphics Cardiopulmonary Diagnostics Systems; MedGraphics Corporation, St. Paul MN; TrueMax 2400, ParvoMedics, Sandy UT). After an overnight fast, subjects rested in a recumbent position for 20 minutes. REE was measured for the 45 minutes before consumption of the test meal, using a ventilated hood system. Following the test meal, PPEE was periodically measured for five 30-minute time intervals (Figure 1). Room temperature was maintained at 24 ± 3°C. Energy expenditure and respiratory quotient were estimated from measures of oxygen consumption and carbon dioxide production, based on the modified Weir equation [35].
2.6. Temperature
Core body temperature was monitored using a CorTemp Ingestive Core Body Temperature Sensor and a CorTemp Data Recorder (HQ, Inc, Palmetto FL). Subjects ingested a sensor capsule 12 hours before each test, allowing adequate time for intestinal motility and minimizing the effects of consumed foods on temperature readings [36]. Skin temperature was monitored at the neck using a thermistor thermometer (YSI 4600 Precision Thermometer with YSI 400 Series Probe, YSI, Inc., Dayton OH). Core temperature was measured continuously, with skin temperature measured 45-minutes before test meal consumption and at stipulated times for five 30-minute intervals (Figure 1).
2.7. Appetite
Appetite was measured before consumption of the test meal and at 30-minute intervals after consumption of the test meal (Figure 1). Standard, validated [37–39] appetite questions were administered. Questionnaires assessed various appetitive sensations, such as: hunger, fullness, and desire to eat. Questionnaires were loaded onto a handheld personal digital assistant (PalmZire21, Palm, Inc., Sunnyvale CA). Visual analog scales (VAS) end-anchored with opposing statements, 0 = not at all and 100 = extremely, were used to assess each sensation. Ratings were recorded as the percent difference from the left endpoint of the VAS to the mark made by the subject.
2.8. Statistical analysis
Data are reported as mean ± standard error of the mean (SEM) unless stated otherwise, and were analyzed using the Statistical Program for the Social Sciences (SPSS), version 17.0 for Windows (SPSS Inc., Chicago IL). Significance was defined as p<0.05. The Bonferroni adjustment was applied for multiple comparisons. For test visits following HC and HF diet lead-ins, a three-way repeated measures analysis of variance (ANOVA) was conducted to determine the effects of treatment (RP or no RP), diet (HF or HC), time, and their interactions on energy expenditure, temperature, appetite, and energy intake. For test visits following customary diet lead-ins, a two-way repeated measures ANOVA was performed to determine the effects of treatment (oral or capsule), time, and their interactions. User status was a between-subjects factor. When the ANOVA revealed a significant effect, an additional repeated measures ANOVA was performed at each time point and for area under the curve (AUC).
3. Results
3.1. Thermogenic properties
3.1.1. Energy expenditure
Energy expenditure was greater (F(1,23)=6.944, p=0.015) after consumption of test loads with 1 g red pepper (RP), compared to no RP, specifically at 60–90, 120–150, and 240–270 min after test load consumption (Figure 2). This was also documented by comparison of the area under the curve (AUC) values for postprandial energy expenditure (PPEE) (F(1,24)=7.163, p=0.013), reflecting a mean increase of about 10 kcal over 270 minutes. PPEE did not vary significantly by user status after test loads with 1 g RP or no RP. However, when the preferred RP dose was consumed, PPEE tended (F(4,92)=2.444, p=0.052) to be greatest when consumed by non-users orally, intermediate when consumed by non-users in capsule form, and lowest in users when consumed in either form. PPEE did not vary significantly by HF vs. HC lead-in diet.
Figure 2.

Mean (± SEM) changes in energy expenditure measured over the 270 min after test loads (n=25) were greater with 1 g RP than no RP (p<0.05). *p<0.05, **p<0.01
3.1.2. Respiratory quotient (RQ)
RQ tended (F(1,23)=3.466, p=0.075) to be lower with 1 g RP than no RP in non-users, but did not vary significantly in users. The change of RQ following oral RP exposure was lower (F(1,23)=5.228, p=0.031) after high fat (HF) lead-in diets in non-users, but did not vary significantly in users. No user status effects were noted with the high carbohydrate (HC) lead-in diet. Figure 3 shows the RQ after consumption of test loads with the preferred RP dose. RQ was lower (F(1,23)=4.589, p=0.043) when the preferred RP dose was consumed orally, compared to in capsule form, specifically at later time points (i.e., 180–210 and 240–270 min after test load consumption).
Figure 3.

Mean (± SEM) respiratory quotient (RQ) measured over the 270 min after test loads (n=25) was lower when RP was consumed orally, compared to in capsule form (p<0.05). *p<0.05
3.1.3. Temperature
Core body temperature was increased (F(8,184)=2.295, p=0.023) after test loads with 1 g RP, compared to no RP (mean increase = 0.02°C (0.05°F) over 270 min) (Figure 4). Core body temperature was not was affected by user status, oral vs. capsule form, or HF vs. HC lead-in diets.
Figure 4.

Mean (± SEM) core body temperature measured over the 270 min after test loads (n=25) was greater with 1 g RP than no RP (p<0.05).
Skin temperature was lower (F(4,92)=2.610, p=0.041) after test loads with 1 g RP, compared to no RP (mean decrease = 0.11°C (0.19°F) and 0.23°C (0.31°F) over 270 min after HF and HC lead-in diets, respectively). Additionally, skin temperature was lower (F(4,92)=2.913, p=0.026) when RP was consumed in capsule form, compared to orally (mean decrease = 0.39°C (0.60°F) and 0.27°C (0.48°F) over 270 min in users and non-users, respectively), specifically at 180–210 min.
3.2. Appetitive effects
3.2.1. 1 gram dose
Figure 5 shows the AUC for change in preoccupation with food and desire to eat fatty, salty, and sweet foods in the 270 min after consumption of test loads with 1 g RP or no RP. Preoccupation with food tended (F(9,207)=1.784, p=0.073) to be decreased more in non-users than users in the 270 min after 1 g RP test loads, specifically at 270 min, but did not vary significantly after test loads with no RP. This trend was also documented by comparison of the AUC values for preoccupation with food (F(1,23)=3.211, p=0.086).
Figure 5.

AUC (± SEM) change in appetite ratings for preoccupation with food and desire to eat fatty, salty, and sweet foods measured over the 270 min after test loads (n=25) was decreased more (or tended to be decreased more) in non-users than users after test loads with 1 g RP (a), but did not vary significantly after test loads with no RP (b) (p = 0.097, p<0.01, p<0.01, and p = 0.061, respectively).
Desire to eat fatty foods was decreased more (F(1,23)=8.572, p=0.008) in non-users than users in the 270 min after 1 g RP test loads, specifically at 30, 90, 120, 150, 180, 210, 240, and 270 min, but did not vary significantly after test loads with no RP. This was also documented by comparison of the AUC values for desire to eat fatty foods (F(1,23)=8.765, p=0.007).
Desire to eat salty foods was decreased more (F(1,23)=9.922, p=0.004) in non-users than users in the 270 min after 1 g RP test loads, specifically at 60, 90, 120, 150, 180, 210, 240, and 270 min, but did not vary significantly after test loads with no RP. This was also documented by comparison of the AUC values for desire to eat salty foods (F(1,23)=9.784, p=0.005).
Desire to eat sweet foods tended (F(1,23)=3.777, p=0.064) to be decreased more in non-users than users in the 270 min after 1 g RP test loads, specifically at 60 and 120 min, but did not vary significantly after test loads with no RP. This trend was also documented by comparison of the AUC values for desire to eat sweet foods (F(1,23)=3.302, p=0.082).
Hunger was decreased more (F(9,207)=2.299, p=0.018) in users than non-users after test loads with no RP, but did not vary significantly after test loads with 1 g RP. Desire to eat any foods, fullness, prospective food intake, and thirst were not affected by 1 g RP vs. no RP treatment. Appetite ratings after 1 g RP vs. no RP test loads did not vary significantly by HF vs. HC lead-in diet.
3.2.2. Preferred dose
Thirst decreased more (F(9,207)=3.424, p=0.001) immediately after a test load with the preferred RP dose in capsule form, compared to when RP was consumed orally. Sweet food craving decreased more (F(9,207)=1.984, p=0.043) in non-users than users after test loads with the preferred RP dose. Desire to eat, fatty and salty food craving, fullness, hunger, preoccupation with food, and prospective food intake were not affected by oral vs. capsule treatment.
3.2.3. Challenge meal
Figure 6 shows mean energy intake at an ad libitum homogenous challenge meal served at the conclusion of test visits was lower (F(1,23)=5.436, p=0.029) in non-users after test loads with 1 g RP than no RP (mean reduction = 66 kcal), but remained the same in users. Intake tended (F(1,23)=3.010, p=0.096) to be lower in non-users than users after test loads with their preferred RP dose (mean reduction = 143 kcal) following a customary lead-in diet. Challenge meal intake was not was affected by HF vs. HC lead-in diet.
Figure 6.

Mean (± SEM) energy intake at a challenge meal served 270 min after test loads (n=25) was lower in non-users after test loads with 1 g RP compared to no RP, but did not vary significantly in users (p<0.05). *p<0.05
4. Discussion
Chili pepper is perhaps the world’s most widely consumed spice [21] and spicy/hot is reported to be among the most appealing flavors in the United States [40]. Thus, the health effects of red pepper (RP) are of great interest. These data demonstrate potential benefits of RP consumption in weight management. Consistent with earlier findings [3–8, 41], test loads with a 1 g RP dose (hedonically plausible in Western nations) enhanced thermogenesis and led to greater reductions in orexigenic sensations, compared to test loads with no RP. Further, a preferred RP dose (range 0.1–3.5 g) was associated with a lower respiratory quotient (RQ) (implying increased fat oxidation) and tended to lead to more pronounced thermogenic effects when consumed orally, compared to in capsule form. A unique finding was that effects were amplified in non-users of spicy foods, compared to regular users. Although thermogenic and appetitive effects noted in this work are subtle, they should not summarily be interpreted as insignificant. Small dietary changes exert small effects on energy balance, but cumulatively, they may contribute to weight loss or maintenance [41].
4.1. Effects of RP consumption in users versus non-users
Consumption of RP in non-users promoted physiological responses including increased energy expenditure, diminished orexigenic sensations, decreased energy intake, and reduced RQ suggesting enhanced fat oxidation. Lesser, or non-significant, effects were noted in regular users. An earlier study reported physiological responses to RP were weaker in non-users than users. A potential explanation for the conflicting findings is the time course of regular RP exposure. While the majority of spicy food users in our study (69%) reported consuming foods containing chili peppers since childhood, the period of higher chili pepper exposure in the previous study was 4 weeks [25]. A longer period of spicy food exposure may be necessary to induce adaptation to RP’s thermogenic and appetitive effects. Three-month periods have produced hedonic shifts in the taste preference for salt [18] and fat [20], and food palatability has been demonstrated to influence postprandial thermogenesis [23, 24] and appetitive effects [42].
The previous study also indicated that insulin sensitivity was improved and postprandial energy expenditure (PPEE) was reduced following consumption of RP in overweight and obese spicy foods users compared to non-users, but did not vary in lean individuals [25]. Likewise, a Japanese study [3] with subjects unaccustomed to eating spicy foods reported that while PPEE was increased following a RP-containing meal in lean women, there was no effect in obese women matched for age and height. Our study included only lean individuals (with the exception of one user with a BMI of 26.2), so it cannot address the issue of body mass index (BMI)-specific effects, but the outcome is consistent with the findings of the Japanese study [3]. The body composition of users and non-users will be an important consideration in future studies, as it will help to determine whether RP is appropriate as an agent for prevention and/or treatment, of overweight and obesity.
Another noteworthy caveat from the present study is that thermogenic and appetitive effects were amplified in non-users following test loads with their preferred (0.3 ± 0.1 g) RP doses, in addition to standardized moderate (1 g) RP doses. A possible explanation is that even preferred RP exposures were novel among non-users, who were accustomed to consuming spicy foods less than once per month. Conversely, users who ate spicy foods at least three times per week, may have desensitized to the physiological effects of RP and established a new energy balance equilibrium [43]. Collectively, these data indicate that the thermogenic and appetitive effects of RP may be blunted with long-term spicy food intake in lean individuals. Such responses may be linked to decreased activation of the sympathetic nervous system, which is recognized as a feature of obesity [44]. Additional research will be necessary to document this hypothesis and, if verified, determine the length of time required for desensitization and/or re-sensitization to the effects of spicy foods.
Additional limitations of the current study are differences in ethnicity, gender, and body fat between regular spicy food users and non-users that may confound comparisons. A high proportion of users (46%) were Asian, compared to only 8% of non-users. The preponderance of the literature indicates that sensory function is similar across cultures, only the hedonic interpretation varies [45]. In the present study, the preferred RP dose of Asian (1.7 ± 0.4 g) and non-Asian (1.9 ± 0.4 g) users was not significantly different. Additionally, the proportion of male and females in user groups was unequal (i.e., 77% of users were male, compared to 33% of non-users). Although this is a potential confounder, spicy foods are characteristics of cuisine that are broadly adhered to by members of cultures adopting a particular cuisine (e.g., Asian and Latin American cultures). We are aware of no gender difference in preference to spicy foods in the literature, other than the cultural bias that eating spicy foods confers ideals, such as strength and machismo [21]. Body fat was non-significantly lower (F(3,24)=2.301, p=0.107) in non-users (19.4 ± 2.4%) than users (23.4 ± 2.1%). This is likely explained by gender differences, as BMI was similar in users and non-users (F(3,24)=0.477, p=0.702). Ethnicity, gender, and body fat should be considerations in the design of future studies.
4.2. Effects of RP consumption on substrate oxidation
Macronutrient-controlled lead-in diets were implemented to explore published contradictory observations concerning RP’s influence on substrate oxidation [6, 8, 10, 27]. It was hypothesized that RP would increase the oxidation of available substrate regardless of its nature. Increased energy expenditure was observed after both macronutrient-controlled lead-in diets with no preferential oxidation of fat or carbohydrate following high fat (HF) or high carbohydrate (HC) diets compared to each other. However, after customary diet lead-ins, fat oxidation was augmented with oral versus gastric RP exposure. A limitation of the HF and HC lead-in diets in the present study is that daily intakes were approximately 500 kcal greater than when participants followed their customary diets. This may have masked substrate-specific effects, since carbohydrate overfeeding can enhance carbohydrate oxidation and decrease fat oxidation, while fat overfeeding produces more modest changes [46]. Another potential limitation of the current study is the short period of assessment, which was 270 min following single test loads. It is possible that longer-term measurement following macronutrient-specific lead-in diets would have favored fat oxidation, as was demonstrated with oral compared to gastric exposures in this study and in another that entailed a three month exposure following a one month weight loss phase [27]. A difference between this study and those reporting that RP increased carbohydrate oxidation [6, 10] is that prior studies used higher carbohydrate (60%) and higher energy (650 kcal) test loads, compared to 50% carbohydrate and 500 kcal in our study. The previous studies also measured diet-induced thermogenesis for a shorter period (150 min), compared to 270 min in our study. These distinctions are relevant, because when carbohydrates are available, they are preferentially oxidized [47]. Further research will be required to determine RP’s effects on substrate oxidation with better matched energy intake, more controlled macronutrient composition of the diet, and longer assessment.
4.3. Effects of oral versus gastric RP exposure
There are discrepant reports on the role of sensory stimulation by RP on thermogenesis and appetite [4, 5, 7]. PPEE tended to be greater in non-users (but did not vary in users), RQ was lower, and skin temperature was higher when RP was consumed orally, compared to in capsule form. Thus, our study suggests that sensory exposure to RP exerts independent effects on thermogenesis and appetite. These findings are in agreement with a study evaluating effects of a standardized (0.9 g) RP dose [4] that found a stronger reduction in energy intake with oral exposure than gastric exposure, and reported similar hedonic ratings for both forms of exposure. However, the findings of a study evaluating the effects of a self-perceived “maximum tolerable dose” of RP (0.923 ± SD 1.377 g) [5] reported that fat intake was decreased equally with both oral and gastric exposures (hedonics were not assessed). A potential explanation, deserving further study, is that the greatest effects on thermogenesis and appetite are achieved with palatable RP doses. Capsiate, a non-pungent capsaicin analog found in a non-pungent variety of RP, may be a useful stimulus to further address this property. Capsiate reportedly enhances thermogenesis, including increased core body and forehead temperature [48], energy expenditure [48, 49], and fat oxidation [50], as well as decreased body weight [51], total body fat percentage [51], and abdominal fat [50]. If confirmed, these results may present promising weight management benefits to non-users who abstain from RP due to its sensory burn.
Together, these data indicate that consumption of acceptable RP doses served at a single meal enhance thermogenesis and moderate orexigenic sensations in healthy, lean individuals. These findings are distinct from earlier published observations in several respects. First, RP doses were modest and generally accepted by the population, thus nutritionally relevant outcomes are demonstrated. Second, the differential responses observed in users and non-users suggest that individuals may become desensitized to the effects of RP with long-term spicy food use, leaving open questions about the sustainability and optimization of desired physiological effects. Third, independent sensory effects exerted by RP were confirmed, indicating that oral exposure is necessary to achieve RP’s maximum benefits, though more is not necessarily better. Preferred concentrations, in real foods rather than dietary supplements, may be most effective for weight management.
Research highlights.
Ingestion of red pepper (RP) increased energy expenditure and core temperature.
Respiratory quotient was lower after oral RP ingestion compared to capsule form.
RP ingestion lowered intake and appetite in spicy foods non-users, but not users.
RP’s effects on energy balance are a combination of metabolic and sensory inputs.
Desensitization to RP’s effects may occur with long-term spicy food intake.
Acknowledgments
Support: This investigation was supported by the National Institutes of Health (NIH) under Ruth L. Kirschstein National Research Service Award (5T32DK076540) and the McCormick Science Institute. Its contents are solely the responsibility of the authors and do not necessarily represent the official views of the NIH or the McCormick Science Institute.
Footnotes
Publisher's Disclaimer: This is a PDF file of an unedited manuscript that has been accepted for publication. As a service to our customers we are providing this early version of the manuscript. The manuscript will undergo copyediting, typesetting, and review of the resulting proof before it is published in its final citable form. Please note that during the production process errors may be discovered which could affect the content, and all legal disclaimers that apply to the journal pertain.
References
- 1.Flegal KM, Carroll MD, Ogden CL, Curtin LR. Prevalence and trends in obesity among US adults, 1999–2008. J Am Med Assoc. 2010;303:235–41. doi: 10.1001/jama.2009.2014. [DOI] [PubMed] [Google Scholar]
- 2.Mattes RD. Dietary approaches to exploit energy balance utilities for body weight control. In: Coulston A, Boushey C, editors. Nutrition in the prevention and treatment of disease. 2. Burlington, MA: Elsevier Academic Press; 2008. pp. 457–68. [Google Scholar]
- 3.Matsumoto T, Miyawaki C, Ue H, Yuasa T, Miyatsuji A, Moritani T. Effects of capsaicin-containing yellow curry sauce on sympathetic nervous system activity and diet-induced thermogenesis in lean and obese young women. J Nutr Sci Vitaminol. 2000;46:309–15. doi: 10.3177/jnsv.46.309. [DOI] [PubMed] [Google Scholar]
- 4.Westerterp-Plantenga MS, Smeets A, Lejeune MPG. Sensory and gastrointestinal satiety effects of capsaicin on food intake. Int J Obesity. 2005;29:682–8. doi: 10.1038/sj.ijo.0802862. [DOI] [PubMed] [Google Scholar]
- 5.Yoshioka M, Imanaga M, Ueyama H, Yamane M, Kubo Y, Boivin A, et al. Maximum tolerable dose of red pepper decreases fat intake independently of spicy sensation in the mouth. Brit J Nutr. 2004;91:991–5. doi: 10.1079/BJN20041148. [DOI] [PubMed] [Google Scholar]
- 6.Yoshioka M, Lim K, Kikuzato S, Kiyonaga A, Tanaka H, Shindo M, et al. Effects of red-pepper diet on the energy metabolism in men. J Nutr Sci Vitaminol. 1995;41:647–56. doi: 10.3177/jnsv.41.647. [DOI] [PubMed] [Google Scholar]
- 7.Yoshioka M, St-Pierre S, Drapeau V, Dionne I, Doucet E, Suzuki M, et al. Effects of red pepper on appetite and energy intake. Brit J Nutr. 1999;82:115–23. [PubMed] [Google Scholar]
- 8.Yoshioka M, St-Pierre S, Suzuki M, Tremblay A. Effects of red pepper added to high-fat and high-carbohydrate meals on energy metabolism and substrate utilization in Japanese women. Brit J Nutr. 1998;80:503–10. doi: 10.1017/s0007114598001597. [DOI] [PubMed] [Google Scholar]
- 9.Smeets A, Westerterp-Plantenga M. The acute effects of a lunch containing capsaicin on energy and substrate utilisation, hormones, and satiety. Eur J Clin Nutr. 2009;48:229–34. doi: 10.1007/s00394-009-0006-1. [DOI] [PMC free article] [PubMed] [Google Scholar]
- 10.Lim K, Yoshioka M, Kikuzato S, Kiyonaga A, Tanaka H, Shindo M, et al. Dietary red pepper ingestion increases carbohydrate oxidation at rest and during exercise in runners. Med Sci Sport Exer. 1997;29:355–61. doi: 10.1097/00005768-199703000-00010. [DOI] [PubMed] [Google Scholar]
- 11.Ku Y, Choi S. The Scientific Technology of Kimchi. Seoul, Korea: Korean Institute of Food Development; 1990. The composition of foods; pp. 33–4. [Google Scholar]
- 12.Smiciklas-Wright H, Mitchell DC, Mickle SJ, Cook AJ, Goldman JD. US Department of Agriculture NFS Report No. 96–5. 2002. Foods commonly eaten in the United States: quantities consumed per eating occasion and in a day, 1994–1996. [Google Scholar]
- 13.Lawless H, Rozin P, Shenker J. Effects of oral capsaicin on gustatory, olfactory, and irritant sensations and flavor identification in humans who regularly or rarely consume chili pepper. Chem Senses. 1985;10:579–89. [Google Scholar]
- 14.Prescott J, Stevenson RJ. Effects of oral chemical irritation on tastes and flavors in frequent and infrequent users of chili. Physiol Behav. 1995;58:1117–27. doi: 10.1016/0031-9384(95)02052-7. [DOI] [PubMed] [Google Scholar]
- 15.Stevenson RJ, Prescott J. The effects of prior experience with capsaicin on ratings of its burn. Chem Senses. 1994;19:651–6. doi: 10.1093/chemse/19.6.651. [DOI] [PubMed] [Google Scholar]
- 16.Stevenson RJ, Yeomans MR. Differences in ratings of intensity and pleasantness for the capsaicin burn between chili likers and non-likers: implications for liking development. Chem Senses. 1993;18:471–82. [Google Scholar]
- 17.Yoshioka M, Doucet E, Drapeau V, Dionne I, Tremblay A. Combined effects of red pepper and caffeine consumption on 24 h energy balance in subjects given free access to foods. Brit J Nutr. 2001;85:203–11. doi: 10.1079/bjn2000224. [DOI] [PubMed] [Google Scholar]
- 18.Bertino M, Beauchamp GK, Engelman K. Long-term reduction in dietary sodium alters the taste of salt. Am J Clin Nutr. 1982;36:1134–44. doi: 10.1093/ajcn/36.6.1134. [DOI] [PubMed] [Google Scholar]
- 19.Bertino M, Beauchamp GK, Engelman K. Increasing dietary salt alters salt taste preference. Physiol Behav. 1986;38:203–13. doi: 10.1016/0031-9384(86)90155-1. [DOI] [PubMed] [Google Scholar]
- 20.Mattes RD. Fat preference and adherence to a reduced-fat diet. Am J Clin Nutr. 1993;57:373–81. doi: 10.1093/ajcn/57.3.373. [DOI] [PubMed] [Google Scholar]
- 21.Rozin P, Schiller D. The nature and acquisition of a preference for chili pepper by humans. Motiv Emotion. 1980;4:77–101. [Google Scholar]
- 22.Mattes RD. Physiologic responses to sensory stimulation by food: nutritional implications. J Am Diet Assoc. 1997;97:406–13. doi: 10.1016/S0002-8223(97)00101-6. [DOI] [PubMed] [Google Scholar]
- 23.LeBlanc J, Brondel L. Role of palatability on meal-induced thermogenesis in human subjects. Am J Physiol-Endoc M. 1985;248:333–6. doi: 10.1152/ajpendo.1985.248.3.E333. [DOI] [PubMed] [Google Scholar]
- 24.Raben A, Christensen NJ, Madsen J, Holst JJ, Astrup A. Decreased postprandial thermogenesis and fat oxidation but increased fullness after a high-fiber meal compared with a low-fiber meal. Am J Clin Nutr. 1994;59:1386–94. doi: 10.1093/ajcn/59.6.1386. [DOI] [PubMed] [Google Scholar]
- 25.Ahuja KDK, Robertson IK, Geraghty DP, Ball MJ. Effects of chili consumption on postprandial glucose, insulin, and energy metabolism. Am J Clin Nutr. 2006;84:63–9. doi: 10.1093/ajcn/84.1.63. [DOI] [PubMed] [Google Scholar]
- 26.Tappy L, Girardet K, Schwaller N, Vollenweider L. Metabolic effects of an increase of sympathetic activity in healthy humans. Int J Obesity. 1995;19:419–22. [PubMed] [Google Scholar]
- 27.Lejeune M, Kovacs EMR, Westerterp-Plantenga MS. Effect of capsaicin on substrate oxidation and weight maintenance after modest body-weight loss in human subjects. Brit J Nutr. 2003;90:651–9. doi: 10.1079/bjn2003938. [DOI] [PubMed] [Google Scholar]
- 28.Montell C, Caterina MJ. Thermoregulation: channels that are cool to the core. Curr Biol. 2007;17:R885–R7. doi: 10.1016/j.cub.2007.08.016. [DOI] [PubMed] [Google Scholar]
- 29.Duffy VB. Variation in oral sensation: implications for diet and health. Curr Opin Gastroen. 2007;23:171–7. doi: 10.1097/MOG.0b013e3280147d50. [DOI] [PubMed] [Google Scholar]
- 30.Bartoshuk LM, Duffy VB, Miller IJ. PTC/PROP tasting: anatomy, psychophysics, and sex effects. Physiol Behav. 1994;56:1165–71. doi: 10.1016/0031-9384(94)90361-1. [DOI] [PubMed] [Google Scholar]
- 31.Johansson G, Westerterp KR. Assessment of the physical activity level with two questions: validation with doubly labeled water. Int J Obesity. 2008;32:1031–3. doi: 10.1038/ijo.2008.42. [DOI] [PubMed] [Google Scholar]
- 32.Borushek A. The Calorie King Calorie, Fat, and Carbohydrate Counter. Costa Mesa, CA: Family Health Publications; 2008. [Google Scholar]
- 33.Sakamoto Y, Nishizawa M, Sato H, Wang ZM, Heymsfield SB. First Annual Nutrition Week: A Scientific and Clinical Forum and Exposition. San Diego: Am J Clin Nutr; 2002. International comparison: resting energy expenditure prediction models; p. 358S. [Google Scholar]
- 34.McCrory MA, Gomez TD, Bernauer EM, Mole PA. Evaluation of a new air displacement plethysmograph for measuring human body composition. Med Sci Sport Exer. 1995;27:1686–91. [PubMed] [Google Scholar]
- 35.Weir JB. New methods for calculating metabolic rate with special reference to protein metabolism. J Physiol. 1949;109:1–9. doi: 10.1113/jphysiol.1949.sp004363. [DOI] [PMC free article] [PubMed] [Google Scholar]
- 36.O’Brien C, Hoyt RW, Buller MJ, Castellani JW, Young AJ. Telemetry pill measurement of core temperature in humans during active heating and cooling. Med Sci Sport Exer. 1998;30:468–72. doi: 10.1097/00005768-199803000-00020. [DOI] [PubMed] [Google Scholar]
- 37.Flint A, Raben A, Blundell JE, Astrup A. Reproducibility, power, and validity of visual analogue scales in assessment of appetite sensations in single test meal studies. Int J Obesity. 2000;24:38–48. doi: 10.1038/sj.ijo.0801083. [DOI] [PubMed] [Google Scholar]
- 38.Hill A, Blundell J. Nutrients and behaviour: research strategies for the investigation of taste characteristics, food preferences, hunger sensations and eating patterns in man. J Psychiatr Res. 1983;17:203–12. doi: 10.1016/0022-3956(82)90023-1. [DOI] [PubMed] [Google Scholar]
- 39.Stubbs RJ, Hughes DA, Johnstone AM, Rowley E, Ferris S, Elia M, et al. Description and evaluation of a Newton-based electronic appetite rating system for temporal tracking of appetite in human subjects. Physiol Behav. 2001;72:615–9. doi: 10.1016/s0031-9384(00)00440-6. [DOI] [PubMed] [Google Scholar]
- 40.Sloan A. What, when, and where America eats. Food Technol. 2010;64:19–27. [Google Scholar]
- 41.Hill J, Wyatt H, Reed G, Peters J. Obesity and the environment: where do we go from here. Science. 2003;299:853–5. doi: 10.1126/science.1079857. [DOI] [PubMed] [Google Scholar]
- 42.McCrory MA, Suen VMM, Roberts SB. Biobehavioral influences on energy intake and adult weight gain. J Nutr. 2002;132:3830S–4S. doi: 10.1093/jn/132.12.3830S. [DOI] [PubMed] [Google Scholar]
- 43.Leibel RL, Rosenbaum M, Hirsch J. Changes in energy expenditure resulting from altered body weight. N Engl J Med. 1995;332:621–8. doi: 10.1056/NEJM199503093321001. [DOI] [PubMed] [Google Scholar]
- 44.Straznicky NE, Lambert GW, Lambert EA. Neuroadrenergic dysfunction in obesity: an overview of the effects of weight loss. Curr Opin Lipidol. 2010;21:21–30. doi: 10.1097/MOL.0b013e3283329c62. [DOI] [PubMed] [Google Scholar]
- 45.Prescott J. Comparison of taste perceptions and preferences of Japanese and Australian consumers: overview and implications for cross-cultural sensory research. Food Qual Prefer. 1998;9:393–402. [Google Scholar]
- 46.Horton TJ, Drougas H, Brachey A, Reed GW, Peters JC, Hill JO. Fat and carbohydrate overfeeding in humans: different effects on energy storage. Am J Clin Nutr. 1995;62:19–29. doi: 10.1093/ajcn/62.1.19. [DOI] [PubMed] [Google Scholar]
- 47.Hill J, Drougas H, Peters J. Obesity treatment: can diet composition play a role? Ann Intern Med. 1993;119:694–7. doi: 10.7326/0003-4819-119-7_part_2-199310011-00013. [DOI] [PubMed] [Google Scholar]
- 48.Ohnuki K, Niwa S, Maeda S, Inoue N, Yazawa S, Fushiki T. CH-19 sweet, a non-pungent cultivar of red pepper, increased body temperature and oxygen consumption in humans. Biosci Biotechnol Biochem. 2001;65:2033–6. doi: 10.1271/bbb.65.2033. [DOI] [PubMed] [Google Scholar]
- 49.Hachiya S, Kawabata F, Ohnuki K, Inoue N, Yoneda H, Yazawa S, et al. Effects of CH-19 Sweet, a non-pungent cultivar of red pepper, on sympathetic nervous activity, body temperature, heart rate, and blood pressure in humans. Biosci Biotechnol Biochem. 2007;71:671–6. doi: 10.1271/bbb.60359. [DOI] [PubMed] [Google Scholar]
- 50.Snitker S, Fujishima Y, Shen H, Ott S, Pi-Sunyer X, Furuhata Y, et al. Effects of novel capsinoid treatment on fatness and energy metabolism in humans: possible pharmacogenetic implications. Am J Clin Nutr. 2009;89:45–50. doi: 10.3945/ajcn.2008.26561. [DOI] [PMC free article] [PubMed] [Google Scholar]
- 51.Kawabata F, Inoue N, Yazawa S, Kawada T, Inoue K, Fushiki T. Effects of CH-19 sweet, a non-pungent cultivar of red pepper, in decreasing the body weight and suppressing body fat accumulation by sympathetic nerve activation in humans. Biosci Biotechnol Biochem. 2006;70:2824–35. doi: 10.1271/bbb.60206. [DOI] [PubMed] [Google Scholar]