Abstract
Purpose
To quantify the effects of motion affected image-derived input functions (IDIF) on the outcome of tracer kinetic analyses.
Procedures
Two simulation studies, one based on high and the other on low cortical uptake, were performed. Different degrees of rotational and axial translational motion were added to the final frames of simulated dynamic positron emission tomography scans. Extracted IDIFs from motion affected simulated scans were compared to original IDIFs and to outcome of tracer kinetic analysis (volume of distribution, V T).
Results
Differences in IDIF values of up to 239% were found for the last frames. Patient motion of more than 6° or 5 mm resulted in at least 10% higher or lower V T values for the high cortical tracer.
Conclusion
The degrees of motion studied are commonly observed in clinical studies and hamper the extraction of accurate IDIFs. Therefore, it is essential to ensure that patient motion is minimal and corrected for.
Key words: Patient motion, Motion correction, Positron emission tomography, Image derived input function, Tracer kinetic analysis
Introduction
The quantitative accuracy of positron emission tomography (PET) can, among other things, be hampered by patient motion. This may result in loss of resolution or, more importantly, affect outcome measures of tracer kinetic analyses. In general, for tracer kinetic modeling, the time course of the tracer in arterial plasma (plasma input curve) is required, unless a reference tissue, devoid of specific binding [1, 2], can be found in which non-specific tracer uptake is identical to that in the tissue of interest. In a previous simulation study, it was shown that errors in the outcome of tracer kinetic analyses could be as high as 45% when a motion of 2 cm was present [3]. In the same study, an offline frame-by-frame motion correction method was introduced, which accurately corrected PET scans for patient motion [3]. This previous study only took into account effects of motion on determining radioactivity concentrations in the tissue of interest, as arterial sampling was used to obtain the plasma input curve. Obviously, arterial sampling is not affected by patient motion, but it is an invasive and laborious procedure. In addition, arterial sampling is sensitive to errors and has a small risk of adverse effects [4, 5]. To overcome the problems of arterial sampling, many alternative methods have been proposed [6]. In previous studies, such an alternative method was developed [6] and validated [7, 8], in which input functions were extracted from the dynamic PET scan itself, thereby obviating the need for arterial sampling. Although these image-derived input functions (IDIFs) do not have the disadvantages of arterial sampling, they are vulnerable to patient motion [6, 8]. To extract an IDIF, a mask over the internal carotid arteries can be defined in a summed image of the first couple of frames. This mask is then copied to all dynamic frames to derive the IDIF. Patient motion in later frames, however, will result in under- or overestimation of IDIF values and, therefore, in inaccurate IDIFs. The under- and overestimation of IDIF values in motion affected frames are not just due to the mislocation of the IDIF mask, but also due to an erroneous attenuation correction. These inaccurate IDIFs in turn will affect the outcome of tracer kinetic analyses.
The purpose of the present study was to quantify the effects of motion on the outcome of tracer kinetic analyses when IDIFs affected by that motion are used as input function. To this end, simulation studies were performed based on [11C]flumazenil and (R)-[11C]verapamil kinetics, thereby investigating effects for both high and low cortical uptake tracers.
Materials and Methods
Simulated PET Scans
Two simulated scans were generated, one simulating [11C]flumazenil kinetics, the other (R)-[11C]verapamil. These two tracers were chosen, as they represent examples of high and low cortical uptake tracers, respectively. Both simulated PET scans were based on a grey-white matter segmented magnetic resonance imaging (MRI) scan. For each tracer, typical grey and white matter time activity curves (TACs) were allocated to the grey and white matter segmentations of the MRI scan, respectively. Finally, these grey and white matter segmentations were summed, generating a simulated dynamic emission scan with the following frames:
▪ [11C]flumazenil: 4 × 15, 4 × 60, 2 × 150, 2 × 300, 4 × 600 s;
▪ (R)-[11C]verapamil: 1 × 15, 3 × 5, 3 × 10, 2 × 30, 3 × 60, 2 × 150, 2 × 300, 4 × 600 s.
In addition, the internal carotid artery was simulated by allocating whole blood TAC (not corrected for metabolites) from actual human [11C]flumazenil and (R)-[11C]verapamil subjects to the segmented carotid artery and circle of Willis as seen on the MRI scan. Finally, simulated PET scans were smoothed with a Gaussian kernel of 6 mm to obtain a resolution comparable to that of current PET scanners.
Simulated Motion
Before adding motion to the simulated PET scans, the simulated scans were forward projected to obtain sinograms and the inverse attenuation correction, derived from a reconstructed transmission scan, was applied to these sinograms. Next, these sinograms were reconstructed using a normalization weighted ordered subsets expectation maximization (OSEM) to generate non-attenuation corrected images.
Two types of motion were imposed onto the non-attenuation corrected simulated scans. First, different degrees of rotation (napping/nodding, 1, 3, 4, 6, 7, 8, 10, 12, and 15°, corresponding to ∼2-20 mm) were applied. The second type of motion simulated an axial inferior movement (1-6, 10, 15, and 20 mm) of the subject. These movements are seen most frequently in clinical practice in case subjects are fixed using a head holder. In addition, the range of rotational and translational movements corresponds with those observed in clinical practice [9, 10]. Motion was added using Vinci software (Max Planck Institute for Neurological Research, Cologne, Germany, http://www.mpifnf.de/vinci/). As motion is most frequently observed at later time points (>10 min p.i.) [11] in this simulation, it was only added to the last six frames of each simulated scan. The motion was, however, simulated as a gradual phenomenon, according to the following scheme, where N represents the total number of frames:
Frame N-5: 10% of maximum motion,
Frame N-4: 25% of maximum motion,
Frame N-3: 40% of maximum motion,
Frame N-2: 60% of maximum motion,
Frame N-1: 75% of maximum motion,
Frame N: maximum motion.
After adding motion, all non-attenuation corrected simulated PET scans were again forward projected to obtain sinograms. These sinograms were then reconstructed using normalization and attenuation weighted OSEM to obtain standard dynamic PET images. All reconstructions were performed using four iterations and 18 subsets and consisted of 63 planes of 128 × 128 voxels and a voxel size of 2.57 × 2.57 × 2.43 mm3.
Image Derived Input Functions
To extract an IDIF, a region of interest (ROI) was defined on a volume of 14 successive planes, starting six planes below the circle of Willis. This volume corresponded to the position of the carotid arteries. The IDIF ROIs were defined (semi)-automatically on frame 3 of the original (unmoved) simulated scan using the ‘four hottest pixels per plane’ method [6]. These ROIs were projected onto all frames of the simulated scan thereby generating image-derived whole blood time activity curves. Image-derived whole blood time activity curves were corrected for metabolites and plasma-to-whole blood ratios by use of plasma-to-whole blood and parent fractions derived from seven manual samples, as described previously [6–8], resulting in parent plasma IDIFs. The procedure for extracting IDIFs was repeated for all simulated PET scans using the original IDIF mask.
Analysis
IDIFs that were extracted from scans with superimposed movements were compared with original (unmoved) IDIFs. In addition, for each scan, parametric volume of distribution (V T) images were calculated using Logan analysis [12]. To determine the overall effect of motion on outcome of tracer kinetic analyses, V T images were calculated from motion affected scans, together with IDIFs extracted from those scans. In addition, to determine the specific effects of motion-affected IDIFs alone, V T images were also calculated using those IDIFs in combination with the original scans (i.e., without superimposed movement) to show effects of motion artefacts in IDIFs only. Resulting mean V T values for different anatomical regions (frontal, prefrontal, temporal, occipital cortex, parietal cortex, thalamus, caudate, cerebellum, and pons) were calculated and compared with original V T values. Results are presented as mean percentage differences (mean ± SD) over all regions between original (unmoved) and motion-affected scans.
In addition, all simulated PET scans were corrected for motion using a frame-by-frame motion correction method. Motion correction was performed using the Automated Image Registration (version 5.1.5; [13]) with optimal settings, as found in a previous study [3]. For (R)-[11C]verapamil, optimal settings of (R)-[11C]PK11195 were used, as (R)-[11C]verapamil is also a low cortical uptake tracer. After motion correction, new IDIFs were extracted and corrected for metabolites and plasma-to-whole blood ratios. V T images were generated using the motion-corrected simulated PET scans and the new IDIFs. Mean V T values were again compared to the original V T values.
Results
IDIF Extraction
To illustrate the problem of extracting IDIFs in case of motion, examples of IDIF masks projected onto scans affected by different degrees of rotational and translational motion are shown in Figs. 1 (sagittal view) and 2 (coronal view), respectively. It can be seen that, in this example, mispositioning of the mask (black region, indicated with the arrow) becomes problematic when there is a translation of at least 3° (Fig. 1) or a rotation of at least 4 mm (Fig. 2). For the largest movements (at least 6° or 10 mm), the IDIF mask actually is, at least in part, positioned within the brain and this may result in both under- or overestimation of the IDIF depending on relative blood and tissue concentrations.
Fig. 1.
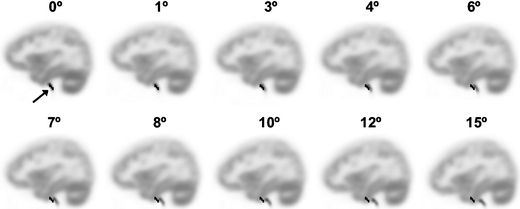
Sagittal view of the last frame of the [11C]flumazenil simulated PET scan with on top the IDIF mask (black region, indicated with arrow in top left image) generated using the four hottest pixels per plane method. The simulated PET scan has different amounts of rotational movement.
Fig. 2.
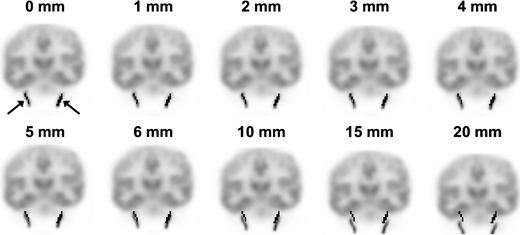
Coronal view of the last frame of the [11C]flumazenil simulated PET scan with on top the IDIF mask (black regions, indicated with two arrows in top left image) generated using the four hottest pixels per plane method. The simulated PET scan has different amounts of translational movement.
Effect of Motion on IDIF
Figure 3 shows the last part (>8 min) of IDIFs extracted from the original simulated scans (3a, b: [11C]flumazenil; 3c, d: (R)-[11C]verapamil) together with IDIFs extracted from scans that were affected by different degrees of translational (Fig. 3a, c) and rotational (Fig. 3b, d) motion. Note that the first part is not shown in Fig. 3, as no motion was imposed onto the first couple of frames (0-10 min). For [11C]flumazenil-based simulations, large differences (up to 205% in the final frame) in IDIF values were found in case of a rotational movement of 15°. For rotational movements of 3° or less, differences were smaller than 10%. When translational motion was present, differences of up to 68% (10 mm) and 239% (20 mm) in IDIF values were seen. For translational motions smaller than 4 mm, overestimation of IDIF values was 10% or less. For (R)-[11C]verapamil-based simulations, large differences in IDIF values were seen for a rotational movement of 6° and a translational movement of 3 mm (both up to 19% higher IDIF values). In case of smaller movements, only differences of up to 13% were found. Maximal differences in IDIF values for (R)-[11C]verapamil were found for a rotational movement of 15° (up to 91%) and a translational movement of 20 mm (up to 154%).
Fig. 3.
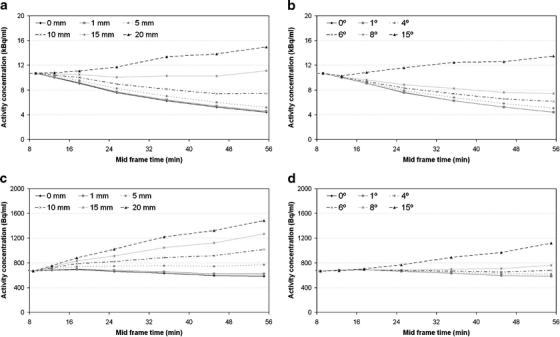
IDIFs (10–60 min, mid frame times are shown on x-axis) extracted from simulated [11C]flumazenil (a, b) and (R)- [11C]verapamil (c, d) scans with superimposed translational (a, c), and rotational (b, d) movements at later time frames.
Effect of Motion-affected IDIFs on Tracer Kinetic Analysis
Regional differences between original V T and V T derived from motion-affected PET scans in combination with motion-affected IDIFs for [11C]flumazenil and (R)-[11C]verapamil are shown in Figs. 4 and 5, respectively. For [11C]flumazenil, largest regional differences (maximal 59%) are found for the putamen and caudate (both rotational and translational, Fig. 4a, b) and thalamus (Fig. 4a). Mean differences in V T values over all regions are shown in Table 1. On average over all regions, differences >10% were found for a motion of 6° (12%) or at least 5 mm (10%). For (R)-[11C]verapamil-based simulations, no large regional differences were found (Fig. 5a, b). On average, differences >10% were observed for a rotational motion of 12° and a translational motion of 4 mm (Table 1).
Fig. 4.
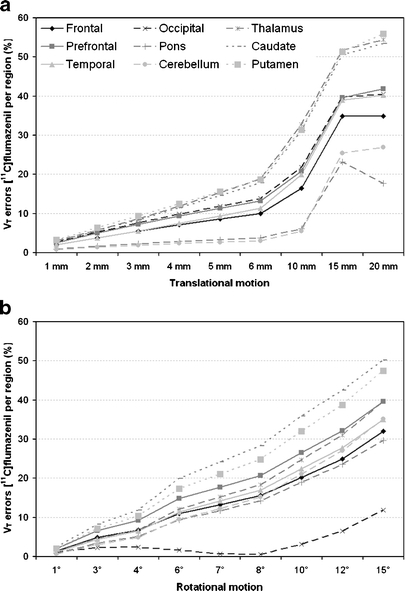
[11C] flumazenil derived V T errors for different anatomic regions and different amounts of (a) translational and (b) rotational added motion.
Fig. 5.
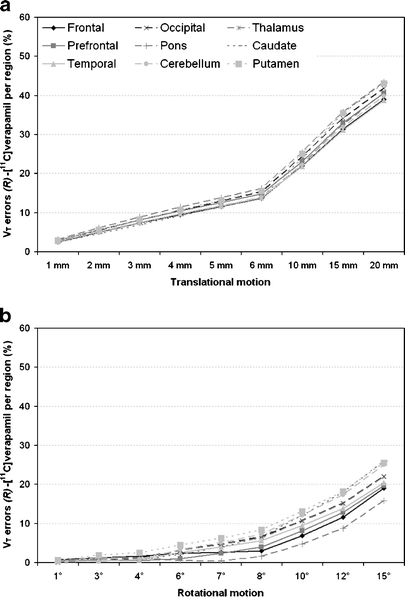
(R)-[11C] verapamil derived V T errors for different anatomic regions and different amounts of (a) translational and (b) rotational added motion.
Table 1.
Mean V T errors (±SD%) over different anatomic regions derived from motion-affected simulated PET scans in combination with IDIFs extracted from the same motion-affected scans
| Motion | V T error (%) [11C]flumazenil | V T error (%) (R)-[11C]verapamil | |
|---|---|---|---|
| Translation (mm) | 1 | 2.2 ± 0.9 | 2.7 ± 0.2 |
| 2 | 4.2 ± 1.8 | 5.3 ± 0.4 | |
| 3 | 6.2 ± 2.7 | 7.7 ± 0.6 | |
| 4 | 8.3 ± 3.7 | 10.1 ± 0.7 | |
| 5 | 10.3 ± 4.8 | 12.3 ± 0.8 | |
| 6 | 12.3 ± 6.0 | 14.5 ± 0.9 | |
| 10 | 20.7 ± 10.2 | 23.3 ± 1.4 | |
| 15 | 39.5 ± 10.6 | 33.4 ± 1.8 | |
| 20 | 40.6 ± 12.9 | 41.1 ± 1.8 | |
| Rotation (deg) | 1 | 1.4 ± 0.6 | 0.4 ± 0.2 |
| 3 | 5.0 ± 2.0 | 0.9 ± 0.5 | |
| 4 | 7.1 ± 2.9 | 1.1 ± 0.6 | |
| 6 | 11.9 ± 5.3 | 2.5 ± 1.2 | |
| 7 | 14.4 ± 6.6 | 3.8 ± 1.8 | |
| 8 | 17.2 ± 7.8 | 5.5 ± 2.2 | |
| 10 | 22.7 ± 9.2 | 9.7 ± 2.7 | |
| 12 | 28.2 ± 10.3 | 14.5 ± 3.1 | |
| 15 | 35.6 ± 11.2 | 21.7 ± 3.4 |
The specific effect of (only) mislocating IDIFs themselves is shown in Table 2. For all anatomic regions nearly the same differences were found (note the low SD values in Table 2). As expected, mean differences over all regions increased with increasing degree of motion. For (R)-[11C]verapamil-comparable results were obtained compared to the general effect of motion in case both motion-affected IDIF and motion-affected dynamic PET scans (Table 1) were used. For [11C]flumazenil, the same, but lower trend was observed compared to the general effect of motion (Table 1).
Table 2.
The specific effect of motion-affected IDIFs on outcome of tracer kinetic analysis. Mean V T differences (mean ± SD%) over different anatomic regions derived from original (no motion) simulated PET scans in combination with IDIFs extracted from motion-affected simulated PET scans
| Motion | V T error (%) [11C]flumazenil | V T error (%) (R)-[11C]verapamil | |
|---|---|---|---|
| Translational (mm) | 1 | 1.0 ± 0.0 | 2.7 ± 0.0 |
| 2 | 1.9 ± 0.0 | 5.4 ± 0.0 | |
| 3 | 2.7 ± 0.0 | 7.8 ± 0.1 | |
| 4 | 3.7 ± 0.0 | 10.2 ± 0.1 | |
| 5 | 4.6 ± 0.0 | 12.4 ± 0.1 | |
| 6 | 5.6 ± 0.0 | 14.6 ± 0.1 | |
| 10 | 11.0 ± 0.0 | 23.2 ± 0.1 | |
| 15 | 30.2 ± 0.0 | 32.8 ± 0.2 | |
| 20 | 30.2 ± 0.0 | 40.6 ± 0.2 | |
| Rotation (deg) | 1 | 0.1 ± 0.0 | 0.1 ± 0.0 |
| 3 | 1.7 ± 0.0 | 0.6 ± 0.0 | |
| 4 | 3.0 ± 0.0 | 1.4 ± 0.0 | |
| 6 | 6.4 ± 0.0 | 3.6 ± 0.0 | |
| 7 | 8.5 ± 0.0 | 5.2 ± 0.0 | |
| 8 | 10.8 ± 0.0 | 7.1 ± 0.0 | |
| 10 | 15.5 ± 0.0 | 11.2 ± 0.1 | |
| 12 | 20.4 ± 0.0 | 15.8 ± 0.1 | |
| 15 | 27.5 ± 0.0 | 22.5 ± 0.1 |
Tracer Kinetic Analysis After Motion Correction
Mean differences between original V T and V T derived from motion corrected-PET scans in combination with IDIFs extracted from those motion corrected PET scans are shown in Table 3. For [11C]flumazenil, only very small differences were found compared to the original V T values (maximal 1.4 ± 0.6%). However, somewhat larger differences were found for (R)-[11C]verapamil (maximal 4.3 ± 0.5%).
Table 3.
Mean V T errors (±SD%) over different anatomic regions derived from motion-affected simulated PET scans after motion correction
| Motion | V T error (%) [11C]flumazenil | V T error (%) (R)-[11C]verapamil | |
|---|---|---|---|
| Translation (mm) | 1 | 0.4 ± 0.2 | 1.1 ± 0.2 |
| 2 | 0.6 ± 0.4 | 1.9 ± 0.3 | |
| 3 | 1.1 ± 0.4 | 3.0 ± 0.4 | |
| 4 | 1.0 ± 0.4 | 4.3 ± 0.5 | |
| 5 | 0.9 ± 0.4 | 0.6 ± 0.3 | |
| 6 | 0.9 ± 0.5 | 2.6 ± 0.5 | |
| 10 | 1.4 ± 0.4 | 0.6 ± 0.3 | |
| 15 | 1.4 ± 0.6 | 2.5 ± 0.5 | |
| 20 | 1.3 ± 0.6 | 2.4 ± 0.6 | |
| Rotation (deg) | 1 | 0.4 ± 0.3 | 0.7 ± 0.2 |
| 3 | 0.8 ± 0.4 | 1.0 ± 0.6 | |
| 4 | 0.7 ± 0.3 | 0.9 ± 0.6 | |
| 6 | 1.2 ± 0.6 | 1.6 ± 0.7 | |
| 7 | 1.2 ± 0.6 | 2.3 ± 1.1 | |
| 8 | 1.3 ± 0.6 | 3.3 ± 1.7 | |
| 10 | 1.0 ± 0.6 | 1.7 ± 0.8 | |
| 12 | 1.0 ± 0.6 | 1.5 ± 1.1 | |
| 15 | 1.0 ± 0.6 | 3.4 ± 0.5 |
Discussion
Simulated Motion
Both rotational and translational motions were added to the simulated scans, as these are the most frequently observed types of patient motions [9]. Although the amount of patient motion is generally small, for some patient groups (i.e., Alzheimer, Parkinson, or neurotrauma) motion up to 20-30 mm has been observed [3, 9, 10].
Effect of Motion on IDIF
Although the IDIF mask was (in part) positioned outside the carotid artery for a translational motion of 4 mm or a rotational motion of at least 3°, large differences in IDIF values were only observed for a translational motion of at least 10 mm (Fig. 3a) or a rotational motion of at least 8° (Fig. 3b). The same trend was observed for (R)-[11C]verapamil-based simulations, but differences were in general lower (Fig. 3c, d). The difference between these two simulation studies is due to the difference in cortical uptake of both tracers. For large movements (10 mm or >6°), the IDIF mask is (primarily) positioned within cortical brain regions. For [11C]flumazenil, with high cortical uptake, this results in higher IDIF values (Fig. 3a, b). In contrast, for (R)-[11C]verapamil, with low cortical uptake, only slightly higher IDIF values were found (Fig. 3c, d), except for the largest motion added. Note, however, that movements in other directions may result in different effects.
Effect of Motion-affected IDIF on Tracer Kinetic Analysis
In a previous study, it was shown that motion has major impact on the outcome of tracer kinetic analyses [3]. Those results, however, were obtained using a (simulated) arterial input function derived from arterial sampling (i.e., not affected by motion). In the present study, IDIFs were obtained from motion-affected PET scans. Again, potentially large errors in V T values were seen (Figs. 4 and 5, Table 1).
In practice, patient motion affects the entire scan, i.e., both tissue TACs and the corresponding IDIF. To assess the specific effects of erroneous IDIFs (due to motion), V T images were also generated using motion-affected IDIFs together with original (unmoved) PET images. In general, differences in V T values (Table 2) were comparable to differences in V T values when motion-affected IDIF were used together with the motion-affected PET images (Table 1). Therefore, it can be concluded that differences in V T values are mainly due to the mislocation of the IDIF mask as a result of the motion during the dynamic scan.
In general, small motions of up to 2 mm or 3° had little effect (maximum 5.4%) on V T when only motion-affected IDIFs were taken into account. In fact, overall effects on V T were even larger than in previous report, where only tissue data were affected by motion [3]. However, as mentioned before, IDIFs are extracted from the carotid artery up to at most the base of skull. This region might be less affected by motion because the neck seems to be less mobile than the head. Therefore, the results in this paper likely overestimate the effects of motion on pharmacokinetic outcome. In general, it is always recommended to make sure that patient motion is minimal (e.g., by using a head restraint) and, if necessary, to quantify the amount of motion and correct dynamic PET data for patient motion, either using an online optical tracking system [10, 14] or using an offline frame-by-frame motion correction method [3].
Tracer Kinetic Analysis After Motion Correction
Motion correction improved the accuracy of tracer kinetic analysis for both simulation studies. However, there were some differences in outcome of the motion correction between the two simulation studies. For [11C]flumazenil only very small differences in V T values were found (Table 3), indicating that motion correction was very accurate. On the other hand, much larger differences in V T values were found after correcting the (R)-[11C]verapamil scans for motion. In general, for (R)-[11C]verapamil, motion correction improved outcome in tracer kinetic analysis, except for the smallest rotational movement (1° and 3°). The difference in performance of the motion correction method may be explained by the difference in uptake between both tracers. (R)-[11C]verapamil is a low cortical tracer, and therefore those scans have much less contrast, which makes it more difficult for the motion correction method to find the optimal match. [11C]flumazenil is a high cortical tracer and therefore co-registration might be more precise. Nevertheless, it is shown that motion correction already improved accuracy of tracer kinetic analysis for both tracers studied.
Additional Remarks
In this simulation study, it was assumed that there was no patient motion in the first 10 min of the scan and motion was superimposed only on the final part of the scan (10–60 min). Although this is by far the most frequently observed motion in clinical practice, patient motion during the early frames of a dynamic PET scan can occur. It is likely that motion during these early frames, where the IDIF mask is defined, will have an even larger impact on outcome of tracer kinetic analyses. It is therefore recommended to always check for any motion (e.g., by making movies [3]) and to perform a quality check on the derived IDIFs (e.g., by calculating the peak-to-tail ratio as described previously [6]).
In the present study, IDIFs were extracted from simulated standard OSEM reconstructed images. To obtain accurate IDIFs from clinical studies, it usually necessary to correct scans for partial volume effects, e.g., by using a reconstruction-based partial volume correction (PVC) method [6, 7]. Although more accurate IDIFs are obtained from PVC scans, they also are more affected by motion. This is due to the fact that the carotid arteries are spatially more confined than in standard reconstructed images. The carotid artery is therefore more easily positioned outside the IDIF mask. Partial volume effects are especially important in early frames, which are associated with large differences in activity concentrations between blood and soft tissue. However, for later frames, activity concentrations of blood and soft tissue are more comparable and therefore effects of PVC will be much lower than for early frames. In the present study, motion was applied only to the last six frames and therefore additional effects of PVC were low. However, these effects may be much higher when motion is present in the early frames. Yet, this paper already shows that motion can severely affect the quantitative accuracy of IDIFs.
Image noise may affect the accuracy of IDIFs and may therefore have a negative effect on the outcome of tracer kinetic analysis. In the present study, no noise was simulated because the aim was to quantify the net effects of motion on extracting IDIFs and the resulting effects on subsequent tracer kinetic analysis. Noise in IDIFs may result in an additional reduction in accuracy of tracer kinetic analysis, but this will also be the case if no motion is present. Therefore, further studies are needed to assess the differential effects of noise.
In the present study, both whole brain and the neck were rotated. In clinical practice, the neck is supported and therefore it will be less affected by rotational motion than the brain. Consequently, errors in V T due to rotational motion (e.g. 6°) were for this study somewhat larger (11.9 ± 5.3%) than for a previous study (6.7 ± 5.3%) where the effect of motion on determining radioactivity concentrations in the tissue of interest was taken into account, as arterial sampling was used to obtain the plasma input curve [3]. For translational motion (e.g. 4 mm), errors in V T due to motion artefacts in tissue TAC were 2.9 ± 2.5% as shown in a previous study [3] and 8.3 ± 3.7% due to motion artefacts in IDIFs as shown in this study.
The present study was performed using tracers with high ([11C]flumazenil) and low ((R)-[11C]verapamil) cortical uptake, thereby representing tracers having substantial different kinetics. Therefore, to some extent, results may be applicable to other tracers, but it should be validated for each tracer independently.
Conclusion
Extraction of IDIFs from motion-affected dynamic emission scans led to over- or underestimation of V T values even in the case of small patient motion (5 mm or 6°). Therefore, when IDIFs are used, it is essential to ensure that patient motion is minimal and that dynamic PET data are corrected for patient motion.
Acknowledgments
This work was financially supported by the Netherlands Organisation for Scientific Research (NWO, VIDI Grant 016.066.309). The authors would like to thank Floris H.P. van Velden for his useful comments and suggestions.
Open Access
This article is distributed under the terms of the Creative Commons Attribution Noncommercial License which permits any noncommercial use, distribution, and reproduction in any medium, provided the original author(s) and source are credited.
Contributor Information
Jurgen E. M. Mourik, Phone: +31-20-4441729, FAX: +31-20-4443090
Ronald Boellaard, Email: r.boellaard@vumc.nl.
References
- 1.Lammertsma AA, Hume SP. Simplified reference tissue model for PET receptor studies. Neuroimage. 1996;4:153–158. doi: 10.1006/nimg.1996.0066. [DOI] [PubMed] [Google Scholar]
- 2.Lammertsma AA, Bench CJ, Hume SP, Osman S, Gunn K, Brooks DJ, Frackowiak RS. Comparison of methods for analysis of clinical [11C]raclopride studies. J Cereb Blood Flow Metab. 1996;16:42–52. doi: 10.1097/00004647-199601000-00005. [DOI] [PubMed] [Google Scholar]
- 3.Mourik JEM, Lubberink M, van Velden FHP, Lammertsma AA, Boellaard R (2009) Off-line motion correction methods for multi-frame PET data. Eur J Nucl Med Mol Imaging. doi:10.1007/s00259-009-1193-y [DOI] [PMC free article] [PubMed]
- 4.Hall R. Vascular injuries resulting from arterial puncture of catheterization. Br J Surg. 1971;58:513–516. doi: 10.1002/bjs.1800580711. [DOI] [PubMed] [Google Scholar]
- 5.Machleder HI, Sweeney JP, Barker WF. Pulseless arm after brachial-artery catheterisation. Lancet. 1972;1:407–409. doi: 10.1016/S0140-6736(72)90856-2. [DOI] [PubMed] [Google Scholar]
- 6.Mourik JEM, Lubberink M, Klumpers UMH, Lammertsma AA, Boellaard R. Partial volume corrected image-derived input functions for dynamic brain studies: methodology and validation for [11C]flumazenil. Neuroimage. 2008;39:1041–1050. doi: 10.1016/j.neuroimage.2007.10.022. [DOI] [PubMed] [Google Scholar]
- 7.Mourik JEM, Lubberink M, Schuitemaker A, Tolboom N, van Berckel BN, Lammertsma AA, Boellaard R. Image-derived input functions for PET brain studies. Eur J Nucl Med Mol Imaging. 2009;36:463–471. doi: 10.1007/s00259-008-0986-8. [DOI] [PubMed] [Google Scholar]
- 8.Mourik JEM, van Velden FHP, Lubberink M, Kloet RW, Berckel BNM, Lammertsma AA, Boellaard R. Image-derived input functions for dynamic High Resolution Research Tomograph PET brain studies. Neuroimage. 2008;43:676–686. doi: 10.1016/j.neuroimage.2008.07.035. [DOI] [PubMed] [Google Scholar]
- 9.Rahmim A, Dinelle K, Lidstone SC, Cheng JC, Topping H, Vajihollahi H, Wong DF, Sossi V (2007) Impact of accurate motion-corrected statistical reconstruction on dynamic PET kinetic parameter estimation. IEEE Nucl Sc Symp Conf Rec 2697–2704
- 10.Bloomfield PM, Spinks TJ, Reed J, Schnorr L, Westrip AM, Livieratos L, Fulton R, Jones T. The design implementation of a motion correction scheme for neurological PET. Phys Med Biol. 2003;48:959–978. doi: 10.1088/0031-9155/48/8/301. [DOI] [PubMed] [Google Scholar]
- 11.Green MV, Seidel J, Stein SD, Tedder TE, Kempner KM, Kertzman C, Zeffiro TA. Head movement in normal subjects during simulated PET brain imaging with and without head restraint. J Nucl Med. 1994;35:1538–1546. [PubMed] [Google Scholar]
- 12.Logan J. Graphical analysis of PET data applied to reversible and irreversible tracers. Nucl Med Biol. 2000;27:661–670. doi: 10.1016/S0969-8051(00)00137-2. [DOI] [PubMed] [Google Scholar]
- 13.Woods RP, Cherry SR, Mazziotta JC. Rapid automated algorithm for aligning and reslicing PET images. J Comput Assist Tomogr. 1992;16:620–633. doi: 10.1097/00004728-199207000-00024. [DOI] [PubMed] [Google Scholar]
- 14.Goldstein SR, Daube-Witherspoon ME, Green MV, Eidsath A. A head motion measurement system suitable for emission computed tomography. IEEE Trans Med Imaging. 1997;16:17–27. doi: 10.1109/42.552052. [DOI] [PubMed] [Google Scholar]


