Abstract
Classification of a given observation to one of three classes is an important task in many decision processes or pattern recognition applications. A general analysis of the performance of three-class classifiers results in a complex six-dimensional (6D) receiver operating characteristic (ROC) space, for which no simple analytical tool exists at present. We investigate the performance of an ideal observer under a specific set of assumptions that reduces the 6D ROC space to 3D by constraining the utilities of some of the decisions in the classification task. These assumptions lead to a 3D ROC space in which the true-positive fraction (TPF) can be expressed in terms of the two types of false-positive fractions (FPFs). We demonstrate that the TPF is uniquely determined by, and therefore is a function of, the two FPFs. The domain of this function is shown to be related to the decision boundaries in the likelihood ratio plane. Based on these properties of the 3D ROC space, we can define a summary measure, referred to as the normalized volume under the surface (NVUS), that is analogous to the area under the ROC curve (AUC) for a two-class classifier. We further investigate the properties of the 3D ROC surface and the NVUS for the ideal observer under the condition that the three class distributions are multivariate normal with equal covariance matrices. The probability density functions (pdfs) of the decision variables are shown to follow a bivariate log-normal distribution. By considering these pdfs, we express the TPF in terms of the FPFs, and integrate the TPF over its domain numerically to obtain the NVUS. In addition, we performed a Monte Carlo simulation study, in which the 3D ROC surface was generated by empirical “optimal” classification of case samples in the multi-dimensional feature space following the assumed distributions, to obtain an independent estimate of NVUS. The NVUS value obtained by using the analytical pdfs was found to be in good agreement with that obtained from the Monte Carlo simulation study. We also found that, under all conditions studied, the NVUS increased when the difficulty of the classification task was reduced by changing the parameters of the class distributions, thereby exhibiting the properties of a performance metric in analogous to AUC. Our results indicate that, under the conditions that lead to our 3D ROC analysis, the performance of a 3-class classifier may be analyzed by considering the ROC surface, and its accuracy characterized by the NVUS.
Index Terms: 3-class classification, ROC analysis, performance index, ideal observer
I. INTRODUCTION
Receiver operating characteristic (ROC) analysis has been a very important tool for the assessment of classification problems in which the ground truth is a binary reference standard (for example, presence or absence of disease), i.e., two-class classification problems. Many problems in pattern recognition involve multi-class classification, where the task can be defined as assigning a given observation vector to one of several classes. Some practical applications in the medical field in recent literature include: (1) diagnosis of oral cancer as high-grade squamous cell carcinoma, low-grade squamous cell carcinoma, leukoplakia, and normal squamous tissue [1]; (2) classification of the voxels in knee MRI volumes as tibial cartilage, femoral cartilage or the background [2]; (3) classification of ECG signals as normal, ventricular premature and supraventricular premature beats [3]; and (4) classification of pigmented skin lesions as benign, dysplastic nevi, or cutaneous melanoma [4]. In all of the applications above, the task of the designed classifier is to solve the multi-class discrimination task, as opposed to solving a number of binary decision tasks. In three of them, the percentage correct classification was used as the performance metric. From ROC analysis, it is known that the percentage correct classification is an incomplete, and sometimes misleading measure. This motivates us to investigate the performance limits for an ideal observer model for three-class classification, and whether a summary measure, analogous to the area under the ROC curve (AUC) in two-class problems can be defined for the three-class task.
The interest on three-class (or, more generally, multi-class) classification has prompted many researchers to investigate how ROC analysis can be generalized to multi-class problems [5–13]. Some of these investigations [7, 9–13] studied the three-class ROC problem when the decision variables are related to two likelihood ratios generated by the ideal observer, (see (3) below), while others studied the problem for one or two decision variables that may not necessarily represent the optimal decision variables [5, 6, 8]. Several of these studies involved assumptions that resulted in simplified ROC surfaces [5–8, 12, 13], while others investigated the ideal-observer performace in a general 6D ROC space [9–11]. We are interested in the application of three-class classifiers to computer-aided diagnosis (CAD), where many problems involve three possible outcomes. Examples include the classification of a region of interest (ROI) as malignant, normal, or benign in the problem of mammographic lesion detection/characterization, and the classification of a detected mass ROI as a spiculated malignant, non-spiculated malignant, or benign mass in the problem of mammographic lesion characterization.
In this study, we investigate the three-class ROC problem based on the decision variables used by the ideal observer. We reduce the 6D ROC space generated by these decision variables to 3D by constraining the utilities of some of the decisions in the classification task. This approach was previously taken by our research group [7, 12], as well as recently by others [13]. The difference between our approach and that of He et al. is that we chose constraints such that the 3D ROC analysis can be performed in terms of the trade-off between the true-positive fraction (TPF) and two false-positive fractions (FPFs), and therefore is analogous to the two-class ROC curve. The specific set of assumptions imposed by He et al. [13] results in a three-class ROC surface in which the axes are the correct decision fractions for the three classes. The area under the ROC curve plays an important role in the evaluation of two-class classifiers. In analogy, we propose a normalized volume under the ROC surface (NVUS) as a figure of merit (FOM) for 3-class classification under our utility constraints. We investigate the properties of the 3D ROC surface and the properties of the NVUS, and present simulation results under the equal covariance Gaussian assumption for the three classes.
II. METHODS
A. 3D ROC surface
In a two-class medical diagnosis task, the ROC curve is defined as the locus of TPF and FPF decision pairs, which represents the tradeoff between the sensitivity and specificity. For a three-class problem, a similar analysis of the tradeoff among different correct and incorrect decisions results in a 5-dimensional ROC hypersurface in a 6-dimensional probability space. A complete characterization of the ROC hypersurface even for simple class distributions is an important but difficult task because of the high dimensionality of the probability space. An avenue that might lead to a practical analysis method, as well as shed light on the general 3-class classification task, is to make simplifying assumptions that focus on a certain useful subclass while still preserving the nature of the problem. A specific problem of interest in the computer-aided diagnosis (CAD) community is that of classifying a case (or an ROI) as malignant, benign, and normal. In this study, we make simplifying assumptions that may result in a practical ROC analysis for the type of problems that satisfy the assumptions, explore the properties of the resulting ROC hypersurface, and define an FOM based on the ROC hypersurface that may be useful for summarizing the classification performance.
In a three-class classification problem, the task is to assign a given D-dimensional observation vector w⃗, to one of three classes. In this study, motivated by the classification of cases as malignant, benign, and normal, these classes are denoted by πM, πB, and πN, respectively. Since there are three possibilities of true class membership, denoted by tM, tB, and tN, and three possibilities of class assignment for the observation, denoted by dM, dB, and dN, there are a total of nine distinct true membership-assignment pairs. When w⃗ is a random vector, the class assignment d is a random variable, that can take three distinct values, d = dM, d = dB, or d = dN (random variables are denoted by boldface letters). The probability of d = di given tj, i.e., the probability of deciding that the observation belongs to class πi when the true class membership is πj, is denoted by Pi ≡ Pj(d = id | tj), where i ∈ {M, B, N} and j ∈ {M, B, N} Since the sum of these probabilities add to unity for each true class (PMj + PBj + PNj = 1 for j ∈ {M, B, N}), the probability space in a three-class problem is six-dimensional.
In a Bayes’ test, one assigns a utility to each of these nine true membership-assignment pairs. Each decision made for a random vector w⃗ is therefore associated with a utility. The Bayes’ test is designed so that, on the average, the utility is as large as possible, i.e., the expected value of the utility is maximized. Let Uij (i ∈ {M, B, N}, j ∈ {M, B, N}), denote the utility of di given tj, i.e., the utility of deciding that the observation belongs to class πi when the true class membership is πj. If the random vector w⃗ belongs to class πj, the expected utility conditioned on its class membership is
| (1) |
The expected utility of the decision rule is then given by averaging over all classes πj
| (2) |
where P(πj) is the a-priori probability of class πj.
Let pw⃗ (w⃗) denote the probability density function (pdf) of the random vector w⃗, and pw⃗|πj (w⃗ | πj) denote the conditional pdf of w⃗ given class πj. Defining
| (3) |
one can show that the application of the Bayes’ test leads to the following decision rules [10, 14]:
- Assign d = dM if and only if
(4) (5) - Assign d = dB if and only if (4) is not satisfied, and
(6)
Assign d = dN if and only if after performing the tests in (4)–(6), neither d = dM nor d = dB is assigned.
Equations (4)–(6) define the decision boundary lines in the likelihood-ratio plane, defined by ΛBM (w⃗) and ΛNM (w⃗) as the abscissa and ordinate, respectively. These three lines intersect at one point [14], and partition the decision plane (the likelihood-ratio plane) into three distinct decision regions. The relationship among these decision boundary lines has recently been investigated by Edwards et al. [10].
In a 2-class problem, the ROC curve for the ideal observer can be considered as the relationship between the sensitivity and (1-specificity) as the threshold of the likelihood ratio varies, i.e., as the likelihood ratio line is partitioned into two regions. The ROC hypersurface for a 3-class problem can similarly be considered as the relationship among various decision probabilities as the partitioning of the decision plane, defined by (4)–(6), varies. An independent set of three equations can be characterized by three slopes and three intercepts. However, since the decision boundary lines are not independent, but intersect at one point, one degree of freedom is lost, resulting in a five dimensional ROC hypersurface in a six-dimensional probability space.
In this study, we reduce the dimensionality of the ROC hypersurface by imposing constraints on (4)–(6). For the purpose of normalization, we assume that 0 ≤ Uij ≤ 1. The utility of a correct decision is assumed to be at a maximum of 1, thus UMM = 1, UBB = 1, and UNN = 1. If a malignant case is misdiagnosed as normal or benign, the utilities will be at a minimum of 0, thus UBM = 0, and UNM = 0. If a normal case is called benign or vice versa, it may not be very harmful or costly, so that the utilities are still high with UBN = 1 and UNB = 1. The utilities of misdiagnosing benign or normal to be malignant, UMB and UMN, depend on the further course of action, and will be variable between 0 and 1. Under these conditions, we note that (4) and (5) coincide, and can be written as:
| (7) |
while all coefficients in (6) equal zero and it becomes indeterminate. For the assumed values of the utilities, the classification problem reduces to deciding whether the observation belongs to πM or not, i.e., assign w⃗ to class M if and only if (7) holds. However, since UMB and UMN are variable, and are not necessarily equal, there is still a distinction between the benign and normal classes, and the problem is still a three-class classification task.
With these assumptions, the expected utility in (2) becomes a function of only three of the Pij's, namely, PMM (probability of correctly deciding that the observation is malignant) PMB (probability of falsely deciding that the observation is malignant when the observation belongs to the benign class), and PMN (probability of falsely deciding that the observation is malignant when the observation belongs to the normal class). One can thus analyze how the TPF (PMM) varies as a function of the two FPFs (PMB and PMN). To differentiate the resulting surface in 3D space from both the ROC curve for a 2-class problem (2D ROC curve) and from the general ROC hypersurface for a 3-class problem, we refer to it as the “3D ROC surface”. Note that, similar to a 2D ROC curve, our 3D ROC surface describes the variation of the TPF as a function of the FPFs, and results from the simplification of the general ROC hypersurface into 3D because of the assumptions made for the utilities.
We note that the assumptions for the utilities described above are only a special case of the choices for the utilities that will degenerate the three decision lines into a single line. Specifically, if
| (8) |
then (4) and (5) coincide, and (6) becomes undefined. These assumptions are summarized in Table 1, and imply that (i) the utility of classifying a malignant tumor as benign is the same as that of classifying it as normal, (ii) the utility of classifying a benign lesion as normal is the same as that of classifying it correctly, and (iii) the utility of classifying a normal region as a benign lesion is the same as that of classifying it correctly. In this case, the expected utility in (2) can be written as a function of PMM (sensitivity), PMB and PMN (two kinds of FPFs):
| (9) |
Table I.
The conditions for the utilities that will degenerate the three decision lines into a single line. For a problem such as classification of a case as malignant, benign and normal, the utilities may be chosen as υ0=υ2=υ3=1 and υ1=0.
| True class membership | M | B | N |
|---|---|---|---|
| Assigned class membership | |||
| M | υ0 | UMB | UMN |
| B | υ1 | υ2 | υ3 |
| N | υ1 | υ2 | υ3 |
B. The likelihood-ratio plane
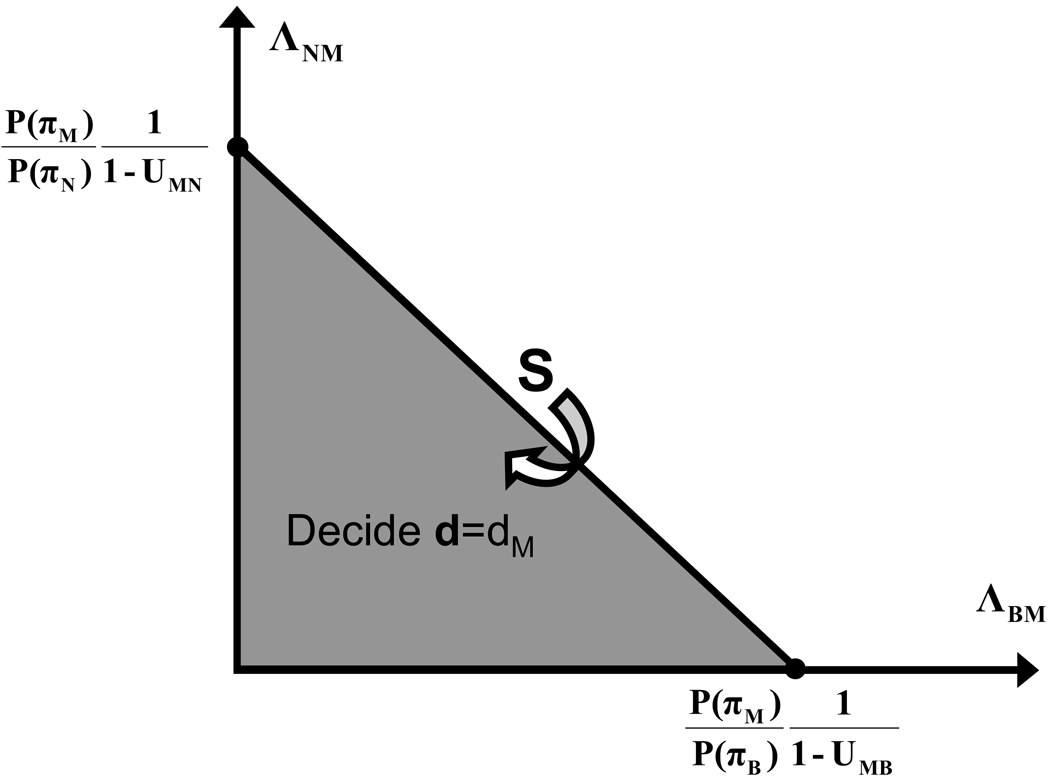
Figure 1 describes the decision line provided by (7) in the likelihood ratio plane, where the abscissa and ordinate are ΛBM and ΛNM, respectively. The equation for the decision line can be expressed as
| (10) |
where m and n are the slope and intercept of the line, respectively
| (11) |
and
| (12) |
Fig. 1.
The likelihood ratio (LR) plane and the decision line.
Since all utilities are by definition less than or equal to unity, we have − ∞ ≤ m ≤ 0, and 0 ≤ n ≤ ∞ as the utilities and the a-priori class probabilities vary.
From Fig. 1, we observe that for a given w⃗ we assign d = dM if the two likelihood ratios are such that the point (ΛBM(w⃗), ΛNM(w⃗)) is within the triangle S, and assign d ≠ dM otherwise. Since the likelihood ratios are functions of the random vector w⃗, ΛBM(w⃗) and ΛNM(w⃗) are random variables, and have a joint pdf under πM, πB, and πN. The TPF and FPFs in which we are interested can be expressed as
| (13) |
| (14) |
| (15) |
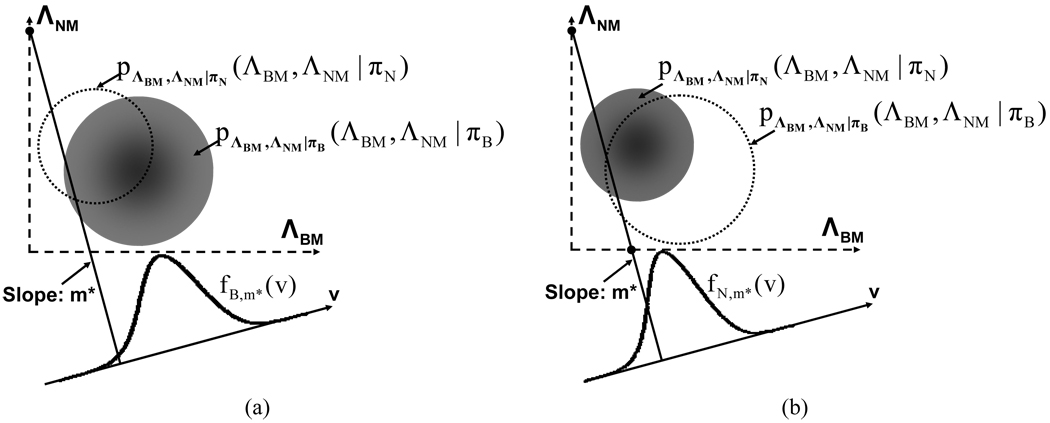
In the ROC plots that we construct, we chose to express the TPF as a function of the two FPFs. To gain insight into the interdependence among these three quantities of interest, we first study how the two FPFs are related. Consider a fixed value of m = m*. By a change of variables ΛBM = u and ΛNM = v + m*u, (14) can be written as
| (16) |
where
| (17) |
Although the new expression for PMB seems more complicated, it has a meaningful interpretation. fB,m* (v) can be interpreted as the integral of pΛBM,ΛNM|πB (ΛBM, ΛNM|πB), i.e., the joint pdf of the likelihood ratios under class B, along a line that is parallel to the ΛNM = m*ΛBM line, and that intersects the ΛNM axis at ΛNM = v (Fig. 2a). PMB is then obtained by integrating fB,m* (v) up to n, similar to the integration one might perform in 2-class ROC analysis to obtain the false-negative fraction. Similarly, we also express PMN as (Fig. 2b)
| (18) |
where
| (19) |
Fig. 2.
(a) The integral of the joint pdf of the likelihood ratios under class B, along lines with slope m*. The resulting integral is a 1-D function, and is denoted as fB,m* (v). (b) The integral of the joint pdf of the likelihood ratios under class N, along lines with slope m*. The resulting integral is a 1-D function, and is denoted as fN,m* (v). Note that fB,m* (v) and fN,m* (v) are not Gaussian; in particular, they are zero for v ≤ 0 and u ≤ 0, respectively.
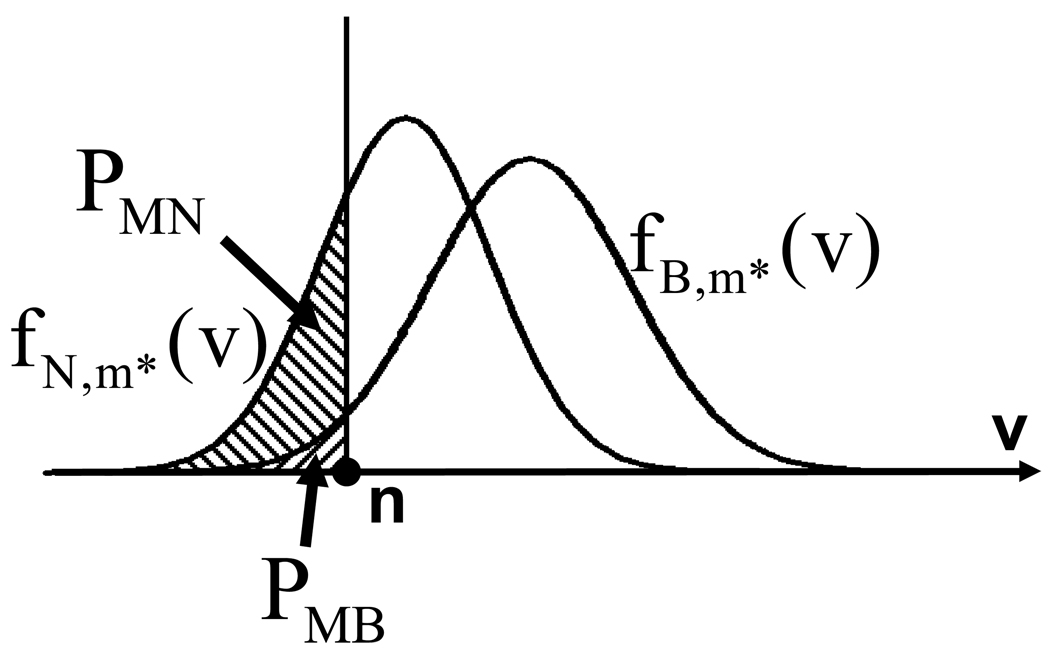
With this interpretation, it can be seen that as n varies while m = m* is kept constant, the relationship between PMB and PMN is similar to an ROC curve (Fig. 3) in the FPF plane, referred to as Cm* below. In particular, we observe that n=0 implies PMB = PMN = 0, and as n → ∞, PMB = PMN = 1.
Fig. 3.
The interpretation of PMN and PMB in terms of the areas under fB,m* (v) and fN,m* (v) below a threshold n. This interpretation is similar to that for true-negative and false-negative fractions in a 2-class classification problem.
C. Properties of the ROC surface
In this subsection, we explore two properties of the ROC surface of the ideal observer obtained under the constraints given by (8). Specifically, we show that for a given FPF pair (PMB, PMN), multiple values for sensitivity (PMM) cannot exist. In other words, PMM is a function of PMB and PMN. We also determine the domain of this function. These properties are used in Section III to numerically evaluate the 3D ROC surface.
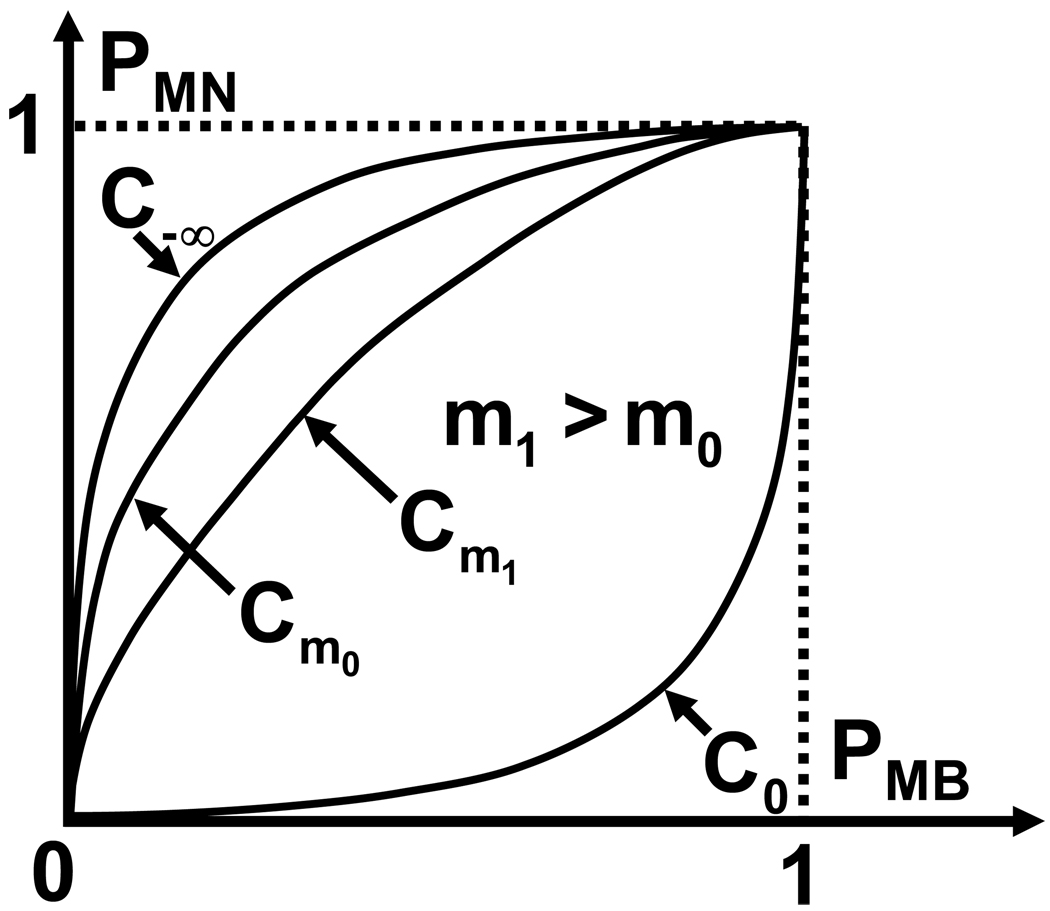
Property 1: Let PMB (m0, n0) = PMB (m1, n1) and m1 ≥ m0. Then PMN (m0, n0) ≥ PMN (m1, n1).
This property is proven in Appendix 1. The relative locations of the curves Cm0 and Cm1 as a result of Property 1 are shown in Fig. 4. Let us define C0 (PMB) as the loci of PMN as PMB is varied for m = 0, and C−∞ (PMB) as the loci of PMN as PMB is varied for m = −∞. Since − ∞ ≤ m ≤ 0, it can be concluded that the loci of PMN in the FPF plane is bounded from above by the curve C−∞ (PMB) and below by the curve C0 (PMB).
Fig. 4.
The curve Cmi plots the relationship between PMB and PMN in the FPF plane for m = mi. Four such curves are plotted: C−∞, Cm0, Cm1, and C0. The domain of the ROC surface is defined by the curves C−∞ and C0. The figure shows that when m1 > m0, the curve Cm1 is below the curve Cm0.
Property 2: If the pairs (m0, n0) and (m1, n1) are such that PMB (m0, n0) = PMB (m1, n1) and PMN (m0, n0) = PMN (m1, n1), then PMM (m0, n0) = PMM (m1, n1).
Proof: The proof of this claim is similar to that of Property 1, and is provided in Appendix 2. Property 2 asserts that PMM can be expressed as a function of PMB and PMN, although it may be difficult to express the functional form φ(PMB, PMN) ≡ PMM explicitly for given distributions of the malignant, normal, and benign classes.
Property 3: When PMB is held constant, PMM is a non-decreasing function of PMN. Similarly, when PMN is held constant, PMM is a non-decreasing function of PMB.
Proof: Please refer to Appendix 3.
D. Normalized volume under the surface
For a two-class classification task, the AUC is a commonly used FOM to measure the classification accuracy. AUC can be interpreted as the sensitivity averaged over all possible values of specificities. As described above, in a three-class classification task with the utilities assumed to be those in (8), the sensitivity can be expressed as a function of the two FPFs. It is then natural to define an FOM for a three-class classification task as a function of the average sensitivity over all possible values FPF pairs. The height of the surface PMM = φ(PMB, PMN) is the sensitivity at a given value of the FPF pair (PMB, PMN). As described above, in general, the FPF pair (PMB, PMN) does not take all possible values in the square [0, 1] × [0, 1]. The total volume Vtotal under the surface PMM therefore does not provide the average sensitivity over all possible values of FPF pairs. The domain (PMB, PMN) is bounded by the curves C−∞ and C0 in the FPF plane as shown in Fig. 4, and the average sensitivity over all possible values of FPF pairs is the volume under the surface PMM, normalized by the area AFPF bounded by the curves C−∞ and C0. The normalized volume under the surface (NVUS) is thus defined as
| (20) |
The need for normalization may also be deduced by noting that AFPF is related to the separation between classes B and N. If the distributions of these two classes are similar, then the FPF values PMB and PMN will also be similar, regardless of how the decision line is selected. Therefore, both AFPF and the spread of the surface PMM = φ(PMB, PMN) will be small. On the other hand, relatively dissimilar distributions of the classes B and N will result in a larger value of AFPF and a larger spread of the surface, which will lead to a larger volume under the surface, provided that the separation between classes M and B and between classes M and N remain constant. However, as seen from (9), the separation between classes B and N has no impact on the expected utility, and therefore the effect of the AFPF on Vtotal needs to be removed by normalization.
Gaussian distributions
In the development of parametric ROC analysis for a two-class problem, a frequently made assumption is that the classifier scores (i.e., the decision variable) for the two classes have a binormal distribution. One can then either fit a maximum likelihood curve to the classifier scores [15] or to the likelihood ratio [16]. Although we do not attempt to fit surfaces to our 3D ROC plots in this work, we believe that it is important to examine the shape of the ROC surface and to demonstrate the feasibility of our approach to using NVUS as a performance metric for the important sub-category of Gaussian distributed data. We thus assume that the observation w⃗ is normally distributed under each class, πM, πB, and πN. To facilitate the analysis, we also assume a simple case in which the covariance matrices of the Gaussian distribution under the three classes are equal, and the mean vectors are different. Without loss of generality, one can then diagonalize the covariance matrices, and translate the distributions under the three classes so that the mean for class πA is 0 (Appendix 4). Then, under the equal covariance assumption, one can write
| (21) |
where μ⃗B and μ⃗N are the mean vectors under πB and πN, respectively, and I is the identity matrix. The likelihood ratios are then
| (22) |
| (23) |
Defining
| (24) |
it can be seen that z⃗ is a linear function of w⃗, with
| (25) |
where
| (26) |
and
| (27) |
Therefore, z⃗ is Gaussian under all three classes with covariance matrix
| (28) |
where
| (29) |
Note that σ1 and σ2 are the magnitudes of the vectors μ⃗B and μ⃗N, while r is the cosine of the angle between them. The mean of z⃗ under classes M, B, and N are calculated as
| (30) |
where z̅j (i), i = 1, 2, denotes the ith component of the mean vector of z⃗ under class j, j=M, B, N.
Since Λ⃗ = exp(z⃗), Λ⃗ follows a bivariate log-normal distribution. For given values of m and n (defined by (11) and (12)) the sensitivity and false-positive fractions can then be calculated using (13)–(15). For example,
| (31) |
where
| (32) |
is the joint pdf for the bivariate log-normal random variables ΛBM and ΛNM. The equations for PMB and PMN are similar, with z̅B and z̅N replacing z̅M in (32), respectively:
| (33) |
| (34) |
It is seen that for given m and n, the TPF and the FPFs can be completely described in terms of three parameters, σ1, σ2, and r. Since the 3D ROC surface is obtained by varying m and n over their allowable range (− ∞ ≤ m ≤ 0, and 0 ≤ n ≤ ∞), the 3D ROC surface is a function of only these three parameters.
Under the equal covariance Gaussian assumption, the upper and lower bounds for PMN on the FPF plane (C−∞ (PMB) and C0 (PMB), respectively) can be determined analytically (Appendix 5):
| (35) |
and
| (36) |
where
| (37) |
III. SIMULATION RESULTS
We have performed simulation studies under the equal covariance Gaussian assumption in order to study some properties of the ROC surface and compare the NVUS for different values of the parameters σ1, σ2, and r. We also implemented two different methods to construct the ROC surface, and compared the NVUS values obtained by these two methods.
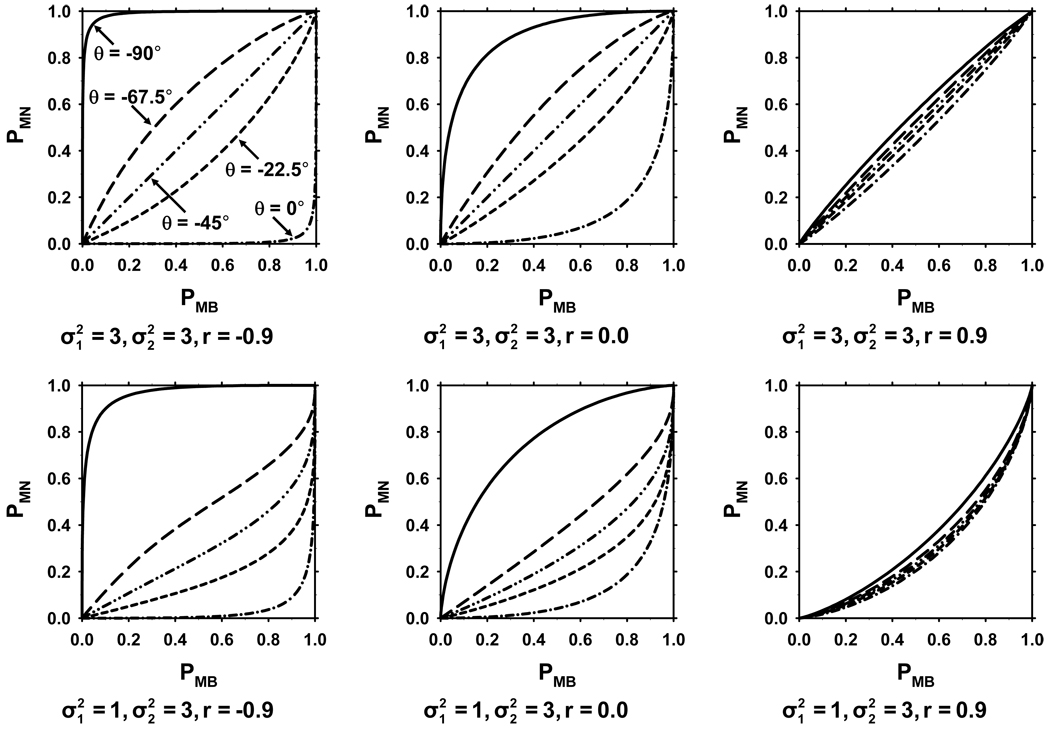
We first investigated the characteristics of the Cm curves, i.e., the relationship between PMB and PMN for a given m. For this purpose, we numerically evaluated (33) and (34) for given n and m values to obtain PMB and PMN, and plotted the relationship between PMB and PMN as n is varied and θ = tan−1 (m) is fixed. The resulting plots for different values of the parameters σ1, σ2, and r are shown in Fig. 5 for θ = −90°, −67.5°, −45°, −22.5°, and 0°. The curves for θ = −90° and 0° (defined as C−∞ (PMB) and C0 (PMB) above) are important because they define the domain of PMM = φ(PMB, PMN). It is seen that this domain can take a number of different convex and non-convex shapes, and the area of the domain increases as r decreases. In the limiting case where μ⃗B and μ⃗N are equal (r=1 and σ1 = σ2), there is no distinction between the classes πB and πN, and the domain of the ROC surface reduces to the diagonal line that passes through (0,0) and (1,1) in the (PMB, PMN) plane and the ROC surface reduces to the 2-class ROC curve.
Fig. 5.
The relationship between PMN and PMB for different values of the slope of the decision line (m) in the likelihood ratio plane. Each graph shows five values for θ = tan−1 (m): θ = −90°, −67.5°, −45°, −22.5°, and 0°. In the top row of graphs, , and in the bottom row of graphs, . The value of r is −0.9, 0, and 0.9 for the graphs on the left, middle, and right, respectively.
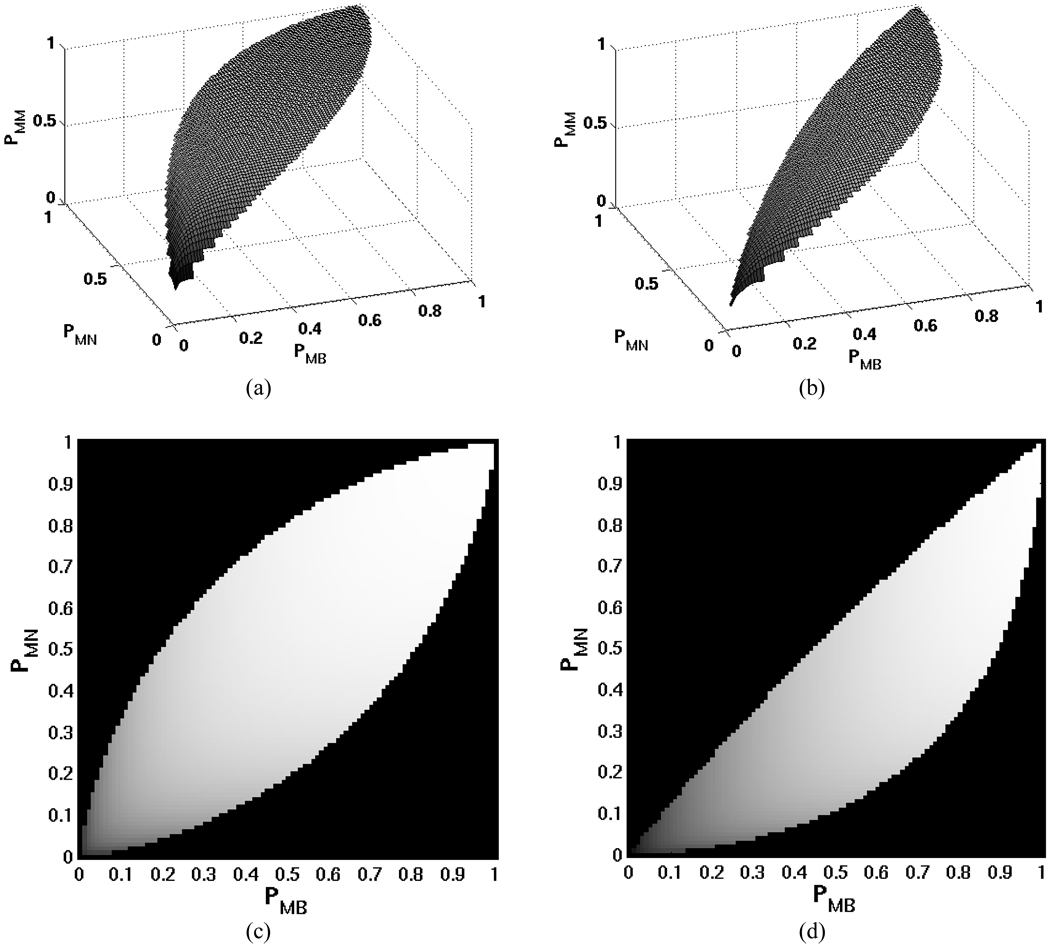
Fig. 6 shows examples of the ROC surfaces obtained for two sets of values for the ROC parameters. In Fig. 6a, r=0.5 and so that the resulting ROC surface is symmetric with respect to the PMB = PMN line. In Fig. 6b, r=0.5, , so that the surface is not symmetric, although the domain is still convex. Figures 6c and 6d show the same surfaces as grayscale images, where the brightness of the pixel is proportional to the value of PMM. From these examples, it is observed that PMM is a non-decreasing function of PMB and PMN, which is a result of Property 3.
Fig. 6.
Examples of 3D ROC surfaces: (a) and (b) are surface representations for Gaussian distributions with r=0.5, , and r=0.5, , respectively. (c) and (d) are grayscale representations of (a) and (b), respectively.
To evaluate the NVUS for different values of the parameters σ1, σ2, and r, we implemented two methods. In Method 1, which uses (31) to (34) for the pdf of Λ⃗ directly, we numerically integrated the volume over the domain of PMM = φ(PMB, PMN). For this purpose, we used recursive adaptive Simpson quadrature [17], in the form that it was implemented in MATLAB for double integration. Adaptive Simpson quadrature attempts to minimize the number of function calculations by using small subdivisions of the interval only where required for the desired tolerance [18]. To perform the integration, one needs to numerically express PMM as a function of PMB and PMN. For a given pair of PMB and PMN, we first numerically solved the non-linear equations (33) and (34) to determine which values of m and n result in the given FPFs. We then substituted these values into (31) and performed numerical integration to obtain PMM. The desired tolerance in the recursive adaptive Simpson quadrature was set as 10−5 for both the integration to find PMM and to find the volume under the surface. The area of the domain of φ(PMB, PMN) was likewise obtained by numerically integrating the area between the curves given by (35) and (36).
In Method 2, we used a Monte-Carlo method to compute the NVUS. For given values of the parameters σ1, σ2, and r, N/3 observations were randomly generated from each of the three classes πM, πB, and πN according to the pdfs given by (21). We then computed the likelihood ratios ΛBM and ΛNM using (22) and (23) for each of the N observations. For a given value of the pair (m,n), the three quantities of interest (PMM, PMB and PMN) can then be determined by how many (ΛBM, ΛNM) pairs from each class fall into the shaded region in Fig. 1. By systematically varying m between 0 and −∞, and n between 0 and ∞, one can generate pairs (PMB, PMN) that cover the region between C−∞ (PMB) and C0 (PMB), and the corresponding values of the sensitivity PMM. To find the volume under the surface and the area of the domain of the 3D ROC surface, we used Delaunay triangulation, as described in Appendix 6. Since our purpose was to compare with Method 1 rather than to evaluate the small-sample dependence of the Monte-Carlo method, we used a large number (N=300,000) for the number of observations, which was experimentally chosen as a trade-off between computational efficiency and the accuracy of the estimated volume. One hundred fifty different values were used for both m and n to generate (PMB, PMN) pairs that cover the domain of the 3D ROC surface.
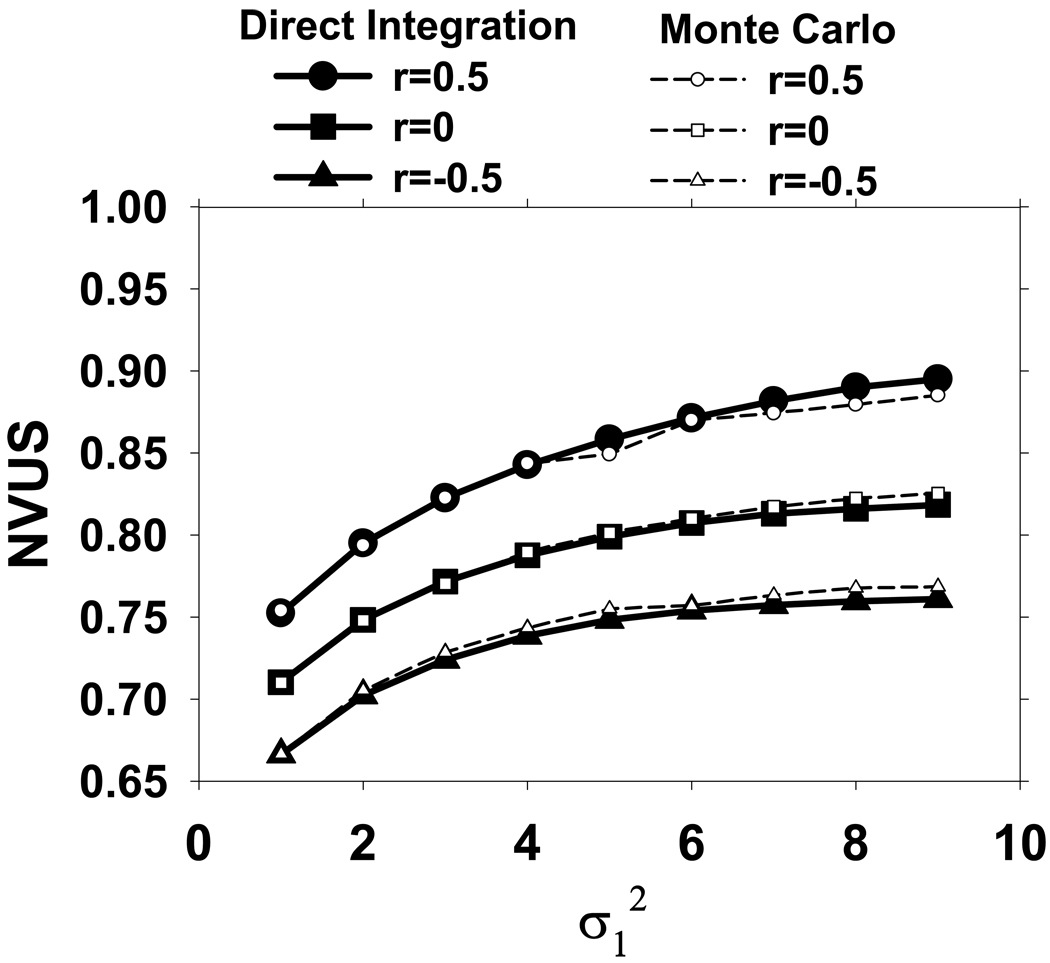
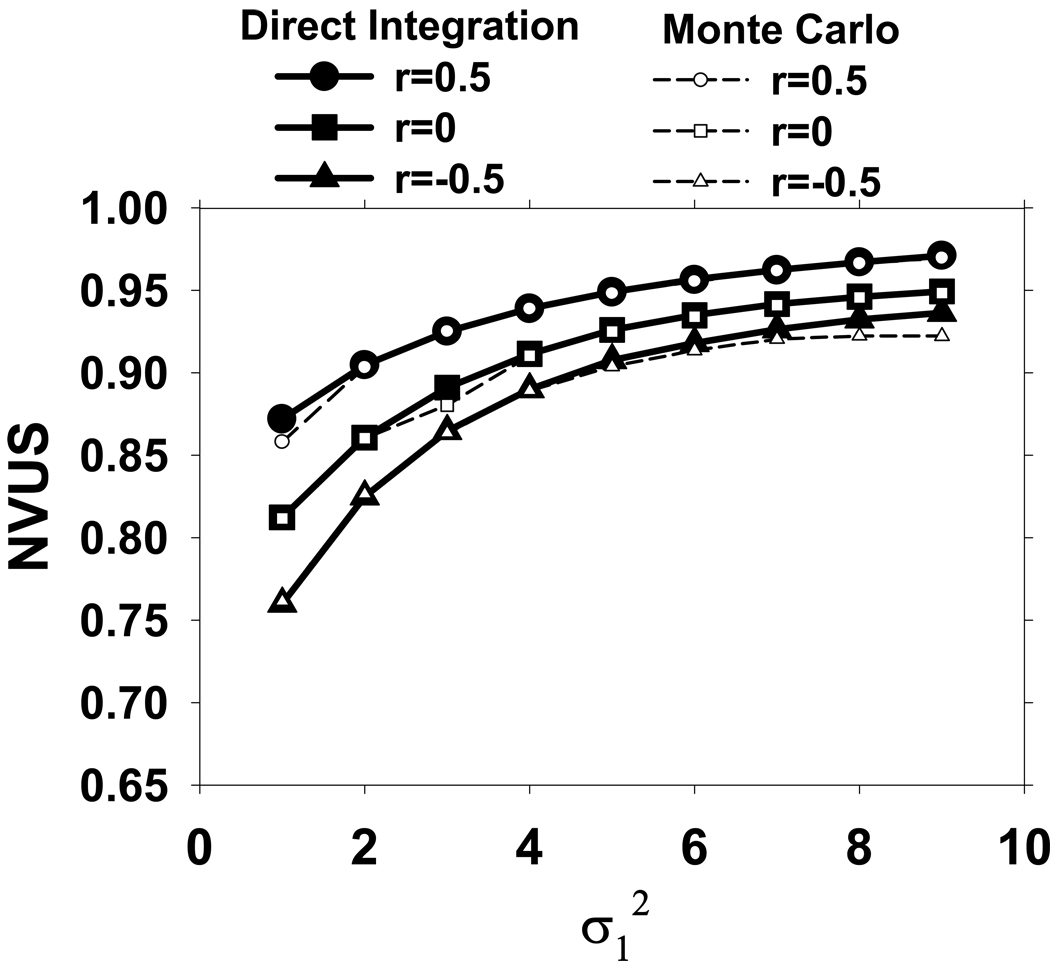
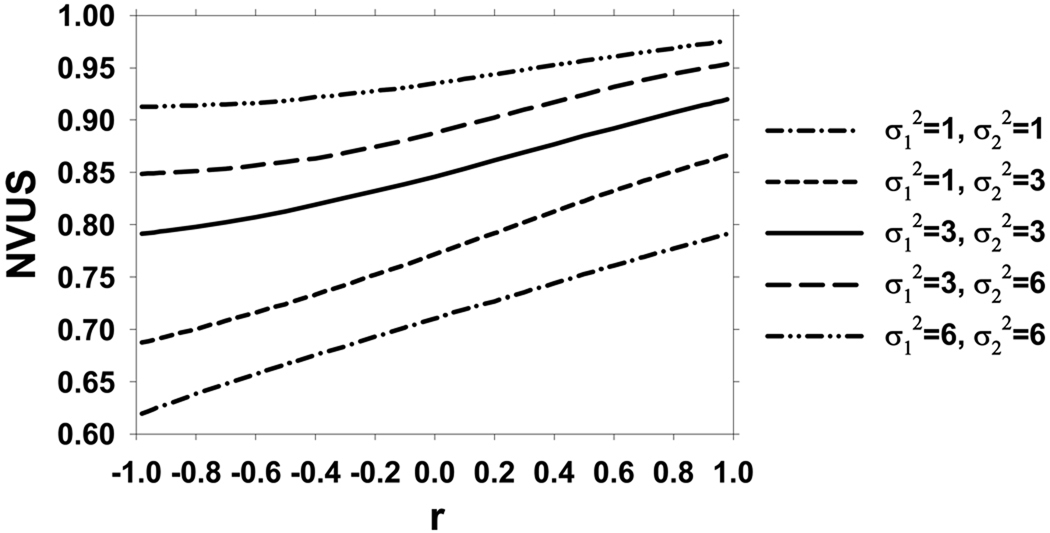
Fig. 7 plots the NVUS results for different values of σ1 when . Three plots are shown for r=−0.5, r=0, and r=0.5, for both Methods 1 and 2. Figure 8 is the same as Fig. 7, except that . Similar trends were observed for other values of between. 1 and 9. Methods 1 and 2 result in very similar NVUS values. For fixed r and σ2, NVUS increases with σ1. Also, comparing Figs. 7 and 8, it is seen that for fixed r and σ1, NVUS increases with σ2. For fixed values of σ1 and σ2, the dependence of NVUS values on r is shown in Fig. 9.
Fig. 7.
Comparison of the NVUS values obtained by the direct integration and Monte-Carlo methods for . The NVUS values are plotted as a function of for three values of r (r=−0.5, 0, and 0.5).
Fig. 8.
Comparison of the NVUS values obtained by the direct integration and Monte-Carlo methods for . The NVUS values are plotted as a function of for three values of r (r=−0.5, 0, and 0.5).
Fig. 9.
NVUS as a function of r for different combinations of values for .
IV. DISCUSSION
From the results presented in Figs. 7–9, it can be observed that the trends for the NVUS are consistent with the characteristics of a proper FOM, namely, as the difficulty of the classification problem decreases, the value of the FOM for the optimal classifier increases. First, NVUS increases with σ1 for fixed r and σ2. From the definitions of these parameters, if σ1 increases while the other parameters are fixed, the difference in the magnitude between the mean vectors of the malignant and benign classes increases. If the malignant and benign classes are farther apart, then the classification problem is easier and the value of the FOM should increase. Similarly, if σ2 increases while the other parameters are fixed, the value of the FOM should increase, which is the trend observed by comparing Figs. 7 and 8. Finally, if r increases while σ1 and σ2 are fixed, the angle between the vectors μ⃗B and μ⃗N decreases, and the normal and benign classes become more similar to each other. Therefore, if all the other parameters are fixed while r increases, the portion of the malignant class that overlaps with the union of the normal and benign class distributions decreases. For large r, if the classifier works well for separating the normal and malignant classes, then it will have a similar performance in separating the benign and malignant classes as well. In contrast, if the angle between the vectors μ⃗B and μ⃗N is large (small r), then the benign and normal classes are quite different, hence a classifier that works well to differentiate the normal and malignant classes may not work well to differentiate the benign and malignant classes. In summary, a larger r increases the separation between the malignant class and the other two classes, while it decreases the separation between the benign and normal classes. Due to our choice of the utilities, the separation between the benign and normal classes has no effect on the expected utility (9), and the value of the NVUS is determined by the separation between the malignant and the other two classes. We therefore expect that the value of the FOM would usually increase with r, as demonstrated by the trend for the NVUS in Fig. 9.
With the utilities given as in (8), the decision boundary between the benign and normal classes is indeterminate. The expected utility in (9) does not contain terms related to the misclassification probabilities PBN and PNB, therefore, the decision between classes B and N does not affect the task performance. However, the expected utility, and thus the task performance, is uniquely determined by PMM, PMB and PMN. Furthermore, since UMB and UMN are not necessarily equal, there is still a distinction between the benign and normal classes, and the problem remains a three-class classification task.
As in 2D ROC analysis, comparison of 3D ROC surfaces and the summary measures for two classification tasks requires caution. Similar to the condition that two 2D ROC curves may intersect, the 3D ROC surfaces for the ideal observer for two classification tasks may also intersect. Under this condition, one does not know whether the sensitivity for the task with the larger NVUS value is higher than that with the smaller NVUS value at all FPF values. An additional need for caution for the comparison of the NVUS values of two 3D ROC surfaces results from the possibility that the FPF domains for the two tasks may be different, as shown in Fig. 5 for six different tasks. Consider two tasks T1 and T2, and assume that the domain of the 3D ROC surface for T1 is larger than and encloses the entire domain for T2. It is conceivable that the sensitivity of the ideal observer may be higher for T1 than T2 at all FPF values in the domain of T2, and despite this, the NVUS value for T1 can be lower if the sensitivity for T1 at FPF values outside the domain of T2 is very low.
In our previous [7, 12] and current studies, our assumptions for the utilities were that UMM = UBB = UNN = UBN = UNB = 1, UBM = UNM = 0, and that UMB and UMN are variable in [0,1]. These assumptions simplify the formulations of the slope and intercept of the decision line, (Fig. 1 and (11) and (12)) and facilitate the subsequent analyses. However, the conditions on the utilities can be more general, namely UBM = UNM, UBB = UNB, and UBN = UNN (8), and the three decision lines of the ideal observer will still degenerate into a single line that separates the malignant class from the other two classes. With the additional assumption that the utility of an incorrect decision is not larger than that of a correct decision (i.e, UBM ≤ UMM, UMB ≤ UBB, and UMN ≤ UNN), the slope and intercept for this line will satisfy −∞ ≤ m ≤ 0 and 0 ≤ n ≤ ∞, respectively. Since the properties of the 3D ROC surface found in this study depend only on the situation of a single decision line separating the malignant class from the other two classes in the likelihood ratio plane, the conclusions of our study is applicable to the more general condition given by (8).
V. CONCLUSION
In this study, we investigated the 3-class classification problem under some simplifying, but realistic, assumptions for the utilities that result in a single decision line in the likelihood ratio plane separating the malignant decisions from “non-malignant” decisions. Under these assumptions (8), we showed that the sensitivity of the ideal observer can be expressed as a function of two false-positive fractions, thereby one can define a 3D ROC surface above the FPF plane, and that the domain of the ROC surface in the FPF plane depends on the class distributions. We extended the definition of the area under the ROC curve for a two-class problem to a normalized volume under the ROC surface for a three-class problem, where the normalization is required because of the dependence of the domain of the 3D ROC surface on the classification task.
We studied the properties of the 3D ROC surface and the NVUS for the ideal observer under the condition that the three-class distributions in the feature space are multivariate normal with equal covariance matrices. Under this assumption for class distributions, it can be shown that the probability density functions of the likelihood ratios follow a bivariate log-normal distribution, and that they depend only on three parameters. We investigated two methods for calculating the NVUS, and found that the results were in good agreement. We also found that the NVUS satisfies some of the intuitive properties of a proper FOM for characterizing the classification performance. Although the analysis in this study was performed under simplifying assumptions, we expect that it will provide guidance for the challenging problem of designing performance metric and analysis for 3-class classification tasks.
Acknowledgments
This work was supported in part by USPHS grant CA95153 and U. S. Army Medical Research and Materiel Command grant DAMD17-02-1-0214.
APPENDIX 1
We first show that
| (A.1) |
and
| (A.2) |
Let ΛBM = f1 (w⃗), ΛNM = f2 (w⃗), and let Ω(m, n) denote the set of vectors w⃗ that satisfy f2(w⃗) − mf1 (w⃗) − n < 0. Noting that pw⃗|πB (w⃗ | πB) = ΛBM (w⃗)pw⃗|πM, the false positive probability for the benign class can be written as the D-dimensional integral
| (A.3) |
The integrand in (A.3) can be integrated by first finding the set of all vectors w⃗ in the D-dimensional observation space such that
| (A.4) |
The sum of all pw⃗|πM (w⃗ | πM) such that (A.4) is satisfied is (by definition) pΛBM,ΛNM|πM (ΛBM, ΛNM | πM)ΔΛBMΔΛNM, while w⃗ ∈ Ω(m, n) is equivalent to ΛNM − mΛBM − n < 0. Integrating over the entire D-dimensional observation space, we find that
| (A.5) |
Eq. (A.2) can be obtained in a similar manner.
We now show if PMB (m0, n0) = PMB (m1, n1) and m1 ≥ m0, then PMN (m0, n0) ≥ PMN (m1, n1).
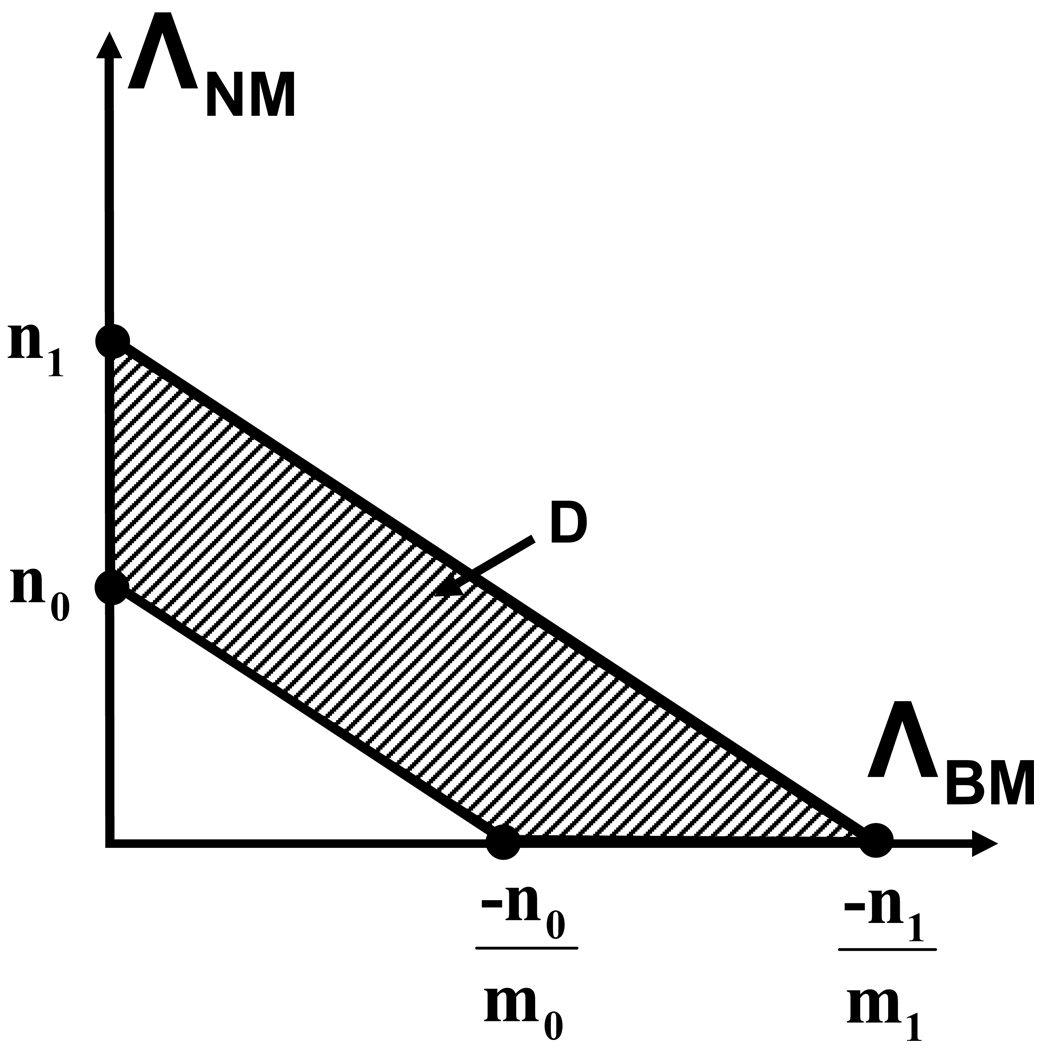
For notational simplicity, let us define x = ΛBM, y = ΛNM, and f(x, y) = pΛBM,ΛNM|πM (ΛBM, ΛNM | πM). First consider Case (A), in which the two lines y = m0x + n0 and y = m1x + n1 (i.e., the lines ΛNM = m0ΛBM + n0 and ΛNM = m1ΛBM + n1) do not intersect in the positive quadrant (Fig. A1). Using (A.1), and noting that f(x, y) is non-negative, PMB (m0, n0) = PMB (m1, n1) implies f(x, y) = 0 in the region D shown in Fig. A1. Using (A.2), this implies PMN (m0, n0) = PMN (m1, n1).
Fig. A1.
Case (A) for Property 1: The lines ΛNM = m0ΛBM + n0 and ΛNM = m1ΛBM + n1 do not intersect in the positive quadrant. The difference between PMB (m0, n0) and PMB (m1, n1) is the integral of the joint pdf of the likelihood ratios under class B in the shaded region D.
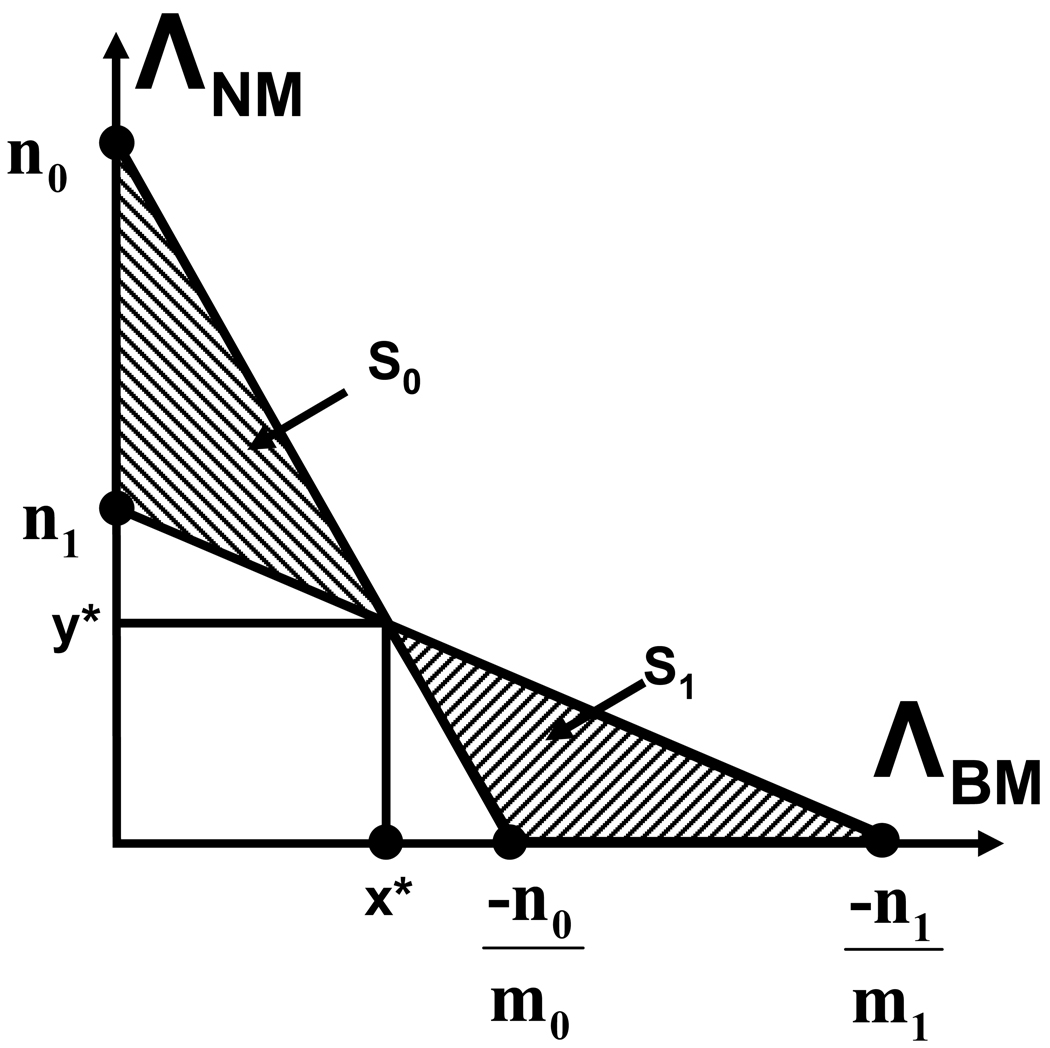
We now consider Case (B), in which the two lines y = m0x + n0 and y = m1x + n1 intersect at a point (x*, y*) in the positive quadrant (Fig. A2). Using (A.1), it is seen that
| (A.6) |
where the two regions S0 and S1 are the two shaded triangles in Fig. A2. For any x in S0, we have x* ≥ x, and for any x in S1, we have x ≥ x*. Therefore,
| (A.7) |
which indicates
| (A.8) |
Fig. A2.
Case (B) for Property 1: The lines ΛNM = m0ΛBM + n0 and ΛNM = m1ΛBM + n1 intersect at a point (x*, y*) in the positive quadrant. The difference between PMB (m0, n0) and PMB (m1, n1) is the difference of the integral of the joint pdf of the likelihood ratios under class B in the shaded regions S0 and S1.
Similarly, for any y in S0, we have y ≥ y*, and for any y in S1, we have y* ≥ y. Therefore,
| (A.9) |
where the middle inequality is due to (A.8). We therefore conclude that
| (A.10) |
which, along with (A.2), implies that PMN (m0, n0) ≥ PMN (m1, n1). We also note that PMN (m0, n0) = PMN (m1, n1) if and only if f(x, y) = 0 in S0 ∪ S1\(x*, y*).
APPENDIX 2
In this appendix, we show that a given (PMB, PMN) pair uniquely determines PMM, i.e., we cannot have more than one sensitivity value for a given FPF pair. Let (m0, n0) and (m1, n1) be such that PMB (m0, n0) = PMB (m1, n1) and PMN (m0, n0) = PMN (m1, n1). Proceeding in a similar fashion to the proof of Property 1, we see that if the lines y = m0x + n0 and y = m1x + n1 do not intersect in the positive quadrant, or if m1 = m0, then PMM (m0, n0) = PMM (m1, n1). If these two lines intersect at one point in the positive quadrant, then, without loss of generality, let us assume m1 > m0 so that we can refer to Fig. A2. We have already shown (A.8) that if m1 > m0, then
| (A.11) |
Referring to Fig. A2, for any y in S0, we have y ≥ y*, and for any y in S1, we have y* ≥ y. Therefore,
| (A.12) |
from which we conclude
| (A.13) |
Equations (A.11) and (A.13) imply that PMM (m0, n0) = PMM (m1, n1).
APPENDIX 3
We will only prove the first part, i.e., if PMB (m0, n0) = PMB (m1, n1) and PMN (m0, n0) > PMN (m1, n1), then PMM (m0, n0) ≥ PMM (m1, n1). The proof of the second part follows similar steps. The assumptions about PMB and PMN imply that m1 > m0. This is because if m0 were larger than or equal to m1, then, by Property 1, we would have PMN (m1, n1) ≥ PMN (m0, n0). We also note that the lines ΛNM = m0ΛBM + n0 and ΛNM = m1ΛBM + n1 intersect in the positive quadrant, because otherwise we would have PMN (m0, n0) = PMN (m1, n1). Under these conditions, we have already shown that (A.8)
which implies that PMM (m0, n0) ≥ PMM (m1, n1).
APPENDIX 4
In this appendix, we show that, for the equal-covariance Gaussian distributions discussed in Section 2.E., diagonalization and translation do not affect the 3D ROC surface. This is equivalent to proving that a straight line in the original likelihood ratio plane remains a straight line after diagonalization. Let w⃗′ denote a random vector to be classified before the diagonalization, and let
| (A.14) |
The likelihood ratio between πB and πM before the diagonalization and translation is given by
| (A.15) |
We will show that the likelihood ratio between πB and πM after the diagonalization and translation, ΛBM (w⃗), is proportional to . The transformation for diagonalization and translation between w⃗ and w⃗′ is
| (A.16) |
where V is the matrix composed of the eigenvectors of Σ′, and L is the diagonal matrix constructed from the corresponding eigenvalues. The covariance matrix after the diagonalization is the identity matrix, and the class means are
| (A.17) |
The likelihood ratio between πB and πM after the diagonalization and translation is
| (A.18) |
Comparing to (A.15), we find that , where KB is a constant of proportionality. Similarly, it can be shown that , and therefore a straight line in the original likelihood ratio plane remains a straight line after diagonalization.
APPENDIX 5
We will demonstrate the derivation of (36) here, i.e., the relationship between PMB and PMN for m=0. The integrals can be evaluated in a similar manner to find the relationship between PMB and PMN for m = −∞ (35). First, for m=0, and with a change of variables
| (A.19) |
Eq. (33) can be written as
| (A.20) |
where
| (A.21) |
Therefore,
| (A.22) |
Similarly,
| (A.23) |
Solving for log n in terms of PMB in (A.22) and substituting into (A.23), we obtain (36).
APPENDIX 6
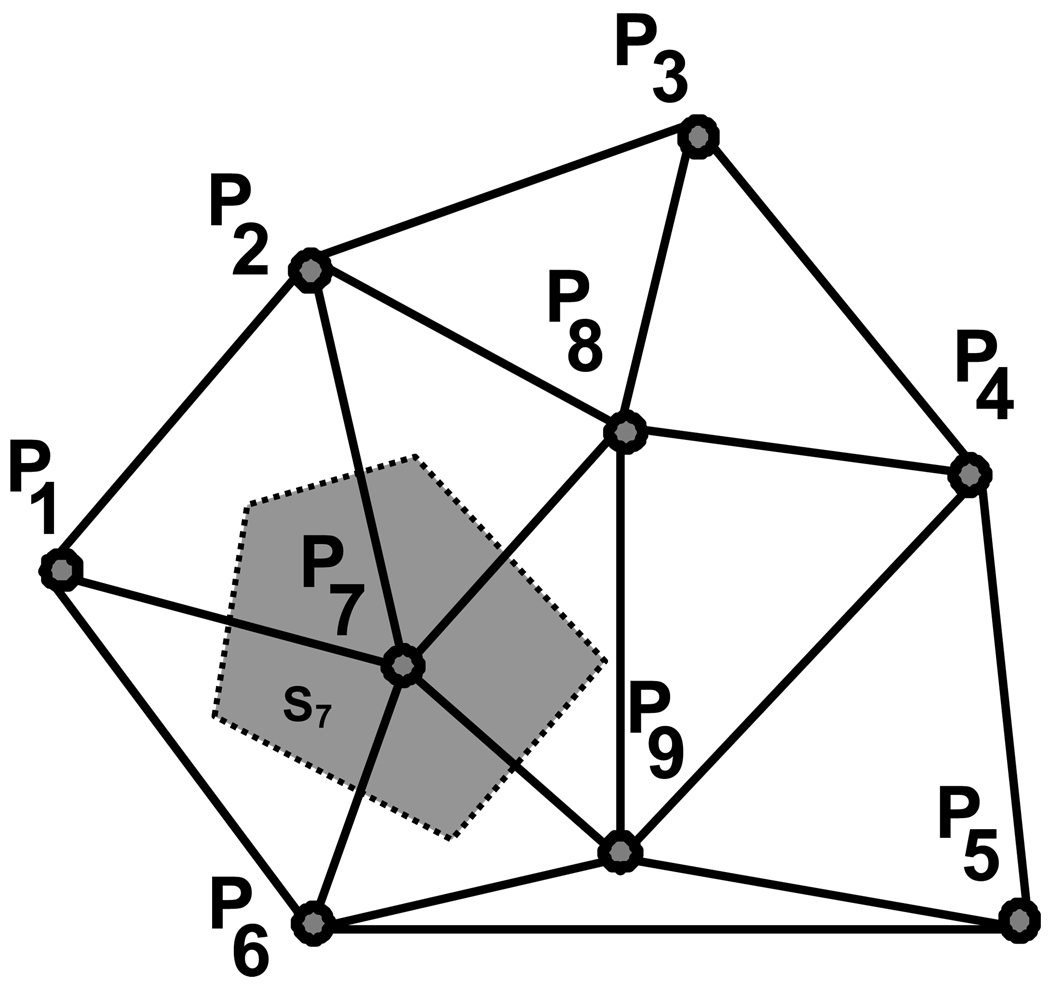
Delaunay triangulation is closely related to the Voronoi diagram for a set of Q points in the plane. Given Q points Pq, q = 1,…Q, one can partition the plane into Q partitions Sq, q = 1,…Q, where Sq* is the region of the plane that is closer to the point Pq* than to any of the other Q-1 points. Sq* is called the Voronoi domain of the point q*. If one draws a line between any two points whose Voronoi domains are adjacent to each other, a set of triangles is obtained, known as the Delaunay triangulation. The Delaunay triangulation has the property that the circumcircle of no triangle contains any points of the triangulation. Figure A3 shows a Delaunay triangulation for Q=9 points. The Voronoi cell S7 for the point P7 is shown as the shaded polygon. When the domain of the 3D ROC is convex, the area of the domain was approximated by the sum of all such triangles. When the domain was not convex, we excluded from the computation of the area any triangle whose interior contained any point outside the region bounded by C−∞ (PMB) and C0 (PMB), obtained empirically using the Monte Carlo simulation. The volume under the surface was approximated by summing up the volume of each prism whose base was given by a Delaunay triangle used in the area estimation.
Fig. A3.
Delaunay triangulation for Q=9 points in the plane. The Voronoi cell S7 for the point P7 is shown as the shaded polygon.
REFERENCES
- 1.Majumder SK, Gupta A, Gupta S, Ghosh N, Gupta PK. Multi-class classification algorithm for optical diagnosis of oral cancer. Journal of Photochemistry and Photobiology B-Biology. 2006;vol. 85:109–117. doi: 10.1016/j.jphotobiol.2006.05.004. [DOI] [PubMed] [Google Scholar]
- 2.Folkesson J, Dam E, Olsen OF, Pettersen P, Christiansen C. Automatic segmentation of the articular cartilage in knee MRI using a hierarchical multi-class classification scheme. Lecture Notes in Computer Science. 2005;vol. 3749:327–334. doi: 10.1007/11566465_41. [DOI] [PubMed] [Google Scholar]
- 3.Silipo R, Vergassola R, Zong W, Berthold MR. Knowledge-based and data-driven models in arrhythmia fuzzy classification. Methods of Information in Medicine. 2001;vol. 40:397–402. [PubMed] [Google Scholar]
- 4.Dreiseitl S, Ohno-Machado L, Binder M. Comparing three-class diagnostic tests by three-way ROC analysis. Medical Decision Making. 2000;vol. 20:323–331. doi: 10.1177/0272989X0002000309. [DOI] [PubMed] [Google Scholar]
- 5.Scurfield BK. Generalization of the theory of signal detectability to n-even t m-dimensional forced-choice tasks. Journal of Mathematical Psychology. 1998;vol. 42:5–31. doi: 10.1006/jmps.1997.1183. [DOI] [PubMed] [Google Scholar]
- 6.Mossman D. Three-way ROCs. Medical Decision Making. 1999;vol. 19:78–89. doi: 10.1177/0272989X9901900110. [DOI] [PubMed] [Google Scholar]
- 7.Chan HP, Sahiner B, Hadjiiski LM, Petrick N, Zhou C. Design of three-class classifiers in computer-aided diagnosis: Monte Carlo simulation study. Proceedings of the SPIE - Medical Imaging. 2003;vol. 5032:567–578. [Google Scholar]
- 8.Nakas CT, Yiannoutsos CT. Ordered multiple-class ROC analysis with continuous measurements. Statistics in Medicine. 2004;vol. 23:3437–3449. doi: 10.1002/sim.1917. [DOI] [PubMed] [Google Scholar]
- 9.Edwards DC, Metz CE, Kupinski MA. Ideal observers and optimal ROC hypersurfaces in N-class classification. IEEE Transactions on Medical Imaging. 2004;vol. 23:891–895. doi: 10.1109/TMI.2004.828358. [DOI] [PMC free article] [PubMed] [Google Scholar]
- 10.Edwards DC, Metz CE. Restrictions on the three-class ideal observer's decision boundary lines. IEEE Transactions on Medical Imaging. 2005;vol. 24:1566–1573. doi: 10.1109/TMI.2005.859212. [DOI] [PubMed] [Google Scholar]
- 11.Edwards DC, Metz CE, Nishikawa RM. The hypervolume under the ROC hypersurface of "near-guessing" and "near-perfect" observers in N-class classification tasks. IEEE Transactions on Medical Imaging. 2005;vol. 24:293–299. doi: 10.1109/tmi.2004.841227. [DOI] [PubMed] [Google Scholar]
- 12.Sahiner B, Chan HP, Hadjiiski LM. Performance analysis of 3-class classifiers: Properties of the 3D ROC surface and the normalized volume under the surface. Proceedings of the SPIE - Medical Imaging. 2006;vol. 6146:61460C1–61460C7. doi: 10.1109/TMI.2007.905822. [DOI] [PMC free article] [PubMed] [Google Scholar]
- 13.He X, Metz CE, Tsui BMW, Links JM, Frey EC. Three-class ROC analysis -- A decision theoreric approach under the ideal observer framework. IEEE Transactions on Medical Imaging. 2006;vol. 25:571–581. doi: 10.1109/tmi.2006.871416. [DOI] [PubMed] [Google Scholar]
- 14.Van Trees HL. Detection, estimation, and modulation theory. New York: John Wiley and Sons; 1968. [Google Scholar]
- 15.Dorfman DD, Alf E., Jr Maximum likelihood estimation of parameters of signal detection theory and determination of confidence intervals-rating method data. Journal of Mathematical Psychology. 1969;vol. 6:487–496. [Google Scholar]
- 16.Metz CE, Pan X. "Proper" binormal ROC curves: Theory and maximum-likelihood estimation. Journal of Mathematical Psychology. 1999;vol. 43:1–33. doi: 10.1006/jmps.1998.1218. [DOI] [PubMed] [Google Scholar]
- 17.Lyness JN. Notes on the adaptive Simpson quadrature routine. Journal of the Association for Computing Machinery. 1969;vol. 16:483–495. [Google Scholar]
- 18.McKeeman WM. Algorithm 145: Adaptive numerical integration by Simpson's rule. Communications of the Association for Computing Machinery. 1962;vol. 5:604. [Google Scholar]


