Abstract
Central obesity is associated with low-grade inflammation that promotes type 2 diabetes and cardiovascular disease in obese individuals. The 12- and 5-lipoxygenase (12-LO and 5-LO) enzymes have been linked to inflammatory changes, leading to the development of atherosclerosis. 12-LO has also been linked recently to inflammation and insulin resistance in adipocytes. We analyzed the expression of LO and proinflammatory cytokines in adipose tissue and adipocytes in obese Zucker rats, a widely studied genetic model of obesity, insulin resistance, and the metabolic syndrome. mRNA expression of 12-LO, 5-LO, and 5-LO-activating protein (FLAP) was upregulated in adipocytes and adipose tissue from obese Zucker rats compared with those from lean rats. Concomitant with increased LO gene expression, the 12-LO product 12-HETE and the 5-LO products 5-HETE and leukotriene B4 (LTB4) were also increased in adipocytes. Furthermore, upregulation of key proinflammatory markers interleukin (IL)-6, TNFα, and monocyte chemoattractant protein-1 were observed in adipocytes isolated from obese Zucker rats. Immunohistochemistry indicated that the positive 12-LO staining in adipose tissue represents cells in addition to adipocytes. This was confirmed by Western blotting in stromal vascular fractions. These changes were in part reversed by the novel anti-inflammatory drug lisofylline (LSF). LSF also reduced p-STAT4 in visceral adipose tissue from obese Zucker rats and improved the metabolic profile, reducing fasting plasma glucose and increasing insulin sensitivity in obese Zucker rats. In 3T3-L1 adipocytes, LSF abrogated the inflammatory response induced by LO products. Thus, therapeutic agents reducing LO or STAT4 activation may provide novel tools to reduce obesity-induced inflammation.
Keywords: interleukin-6, monocyte chemoattractant protein-1, 12- hydroxyeicosatetraenoic acid, 5-hydroxyeicosatetraenoic acid, 3T3-L1 adipocytes
the cardiometabolic syndrome is a cluster of interrelated common clinical disorders, including obesity, insulin resistance, glucose intolerance, hypertension, and dyslipidemia. The syndrome is associated with an increased risk for cardiovascular disease and type 2 diabetes (2, 22, 29, 30, 44, 52, 57, 59). Primary defects in energy balance that lead to obesity are sufficient to drive all aspects of the syndrome (39). It is now clear that central obesity is associated with chronic inflammation (6, 50). Furthermore, a large number of human population studies have linked insulin resistance to systemic inflammation (21, 48). It is known that TNFα and several other proinflammatory cytokines, including interleukin (IL)-6, IL-12, and monocyte chemoattractant protein-1 (MCP-1), are expressed in adipocytes and adipose tissue and are increased in obesity and diabetes (49, 62, 63, 65, 67). TNFα, IL-6, and IL-12 contribute to systemic insulin resistance (4, 9, 17, 25, 26, 49, 68), IL-6 promotes hypertriglyceridemia (41), and IL-12 promotes atherosclerosis (1, 62, 65). Furthermore, MCP-1 facilitates infiltration of inflammatory cells such as macrophages into adipose tissues (63, 65, 67). The factors regulating expression of proinflammatory cytokines/chemokines in adipocytes are far from clear; however, recent studies support a role for 12-lipoxygenase (12-LO). 12-LO metabolizes arachidonic acid to form the lipid inflammatory mediator 12-hydroperoxyeicosatetraenoic acid [12(S)-HPETE] that is converted to the more stable product 12-hydroxyeicosatetraenoic acid [12(S)-HETE].
12-LO has been implicated in the development of atherosclerosis (40, 53) and in the promotion of adipose tissue inflammation and insulin resistance in response to a high-fat diet (43, 54). 12-LO expression and/or activity are upregulated by hyperglycemia (12, 32, 34, 38, 69) in pancreatic β-cells and mesangial cells, by free fatty acids such as palmitic acid in 3T3-L1 adipocytes (10), by inflammatory cytokines in pancreatic β-cells (12) and human islets (36), and in adipose tissue after mice are fed a Western diet (10, 54). 5-Lipoxygenase (5-LO) and 5-LO-activating protein (5-FLAP) are involved in inflammatory pathways leading to atherosclerosis (3, 18, 22a, 45, 51). 5-FLAP is a fatty acid transport protein that specifically binds and presents arachidonic acid to 5-LO and enhances the formation of leukotriene B4 (LTB4) by 5-LO. LTB4 in turn augments MCP-1 expression in human monocytes (27). Lisofylline (LSF), 1-(5-R-hydroxyhexyl)-3,7-dimethylaxanthine, is a novel anti-inflammatory agent (15) that reduces IL-12 signaling (70) and, consequently, STAT4 activation, a key downstream component of IL-12 signaling. LSF reduces vascular injury and macrophage trafficking in the carotid artery of obese Zucker rats by reducing STAT4 activation (46). Importantly, LSF also improves glucose tolerance and insulin sensitivity in a high-fat-fed rodent model (19). In the present study, we explored inflammation in visceral adipocytes and adipose tissue of the obese Zucker rats (9) and evaluated the effects of LSF on their metabolic profile as well as adipose tissue inflammation and morphology.
MATERIALS AND METHODS
Materials and reagents.
The MCP-1 (SC 1785), IL-6 (SC 39347), and 5-FLAP (28815) antibodies were purchased from Santa Cruz Biotechnology (Santa Cruz, CA), the β-actin antibody (A 1978) was from Sigma-Aldrich (St. Louis, MO), and the CD45-FITC (ab 22475) and 5-LO (ab 39347) antibodies were from Abcam (Cambridge, MA). A primary antibody to leukocyte 12-LO was raised to a peptide derived from the sequence of the leukocyte 12-LO in our laboratory (7, 36). Phosphorylated STAT4 (p-STAT4) (5267) was from Cell Signaling Technology (Danvers, MA), and the total STAT4 (71-4500) was from Invitrogen (Carlsbad, CA). The blocking serum, antigen unmasking solution, biotinylated secondary antibody, and ABC peroxidase kit were from Vector Laboratories (Burlingame, CA). The diaminobenzidine substrate kit was purchased from Dako (Carpinteria, CA). ELISA kits were obtained from R & D Systems (Minneapolis, MN). Serum cytokines were measured through Linco Research, Millipore (Billercia, MA). LSF was provided as a white powder by DiaKine Therapeutics (Charlottesville, VA). LSF is soluble in aqueous buffers. 12(S)-HETE, 12(S)-HPETE, and 12(R)-HETE were from Biomol (Plymouth Meeting, PA). 3T3-L1 cells were kindly provided by the late Dr. John C. Lawrence. Jr. (University of Virginia, Charlottesville, VA).
Dulbecco's modified Eagle's medium (DMEM), penicillin-streptomycin, and trypsin were purchased from Invitrogen. Fetal bovine serum was purchased from Zen-Bio (Research Triangle Park, NC). Dexamethasone, isobutylmethylxanthine, and protease inhibitors were from Sigma-Aldrich. The PCR oligonucleotides were purchased from Operon Biotechnologies (Huntsville, AL), and TaqMan primers Rn00566700_m1 (IL-1α) and Rn00580432_m1 (IL-1β) were from Applied Biosytems (Foster City, CA).
Animals.
Obese and lean female Zucker rats at 12 wk of age were purchased from Charles River Laboratories (Wilmington, MA). The rats were housed in pathogen-free facilities and fed a chow diet (Harlan Teklad, Madison, WI). All studies were approved by the Institutional Animal Care and Use Committees of the University of Virginia and Eastern Virginia Medical School. LSF powder was dissolved in saline and injected into the peritoneal cavity of obese Zucker rats at a dose of 25 mg/kg body wt twice a day for 10 days. The volume of LSF was adjusted on the basis of weight changes.
Control obese Zucker and lean rats were given saline injections. Body weight and food intake were measured every other day throughout the study. The body weight and length at the time of euthanasia were recorded and used to calculate the body mass index (BMI). The perigonadal, retroperitoneal, and mesenteric fat pads (visceral fat) were separately excised and weighed. Blood was collected by cardiac puncture, and serum was used for cytokine, glucose, and insulin measurements, as described below.
Isolation of white visceral adipocytes and stromal vascular fraction.
Isolation of white perigonadal adipocytes was performed as described previously (5, 11). Briefly, rats were euthanized by CO2 anaphyxiation. Perigonadal fat pads were removed and minced with scissors. Minced fat pads were digested with collagenase in KRH-BSA buffer for 60 min at 37°C in a shaking water bath. Once digestion was complete, samples were passed through a nylon mesh (400 μm). The cells were washed by adding KRH-BSA 10 times the volume of the cell suspension. Adipocytes were allowed to float.
Floating cells were collected and washed with 10 times the volume of KRH-BSA five more times. After the final wash, the adipocytes were suspended in five times the volume of KRH-BSA and centrifuged at 200 g for 1 min at room temperature. The packed floating adipocytes were subjected to RNA isolation or preparation of adipocyte lysates for Western blotting, as described below. The infranatant was removed and centrifuged at 500 g for 5 min to pellet the stromal vascular fractions (SVF). SVF pellets were used for Western blotting and real-time PCR, as described below.
Cell culture.
3T3-L1 fibroblasts were propagated and differentiated as described previously (5, 11). Before each experiment, cells were kept overnight in DMEM containing 1% serum. Cells were then washed with DMEM containing 0.2% BSA and incubated in the same medium for 2 h before treatment with 12(S)-HETE, 12(S)-HPETE, or ethanol (solvent control) for an additional 2 or 4 h.
RNA extraction and real-time PCR.
RNA was prepared using the Ribo-Pure kit (Ambion, Foster City, CA) for 3T3-L1 adipocytes and SVF and Trizol (Invitrogen) for rat perigonadal adipocytes according to the manufacturer's instructions. For rat perigonadal adipocytes, 2 ml Trizol/1 ml cells was added, and the lysates were prepared by passing the cells in Trizol 10 times through an 18-gauge needle. Five micrograms of total RNA was added to the cDNA synthesis reaction containing Moloney murine leukemia virus reverse transcriptase (Invitrogen) and random hexamers (Invitrogen) in a 20-μl reaction volume. For quantitative measurement of PCR products, a double-stranded DNA dye, SYBR Green I (Molecular Probes, Carlsbad, CA), or TaqMan Probe was used with Jump Start Taq Polymerase (Sigma-Aldrich). Three microliters of the cDNA reaction (fivefold diluted) were used as template for real-time PCR in a reaction volume of 25 μl (12). The mouse primer sequences and PCR conditions were described previously (12). The rat primer sequences (19, 30, 35, 54) are presented in Table 1. The PCR conditions for the rat cytokines, 12-LO, 5-LO, and 5-FLAP were denaturation at 95°C for 30 s, annealing at 62°C for 30 s, and extension at 72°C for 30 s for 50 cycles. TaqMan PCR assays were done according to the manufacturer's instructions. All reactions were performed in triplicate, and the data were normalized to a housekeeping gene, 18S rRNA or actin, and evaluated using the 2−ΔΔCT method (12). Expression levels are presented as fold induction or downregulation of transcripts of respective genes relative to control.
Table 1.
Primer sequences used in real-time RT-PCR amplification of cDNA from rat adipocytes/adipose tissue
| Rat Genes | Forward Primers | Reverse Primers |
|---|---|---|
| Leukocyte type 12-LO | 5′-GATGGG TGTCTACCG CATCC-3′ | 5′-CCTC TCCATGC TGTCCAACC-3′ |
| 5-LO | 5′-GGCACCGACGAC TACATTTACC-3′ | 5′-ACCCAGT TCTTCATCCACAGTGAC-3′ |
| 5-FLAP | 5′-TCAAGAG GC TG TG G GCAATG-3′ | 5′-CAGT TCTGGTTGGCAGTGTAGACC-3′ |
| IL-6 | 5′-AC CAC T TCACAAGTCGGAGG-3′ | 5′-ACAGTGCATCATCGCTGT TC-3′ |
| TNFα | 5′-GGTGATCG GTCCCAACAAG GA-3′ | 5′-CACGCTGGC TCAGCCACTC-3′ |
| MCP-1 | 5′-C CTG C TGC TACTCATTCAC-3′ | 5′-TCTCAC TTGG TTCTG GTC C-3′ |
| 18S | 5′-CCCAGTAAGTGCGGGTCATA-3′ | 5′-GGCCTCACTAAACCATCCAA-3′ |
| Cychlophilin | 5′-AGCACTG GGGAGAAAGGATT-3′ | 5-CATGCCTTCTTTCACCTTCC-3′ |
12- and 5-LO, 12- and 5-lipoxygenase, respectively; 5-FLAP, 5-LO-activating protein; MCP-1, monocyte chemoattractant protein-1.
Western blotting.
Freshly isolated adipocytes and SVF were lysed in sodium dodecyl sulfate gel loading buffer containing protease and phosphatase inhibitors, as described in Ref. 10. The lysates were sheared by passing through a 23-gauge needle at least six to eight times. Protein determination was done by the Lowry method (DC Protein assay; Bio-Rad), as described previously (47), and Western blot analysis was performed as described in Ref. 10. Western blot quantifications were performed using Image J software [National Institutes of Health (NIH), Bethesda, MD].
Immunohistochemistry.
Adipose tissue samples from obese Zucker or lean rats were fixed with 4% paraformaldehyde for 24–30 h at room temperature and embedded in paraffin (68). Five-micrometer-thick paraffin-embedded tissue sections were then deparaffinized and rehydrated in graduated alcohol to distilled water. Antigens were retrieved using a high-temperature antigen-unmasking technique with antigen unmasking solution. The endogenous peroxidase was quenched using 0.5% H2O2 in methanol (Fisher Scientific) for 30 min at room temperature. The sections were then incubated for 30 min at room temperature with diluted normal blocking serum and stained at 4°C overnight with primary antibodies against IL-6, MCP-1, p-STAT4, 12-LO, and 5-LO, followed by a biotinylated secondary antibody for 60 min at room temperature and an avidin-biotin-peroxidase for 30 min at room temperature. Finally, the sections were developed with a diaminobenzidine substrate kit and counterstained using hematoxylin.
The expression of IL-6, MCP-1, p-STAT4, 12-LO, and 5-LO protein was determined by microscopic evaluation of the diaminobenzidine reaction product on the sections. Quantification of the immunohistochemical data was done using MetaMorph software version 6.3 (Molecular Devices, Downingtown, PA) with an established arbitrary threshold.
Measurement of 12- and 5-LO activities.
The activities were determined by measuring the levels of the 12-LO product 12-HETE and the 5-LO products 5-HETE and LTB4 as follows. Lipids were extracted from adipocytes by our validated solid-phase extraction method and quantified using our HPLC assay with modified fluorescent labeling (53). The amounts of 5- and 12-HETE in the samples were determined by comparing the peak area of HETEs to that of an internal standard, 8-HETE (not present in mammalian cells). The ratio of peak area of 5-, 12-, and 8-HETE of known concentrations was compared with unknown concentrations. LTB4 was measured on the basis of an internal standard.
Cytokines/chemokines, glucose, and insulin measurements.
Serum was obtained from randomly fed rats, and cytokine levels were determined by Linco Research (St. Charles, MO) for cytokine production. For glucose and insulin measurements, blood was collected by cardiac puncture from rats that were fasted overnight following euthanasia. Glucose was measured using an enzymatic kit from BioVision (Mountain View, CA), and insulin was measured by ELISA using a kit from Mercodia (Uppsala, Sweden).
Adipose tissue morphometry.
Perigonadal adipose tissue was collected in 10% buffered formalin, fixed overnight, and embedded in paraffin. Hematoxylin and eosin staining was used for adipocyte morphometry. Three representative images per section were obtained for a total of six tissue sections per rat. Six rats per experimental group were analyzed. Images were taken using a Zeiss Plan Apochromat ×20 objective, and adipocyte area and number were determined using Image J software (NIH).
Statistics.
Statistical analysis was performed using GraphPad Prism version 4.03 software. All data are presented as means ± SE unless otherwise stated. For experiments from one time period, the control and experimental samples were analyzed using Student's t-test. For multiple time periods, analysis of variance was used with the appropriate corrections. For immunohistochemical quantification of the adipose tissue sections, data was normalized per section area analyzed and expressed as means ± SE. Statistical analysis was performed by one-way ANOVA and a Tukey's post hoc test. A P value of <0.05 was considered to indicate statistically significant differences.
RESULTS
Food intake, body weight, blood glucose, and serum insulin measurements in obese Zucker rats and the effect of LSF on these parameters.
To evaluate the effect of LSF on the metabolic profile of obese Zucker rats, we measured body weight, food intake, terminal fasting plasma glucose, and insulin levels for rats treated with LSF or saline (Table 2). LSF did not significantly change body weight and BMI in obese rats. However, it significantly increased perigonadal fat and total visceral fat mass. To further determine whether LSF has effects on energy homeostasis, we determined feed efficiency by dividing total body weight gain by total food intake (Table 2). We found that LSF treatment slightly increased feed efficiency in obese rats and reduced food intake (P = 0.059). This result together with the increase in adipose tissue mass suggests elevated lipid storage in adipose tissue. To further determine whether LSF improved glucose homeostasis, we measured fasting plasma glucose and insulin (Table 2). LSF treatment significantly reduced fasting plasma glucose but did not alter fasting plasma insulin concentration. When homeostasis model assessment (insulin resistance) was calculated, we found that it was significantly lower in the LSF-treated obese rats, indicating improved insulin sensitivity following LSF treatment. In summary, these data suggest that LSF has beneficial effects on the metabolic profile of obese Zucker rats by reducing glucose level and improving insulin sensitivity. Also, LSF treatment increased feed efficiency with concomitant increased lipid storage in adipose tissue, which may prove beneficial to prevent ectopic (nonadipose) lipid deposition.
Table 2.
Body weight and food intake measured every other day throughout the study
| Group | Obese Zucker | Obese Zucker + LSF | P Value (unpaired t-test) |
|---|---|---|---|
| Body weight at euthanization, g | 462.14 ± 26.6 | 441.21 ± 13.27 | P = 0.087 |
| Perigonadal fat, g | 9.93 ± 1.67 | 12.67 ± 2.19 | P < 0.05 |
| Total visceral fat, g | 28.79 ± 3.28 | 33.80 ± 3.03 | P < 0.05 |
| Body mass index | 342.49 ± 7.61 | 338.35 ± 3.33 | P = 0.210 |
| Total weight gain, g | 25.57 ± 12.83 | 36.0 ± 12.64 | P = 0.151 |
| Total food intake, g | 207.1 ± 34.3 | 166.8 ± 38 | P = 0.059 |
| Feed efficiency | 0.12 ± 0.06 | 0.22 ± 0.07 | P < 0.05 |
| Serum fasting glucose, mmol/l | 6.53 ± 1.04 | 5.15 ± 0.48 | P < 0.01 |
| Serum fasting insulin, μg/ml | 4.79 ± 0.85 | 4.62 ± 0.78 | P = 0.688 |
| HOMA-IR | 32.99 ± 5.86 | 25.59 ± 6.32 | P < 0.05 |
Results are expressed as means ± SD; n = 7 rats/group. LSF, lysofylline; HOMA-IR, homeostasis model assessment of insulin resistance. Weight gain is calculated as a difference between the weights recorded at the end and at the beginning of the study. Feed efficiency was calculated by dividing the food intake to weight gain. Total visceral fat represents the sum of perigonadal, retroperitoneal, and mesenteric pads. Body mass index was calculated using the formula [3√body wt (g)/length (mm)] × 104. HOMA-IR was calculated as [fasting glucose (mg/dl) × fasting insulin (μU/ml)]/405. Effect of LSF on body weight, adiposity, glucose, and insulin in obese Zucker rats.
Effect of LSF on adipose tissue morphology.
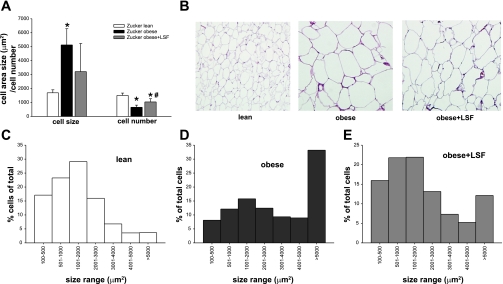
To examine the effect of LSF on adipose tissue morphology, we determined adipocyte number and size distribution in perigonadal adipose tissue of obese Zucker rats with and without LSF treatment (Fig. 1). The number of cells normalized to area examined was significantly lower in obese compared with lean rats, and LSF treatment brought back cell number similar to lean rats (Fig. 1A).
Fig. 1.
Lisofylline (LSF) treatment alters adipose tissue morphology in obese Zucker rats. A: average cell size and number were quantified on hematoxylin- and eosin-stained paraffin sections in 6 rats/group. Data are expressed as means ± SD. *Significant compared with lean rats; #significant compared with obese rats. B: representative pictures illustrating adipose tissue sections from lean, saline-treated, and LSF-treated obese rats. C: size distribution analysis in n = 6 rats/group; distribution is expressed as percentage of cells counted on each size interval normalized to total cells counted.
Mean adipocyte size as determined by measurement of adipocyte area was significantly increased in obese compared with lean rats, and LSF treatment led to cell size that was similar to lean animals (Fig. 1, A and B). Interestingly, adipocyte size distribution analysis revealed a large shift in cell distribution toward very large, hypertrophic adipocytes in obese Zucker rats and a reduction in the relative proportion of smaller adipocytes compared with lean rats (Fig. 1C). LSF treatment resulted in an adipocyte distribution that was very similar to lean rats, with a larger relative percentage of smaller adipocytes and a relative reduction of the hypertrophic adipocytes. These results suggest that LSF treatment induced a metabolically favorable adipocyte profile, a larger proportion of smaller adipocytes typically associated with better insulin sensitivity, and reduced lipolysis.
12- and 5-LO expression and activity are upregulated in perigonadal white adipocytes from obese Zucker rats concomitant with increased inflammatory response.
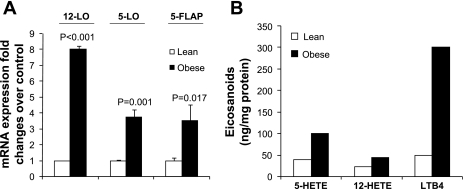
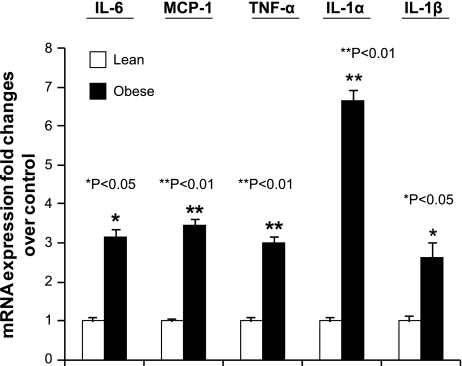
To evaluate whether 12- and 5-LO could play roles in obesity-associated adipose tissue inflammation, we examined whether perigonadal white adipocytes isolated from obese Zucker rats exhibited increased expression of these enzymes. 12-LO, 5-LO, and 5-FLAP mRNA were measured by real-time PCR. As shown in Fig. 2A, 12-LO, 5-LO, and 5-FLAP mRNA were increased eight-, 3.75-, and 3.5-fold, respectively, in visceral adipocytes from obese Zucker rats compared with adipocytes isolated from age- and sex-matched lean rats. To examine whether the augmented expression of 12- and 5-LO mRNA was associated with increased activity levels, the enzymatic products of the LOs were measured by HPLC. 12-HETE, 5-HETE, and LTB4 product formation were increased two-, 2.5-, and sixfold, respectively (Fig. 2B). Our data thus indicate that 12- and 5-LO protein and activity were elevated concomitant with increased mRNA expression in adipocytes of obese Zucker rats. We next examined whether the augmented expression of 12- and 5-LO in adipocytes from Zucker obese rats was associated with upregulation of proinflammatory cytokine expression. The proinflammatory markers studied included IL-6, MCP-1, TNFα, IL-1α, and IL-1β. As shown in Fig. 3, IL-6, MCP-1, TNFα, IL-1α, and IL-1β mRNA levels were upregulated 3.1-, 3.5-, 3-, 6.6-, and 2.6-fold, respectively, in adipocytes from obese Zucker rats compared with adipocytes from lean rats. Increased cytokine expression was not likely due to macrophages contaminating the isolated adipocytes, since we determined that the isolated adipocytes contained <3% macrophages (data not shown) by fluorescence-activated cell sorting analysis.
Fig. 2.
12-Lipoxygenase (12-LO), 5-lipoxygenase (5-LO), and 5-LO-activating protein (5-FLAP) mRNA were upregulated in visceral adipocytes isolated from obese Zucker rats. A: real-time RT-PCR measurements of 12-LO, 5-LO, and 5-FLAP mRNA levels in adipocytes. The fold changes were measured relative to lean control and calculated with the 2−ΔΔCT method. The data were normalized to 18S rRNA. All data represent the mean ± SE from 3 independent experiments, and P values indicate that values are statistically significantly different (P < 0.001–0.05) compared with lean rats. B: 12-hydroxyeicosatetraenoic acid (12-HETE), 5-hydroxyeicosatetraenoic (5-HETE), and leukotriene B4 (LTB4) measurements by HPLC.
Fig. 3.
IL-6, monocyte chemoattractant protein-1 (MCP-1), TNFα, IL-1α, and IL-1β mRNA were upregulated in visceral adipocytes isolated from obese Zucker rats. Real-time RT-PCR measurements of IL-6, MCP-1, TNFα, IL-1α, and IL-1β mRNA levels in adipocytes. The data were normalized to 18S rRNA. The fold changes were measured relative to lean control and calculated with the 2−ΔΔCT method. All data represent the mean ± SE from 3 independent experiments, and P values indicate that values are statistically significantly different (P < 0.001–0.05) compared with lean rats.
LSF reduces obesity-induced 12-LO, 5-LO, and 5-FLAP expression and proinflammatory response in white visceral adipocytes/adipose tissue from obese Zucker rats.
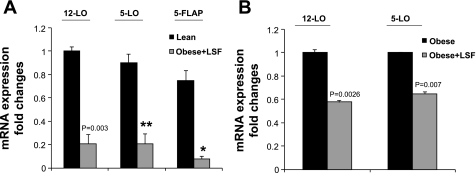
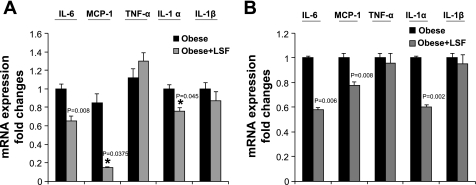
To examine whether the anti-inflammatory compound LSF has an effect on the expression of 12-LO, 5-LO, and 5-FLAP, adipose tissue and adipocytes were obtained from saline-treated and LSF-treated obese Zucker rats. mRNA measurement was done by real-time RT-PCR. As shown in Fig. 4A, LSF treatment significantly reduced 12-LO, 5-LO, and 5-FLAP mRNA compared with levels seen in adipocytes from saline-treated obese rats. The reduction of 12- and 5-LO mRNA expression was also evident in adipose tissue from LSF-treated obese Zucker rats, as shown in Fig. 4B. Next, we examined whether LSF also reduced proinflammatory cytokine expression in adipocytes from obese Zucker rats. We determined the expression of key proinflammatory cytokines IL-6, MCP-1, TNFα, IL-1α, and IL-1β. LSF treatment significantly reduced the mRNA levels of IL-6, MCP-1, and IL-1α both in adipocytes (Fig. 5A) and in adipose tissue (Fig. 5B). Interestingly, LSF treatment did not significantly change TNFα and IL-1β mRNA levels in adipocytes from obese rats (Fig. 5A) or in adipose tissue of obese rats (Fig. 5B).
Fig. 4.
LSF downregulates 12-LO, 5-LO, and 5-FLAP mRNA expression in visceral adipocytes and adipose tissue from obese Zucker rats. A: real-time RT-PCR measurements of 12-LO, 5-LO, and 5-FLAP mRNA levels in adipocytes from obese Zucker rats treated with either saline or LSF. B: mRNA measurements of 12- and 5-LO in adipose tissue from these groups. The data were normalized to 18S rRNA. All data represent the mean ± SE from 3 independent experiments, and P values indicate that values are statistically significantly different (P < 0.001–0.05) compared with saline-treated obese Zucker rats. Data are representative of 7–8 rats/treatment group. *P < 0.05; **P < 0.003.
Fig. 5.
Effect of LSF on IL-6, MCP-1, TNFα, IL-1α, and IL-1β mRNA in visceral adipocytes and adipose tissue from obese Zucker rats. Real-time RT-PCR measurements of IL-6, MCP-1, TNFα, IL-1α, and IL-1β mRNA levels in adipocytes (A) and adipose tissue (B) from obese Zucker rats treated with either saline or LSF. The data were normalized to 18S rRNA. All data represent the mean ± SE from 3 independent experiments, and P values indicate that values are statistically significantly different (P < 0.001–0.05) compared with saline-treated obese Zucker rats. Data are representative of 6–7 rats/treatment group. *P < 0.05.
Evaluation of 12- and 5-LO protein expression in visceral adipose tissue from obese Zucker rats.
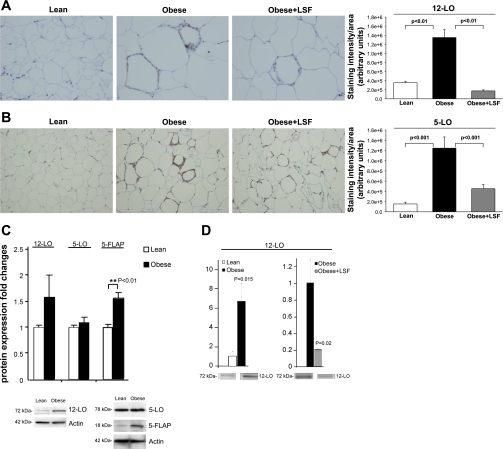
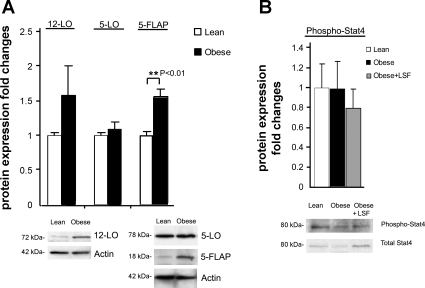
To further study the effects of LSF on obesity-induced inflammatory changes, immunohistochemical analysis was conducted on adipose tissue from lean rats and LSF- and saline-treated obese Zucker rats. As shown in Fig. 6A, 12-LO-immunopositive staining was significantly increased (3.8-fold, P < 0.01) in adipose tissue sections from obese Zucker rats compared with lean rats, and LSF treatment reduced 12-LO staining (P < 0.01) in adipose tissue sections from obese Zucker rats compared with saline-treated obese Zucker rats. Similarly, as shown in Fig. 6B, 5-LO-immunopositive cells were increased 8.1-fold (P < 0.001) in adipose tissue sections from obese Zucker rats when compared with lean rats, and LSF treatment reduced 5-LO immunostaining 2.8-fold (P < 0.001) in obese Zucker rats compared with saline-treated obese Zucker rats. To also evaluate protein expression, we performed Western blot analysis and quantified the results. As shown in Fig. 6C, Western blot analysis demonstrated 1.6-fold upregulation of 12-LO and 5-FLAP expression in adipose tissue from obese Zucker rats compared with lean rats. Interestingly, we did not observe any discernible augmentation of 5-LO protein expression in adipose tissue from obese Zucker rats. The reason we did not see changes in 5-LO by Western blotting might be due to the limitation of this technique in quantifying localized increases in expression of a specific protein in whole tissue as opposed to using immunohistochemical techniques where per-cell staining could be identifiable among many unstained cells. There was a wide variation in fold changes of 12- and 5-LO expression in adipose tissue using these two techniques commonly used for quantification of protein expression. Interestingly, as shown in Fig. 6D, additional Western blot analysis in isolated adipocytes demonstrated a clear increase (P = 0.015) of 12-LO expression in obese Zucker rats compared with adipocytes from lean rats, and LSF completely reversed the changes, thus suggesting a clear effect of LSF in adipocytes to modify expression of 12-LO. Supplemental Fig. S1 (Supplemental Material for this article is available online at the AJP-Endocrinology and Metabolism web site) shows the representative image of a full 12-LO Western blot on adipose tissue.
Fig. 6.
Evaluation of 12- and 5-LO protein expression in visceral adipose tissue and adipocytes from obese Zucker rats and effect of LSF. Immunohistochemistry and quantification illustrating increased 12-LO (A) and 5-LO staining (B) in saline-treated obese rats and reduced immunopositive cells in LSF-treated obese rats compared with saline-treated obese rats. Magnification is ×400 in A and ×200 in B. For quantification of the immunohistochemical data, 6 different fields from 3 rats/group were analyzed. C: bar graph illustrating quantification of the Western blot densitometry data for 12-LO, 5-LO, and 5-FLAP expression in adipose tissue from lean and obese rats, and representative blots are shown below. D: Western blot quantification of 12-LO expression in adipocytes from lean and obese Zucker rats from saline- and LSF-treated obese Zucker rats. Data are expressed as fold changes compared with lean or saline-treated obese rats, normalized to actin, and are representative of 6–7 rats/group.
Evaluation of IL-6 and MCP-1 protein expression in visceral adipose tissue from obese Zucker rats.
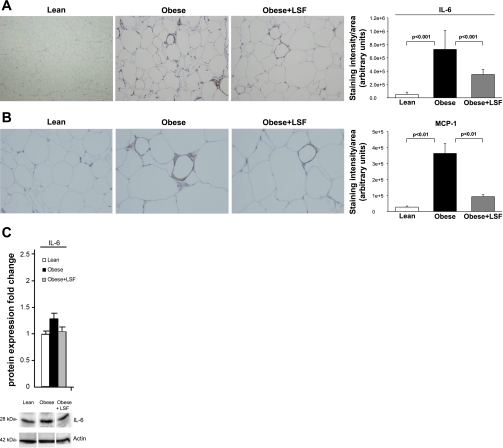
To further evaluate the presence of inflammation in visceral adipose tissue, adipose tissue sections were stained for IL-6 and MCP-1. As shown in Fig. 7A, IL-6 immunostaining was augmented 14.1-fold (P < 0.001) in adipose tissue from obese Zucker rats compared with lean rats, and LSF treatment significantly reduced IL-6 immunostaining 2.1-fold (P < 0.001) in adipose tissue from obese Zucker rats compared with saline-treated obese Zucker rats. As shown in Fig. 7B, MCP-1 immunostaining was augmented 3.9-fold (P < 0.01) in adipose tissue from obese Zucker rats when compared with lean rats. Again LSF treatment significantly reduced MCP-1 immunostaining 2.7-fold (P < 0.01) compared with saline-treated obese Zucker rats. We also performed Western blot analysis and quantified the results. As shown in Fig. 7C, similar to the immunohistochemical data, IL-6 protein levels were increased in adipose tissue from obese Zucker rats, and LSF reversed the changes.
Fig. 7.
Protein expression of IL-6 and MCP-1 in visceral adipose tissue from obese Zucker rats and effect of LSF. IL-6 (A) and MCP-1 immunostaining and quantification (B) showing increased number of immunnopositive cells in obese Zucker rats compared with lean rats and reduced staining in LSF-treated compared with saline-treated obese rats. Magnification is ×200 in A and ×400 in B. For quantification of the immunohistochemical data, 6 different fields from 3 rats/group were analyzed. C: bar graph illustrating quantification of the Western blot densitometry analysis for IL-6 expression from the same groups of rats, and representative blots are shown below. Data are expressed as fold change compared with lean rats normalized to actin and are representative of 6–7 rats/group.
STAT4 activation in adipose tissue from obese Zucker rats.
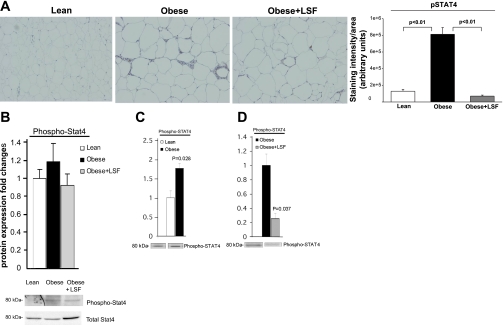
STAT4 is a transcription factor that transduces IL-1α- and IL-12-mediated inflammatory and immune responses. We previously showed increased p-STAT4 levels in carotid vessels of obese Zucker rats (44). As shown in Fig. 8A, immunohistochemical data clearly indicated 6.3-fold increased (P < 0.01) p-STAT4 immunostaining in adipose tissue from obese Zucker rats when compared with lean rats, and LSF treatment significantly reduced p-STAT4 in adipose tissue from obese Zucker rats compared with saline-treated obese rats (P < 0.01). We performed Western blot analysis and quantified the results (Fig. 8B). However, unlike immnohistochemical data, where we observed significant augmentation of p-STAT4 immunostaining in adipose tissue sections from obese Zucker rats, our Western blot analysis showed less augmentation (1.2-fold) of p-STAT4 expression in adipose tissue from obese Zucker rats. This apparent discrepancy could be due to the difference in the sensitivity of the two detection systems since antibodies often have varied responses in immunostaining or Western blot, and Western blot of whole tissue may dilute changes observed in specific cell types in that tissue.
Fig. 8.
STAT4 activation in visceral adipose tissue and adipocytes from obese Zucker rats and effect of LSF. A: immunohistochemistry and quantification showing increased number of p-STAT4-positive cells in obese Zucker rats compared with lean rats and reduced staining in LSF-treated compared with saline-treated obese rats. Magnification is ×200. For quantification of the immunohistochemical data, 6 different fields from 3 rats/group were analyzed. B: bar graph illustrating quantification of the Western blot densitometry analysis for p-STAT4 expression in adipose tissue from the same groups of rats, and representative blots are shown below. p-STAT4 quantification in adipocytes from lean and obese Zucker rats (C) and from saline- and LSF-treated obese Zucker rats (D). Data are representative of 6–7 rats/treatment group. The data are normalized to total STAT4 band intensity.
Importantly, to examine the p-STAT4 protein expression specifically in adipocytes and the effect of LSF, we performed Western blot analysis on adipocytes isolated from lean rats and saline- and LSF-treated obese Zucker rats and quantified the results. As shown in Fig. 8C, the density of the p-STAT4 band in adipocytes from obese Zucker rats was augmented almost twofold (P = 0.028, n = 3) compared with lean rats. LSF significantly reduced (P = 0.037) p-STAT4 levels in the adipocytes from obese Zucker rats compared with saline-treated obese rats (Fig. 8D), again indicating an effect of LSF on adipocytes.
Evaluation of lipoxygenases and p-STAT4 expression in SVF from obese Zucker rats.
The earlier experiments were performed in either adipose tissues or isolated adipocytes. However, we have shown previously that 12-LO is highly expressed in macrophages (66). Therefore, we examined the expression of lipoxygenases in SVF from lean rats and saline- and LSF-treated obese Zucker rats by Western blot analysis. As shown in Fig. 9A, 12-LO protein levels were increased 1.3-fold (P < 0.05) in SVF from obese Zucker rats compared with lean rats. Also, 5-FLAP protein levels were increased 1.6-fold. However, there was no discernible augmentation of 5-LO in SVF from obese Zucker rats. Interestingly, LSF did not reduce the expression of 12-LO and 5-FLAP in SVF of obese Zucker rats compared with saline-treated obese Zucker rats (data not shown). Furthermore, we did not observe any discernible changes of p-STAT4 expression in SVF from obese Zucker rats compared with lean rats (Fig. 9B).
Fig. 9.
Western blot evaluation of LOs and p-STAT4 expression in stromal vascular fraction from obese Zucker rats. A: bar graphs illustrating quantification of the Western blot densitometry analysis for 12-LO, 5-LO, and 5-FLAP expression in lean and obese Zucker rats and expressed as fold changes in protein expression compared with lean and normalized to actin. Representative blots are shown below. B: p-STAT4 expression quantified by Western blot densitometry and expressed as a ratio of phospho/total STAT4. Data are representative of 6–7 rats/group.
Serum proinflammatory cytokine levels change in obese Zucker rats and the effect of LSF.
Blood samples from saline- and LSF-treated obese Zucker rats were obtained for the measurement of adipokines and cytokines. Leptin levels were markedly elevated in obese rats compared with lean rats, and LSF treatment had no effect on leptin levels (data not shown). Other cytokines that were found to be increased in serum from obese Zucker rats compared with lean rats included IL-1α (4.9-fold), MCP-1 (3.2-fold), IL-6 (3.5-fold), IL-12p70 (4.2-fold), and IFNγ (4.9-fold). LSF significantly reduced levels of IL-6 and MCP-1 in obese Zucker rats. LSF treatment also reduced levels of IL-1α, IL-12p70, and IFNγ. These results are presented in Table 3. Other proinflammatory cytokines such as IL-1β, MIP-1α, IL-18, IP-10, and TNFα were either undetectable or showed no changes between obese and lean rats (data not shown).
Table 3.
Serum cytokine levels (pg/ml) in lean and obese Zucker rats and the effect of LSF
|
P Values (ANOVA) |
|||||
|---|---|---|---|---|---|
| Group | Lean | Obese | Obese + LSF | By genotype | By treatment |
| IL-1α | 784 ± 153 | 3,832 ± 284 | 632 ± 122 | P < 0.001 | P < 0.001 |
| MCP-1 | 469 ± 53 | 1,509 ± 280 | 866 ± 36.2 | P < 0.001 | P < 0.05 |
| IL-6 | 6,958 ± 540 | 24,508 ± 5,955 | 2,916 ± 492 | P < 0.01 | P < 0.001 |
| IL-12p70 | 322 ± 45 | 1,367 ± 140 | 288 ± 68 | P < 0.0001 | P < 0.001 |
| IFNγ | 1,272 ± 216 | 6,243 ± 671 | 763 ± 162 | P < 0.001 | P < 0.001 |
All data represent the mean ± SE from 3 independent experiments, and P values indicate that values are statistically significantly different (P < 0.001-0.05) when compared with lean and saline-treated obese rats.
Proinflammatory response induced by 12(S)- and 5(S)-HETE in 3T3-L1 adipocytes is abolished by LSF.
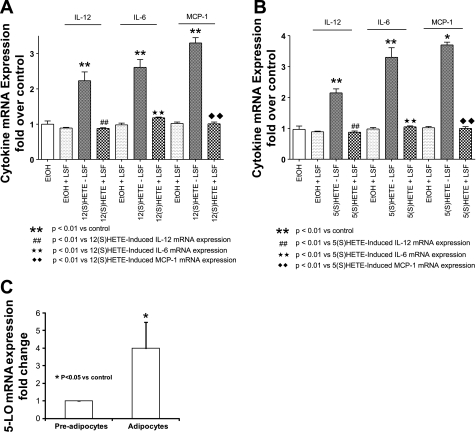
To more directly examine the effect of LSF on 12- and 5-LO-mediated effects in adipocytes, we used differentiated 3T3-L1 adipocytes as target cells. We recently showed that 12-LO was expressed in differentiated 3T3-L1 adipocytes, and addition of 12(S)-HETE to the 3T3-L1 adipocytes caused augmentation of proinflammatory cytokine gene expression (10). As shown in Fig. 10A, LSF reversed the augmentation of IL-6, MCP-1, and IL-12p40 mRNA expression induced by the addition of 12(S)-HETE in 3T3-L1 adipocytes. As shown in Fig. 10B, addition of 5(S)-HETE to 3T3-L1 adipocytes also caused a significant upregulation of IL-6 (3.4-fold) and MCP-1 (3.7-fold), as well as IL-12p40 (2.2-fold), and LSF treatment completely abrogated the inflammatory response. In Fig. 10C, we show that fully differentiated 3T3-L1 adipocytes exhibit substantially higher levels of 5-LO expression (4-fold) compared with undifferentiated fibroblasts, thus indicating a strong presence of 5-LO in differentiated 3T3-L1 adipocytes.
Fig. 10.
Effect of LSF treatment on IL-12, IL-6, and MCP-1 mRNA induced by 12(S)- and 5(S)-HETE in 3T3-L1 adipocytes. LSF-mediated reversal of increased expression of IL-12, IL-6, and MCP-1 mRNA induced by direct addition of 12(S)-HETE (A) and 5(S)-HETE (B) to differentiated 3T3-L1 adipocytes. C: real-time RT-PCR measurement of 5-LO mRNA in preadipocytes and differentiated 3T3-LI adipocytes. The data were normalized to actin. All data represent the mean ± SE from 3 independent experiments, and P values indicate that values are statistically significantly different (P < 0.001–0.05) compared with preadipocytes (C) and ethanol-treated 3T3-L1 adipocytes (A and B).
DISCUSSION
Visceral adipose tissue inflammation associated with obesity plays an important role in systemic inflammation and the development of insulin resistance, type 2 diabetes, and atherosclerosis (22, 29, 52, 61, 64, 67). Adipose tissue inflammation may be due to a stress reaction of adipocytes to nutrient overload and consequently increased production of proinflammatory cytokines by the adipocytes. This in turn leads to migration of inflammatory cells (macrophages and T cells) into the adipose tissue and thereby promotes a vicious cycle of escalating inflammation (35, 42). However, the underlying events leading to initiation of increased proinflammatory cytokine production in the adipocytes are not clear.
We recently showed that addition of 12-LO products to 3T3-L1 adipocytes caused upregulation of key proinflammatory cytokines, thus indicating a direct role of 12-LO in eliciting inflammatory responses in adipocytes (11). Furthermore, 12-LO has recently been linked to inflammation in high-fat diet-induced obesity in mice (43, 54). 5-LO and 5-FLAP have also been implicated to play roles in obesity and insulin resistance (18, 24, 28), and a recent study demonstrated the role of 5-FLAP in adipose tissue inflammation in experimental obesity (24). However, 12- and 5-LO expression and activity in adipocytes and adipose tissue have not been studied in genetic models of obesity and insulin resistance.
In this study, we observed for the first time that mRNA levels and activity of 12- and 5-LO were increased in visceral adipocytes from insulin-resistant obese Zucker rats. Also, 5-FLAP mRNA levels were increased in visceral adipocytes from obese Zucker rats. Concomitant with these changes, mRNA levels of the key proinflammatory cytokines IL-6, TNFα, and MCP-1 were increased.
Furthermore, immunohistochemical staining demonstrated increased numbers of cells expressing 12-LO, 5-LO, IL-6, and MCP-1 in visceral adipose tissue sections from obese Zucker rats. The immunopositive cells in the adipose tissue most likely represent not only adipocytes but also macrophages. Several reports have shown that in obesity, adipose tissue contains an increased number of macrophages (31, 63). 12-LO is also highly expressed in macrophages, and its products have been shown to augment IL-6 and MCP-1 expression in cultured macrophages (66). Here, we show increased 12-LO expression not only in adipocytes and adipose tissue from obese Zucker rats but also in the SVF that includes the macrophages. Moreover, we performed a side-by-side comparison of the mRNA levels of 12- and 5-LO in adipocytes and SVF isolated from obese Zucker rats (Supplemental Fig. S2). We observed similar levels of 12-LO in both adipocytes and SVF. However, 5-LO mRNA levels were higher in SVF compared with adipocytes. Thus, 3% macrophage contamination in our adipocyte preparation was unlikely to contribute to the overall 12-LO expression mRNA levels in adipose tissue from obese Zucker rats. Additionally, higher levels of 5-LO mRNA in SVF compared with adipocytes were unlikely to contribute to the increased 5-LO mRNA levels in adipose tissue from obese Zucker rats since there was no discernible increase of 5-LO expression levels in SVF compared with lean Zucker rats. These results indicate enhanced inflammation in adipocytes and adipose tissue of obese Zucker rats that is associated with increased 12- and 5-LO expression and activity. An earlier study from our laboratory demonstrated that in the high-fat-fed mouse model, global deletion of 12-LO significantly reduces macrophage infiltration and a proinflammatory response in visceral adipose tissue (43). Thus, we propose that 12-LO activation may be a link to adipose tissue inflammation in the insulin-resistant obese Zucker rats. Additional studies with selective 12-LO inhibitors will be needed to test this hypothesis. Future studies in mice with 12-LO specifically deleted in macrophages and in adipocytes will also shed further light on whether activated 12-LO in adipocytes and/or in macrophages plays a primary role in increased proinflammatory responses in adipose tissue in obesity.
LSF is an anti-inflammatory and immunomodulatory water-soluble small molecule that was developed to protect pancreatic islets from immune injury. LSF inhibits gene expression and production of several inflammatory cytokines linked to STAT4 activation. Activated p-STAT4 plays a key role in the induction of inflammatory immune responses (14, 60). There is a growing appreciation for the role of immune activation in adipose inflammation and insulin resistance. The primary action of LSF is to reduce IL-12-induced increases in STAT4 tyrosine phosphorylation (70). In obese Zucker rats, LSF reduces p-STAT4 activity in the vasculature and significantly attenuates neointimal responses to vascular injury in the carotid artery (46). In this study we observed that LSF treatment significantly reduced p-STAT4 levels in isolated adipocytes and decreased the number of p-STAT4-positive cells in adipose tissue sections from obese Zucker rats. We also show that LSF treatment significantly attenuates the increased 12-LO, 5-LO, and 5-FLAP mRNA levels in adipocytes and reduces the number of cells immunopositive for 12- and 5-LO in adipose tissue sections from obese Zucker rats.
Furthermore, we show that LSF treatment reduces key cytokine/chemokine gene expression in adipocytes and adipose tissue and levels of proinflammatory cytokines in the circulation. The full mechanism(s) by which LSF mediates its anti-inflammatory effects remains to be established, but there may be a feed-forward process by which STAT4 drives cytokines that induce 12-LO expression. Whether LSF regulates both pathways independently or only one pathway is regulated by LSF, and this in turn affects the other pathway, remains to be investigated. However, in 3T3-L1 adipocytes, LSF completely suppressed the increased IL-6, MCP-1, and IL-12p40 cytokine/chemokine expression induced by 12- and 5-LO products 12(S)- and 5(S)-HETE, thereby indicating that 12- and 5-LO pathways may be modulated by LSF inhibitory actions at the adipocyte level. Interestingly, we did not observe LSF inhibitory action on 12-LO protein expression in SVF (data not shown).
Additionally, we found that LSF treatment augmented adipose tissue mass and increased feed efficiency in obese rats without significantly affecting body weight. These data suggest that LSF increases the storage capacity of adipose tissue in Zucker rats and thereby prevents ectopic lipid accumulation. A similar effect was reported for thiazolinendiones with concomitant increased insulin sensitivity (16). The mechanism underlying increased lipid accumulation in adipose tissue associated with LSF treatment is unknown, but an indirect effect via reduction of local inflammation is conceivable.
Proinflammatory cytokine production reduces adipogenesis and promotes adipocyte hypertrophy (23, 56). LSF treatment reversed this process, since it significantly increased the number of smaller-size adipocytes and reduced the number of hypertrophic adipocytes in obese Zucker rats. The adipose tissue remodeling may further decrease inflammation, since smaller adipocytes produce less proinflammatory cytokines (55). Decreased inflammation will also lead to improved whole body insulin sensitivity. In the LSF-treated obese Zucker rats, we observed decreased glucose levels in the serum in the presence of similar insulin levels, which is compatible with improved insulin action. This is supported by a previous preliminary study by Balon et al. (3a) that demonstrated improved insulin action in LSF-treated diabetic obese Zucker rats. In a very recent publication, LSF has also been shown to reduce insulin resistance in high-fat-fed mice, and these effects were associated with reduced ceramide levels (19).
In conclusion, we provide the first evidence for the upregulation of 12- and 5-LO concomitant with increased key proinflammatory cytokine/chemokine expression in adipocytes and adipose tissue of obese Zucker rats. We also show that LSF has a beneficial role in reducing lipoxygenase and cytokine/chemokine expression as well as activation of STAT4 in adipose tissue and adipocytes of obese Zucker rats. The results with the 3T3-L1 adipocytes provide evidence that LSF may prevent an inflammatory response in visceral adipose tissue in obesity by inhibiting signaling pathways elicited by 12- and 5-LO products. Therefore, medications targeted to reduce 12- or 5-LO and/or STAT4 activation could provide a new therapeutic approach to prevent or reverse the metabolic and vascular consequences of visceral obesity.
GRANTS
These studies were supported by National Institutes of Health (NIH) Grants DK-55240 and POI-HL-59798 (to J. L. Nadler). B. K. Cole is the recipient of an NIH F32 Fellowship Training Award (DK-085716-01).
DISCLOSURES
J. L. Nadler holds stock in and is a founder of Diakine Therapeutics.
Supplementary Material
REFERENCES
- 1. Adorini L. Interleukin 12 and autoimmune diabetes. Nat Genet 27: 131–132, 2001 [DOI] [PubMed] [Google Scholar]
- 2. Arkan MC, Hevener AL, Greten FR, Maeda S, Li ZW, Long JM, Wynshaw-Boris A, Poli G, Olefsky JM, Karin M. IKK-β links inflammation to obesity induced insulin resistance. Nat Med 11: 191–198, 2005 [DOI] [PubMed] [Google Scholar]
- 3. Bäck M, Sultan A, Ovchinnikova O, Hansson GK. 5-Lipoxygenase-activating protein: a potential link between innate and adaptive immunity in atherosclerosis and adipose tissue inflammation. Circ Res 100: 946–949, 2007 [DOI] [PubMed] [Google Scholar]
- 3a. Balon TW, Jasman AP, Bwisten SL, Nadler JL. Lisofylline, a modulator of fatty acid metabolism, increases peripheral insulin sensitivity (Abstract). Diabetes 48, Suppl 1: 411, 2000 [Google Scholar]
- 4. Bastard JP, Maachi M, Van Nhieu JT, Jardel C, Bruckert E, Grimaldi A, Robert JJ, Capeau J, Hainque B. Adipose tissue IL-6 content correlates with resistance to insulin activation of glucose uptake both in vivo and in vitro. J Clin Endocrinol Metab 87: 2084–2089, 2002 [DOI] [PubMed] [Google Scholar]
- 5. Baumann CA, Ribon V, Kanzaki M, Thurmond DC, Mora S, Shigematsu S, Bickel PE, Pessin JE, Saltiel AR. CAP defines a second signaling pathway required for insulin-stimulated glucose transport. Nature 407: 202–207, 2000 [DOI] [PubMed] [Google Scholar]
- 6. Berg AH, Scherer PE. Adipose tissue, inflammation, and cardiovascular disease. Circ Res 96: 939–949, 2005 [DOI] [PubMed] [Google Scholar]
- 7. Bleich D, Chen S, Gu JL, Thomas L, Scott S, Gonzales N, Natarajan R, Nadler JL. Interleukin-1 beta regulates the expression of a leukocyte type of 12-lipoxygenase in rat islets and RIN m5F cells. Endocrinology 136: 5736–5744, 1995 [DOI] [PubMed] [Google Scholar]
- 9. Bray GA. The Zucker-fatty rat: a review. Fed Proc 36: 148–153, 1977 [PubMed] [Google Scholar]
- 10. Bullo M, Garcia-Lorda P, Megias I, Salas-Salvado J. Systemic inflammation, adipose tissue tumor necrosis factor, and leptin expression. Obes Res 11: 525–531, 2003 [DOI] [PubMed] [Google Scholar]
- 11. Chakrabarti SK, Cole BK, Wen Y, Keller SR, Nadler JL. 12/15-lipoxygenase products induce inflammation and impair insulin signaling in 3T3-L1 adipocytes. Obesity (Silver Spring) 17: 1657–1663, 2009 [DOI] [PMC free article] [PubMed] [Google Scholar]
- 12. Chakrabarti SK, James JC, Mirmira RG. Quantitative assessment of gene targeting in vitro and in vivo by the pancreatic transcription factor, Pdx1. Importance of chromatin structure in directing promoter binding. J Biol Chem 277: 13286–13293, 2002 [DOI] [PubMed] [Google Scholar]
- 13. Chen M, Yang MD, Smith KM, Carter JD, Nadler JL. Activation of 12-lipoxygenase in pro-inflammatory cytokine-mediated beta cell toxicity. Diabetologia 48: 486–495, 2005 [DOI] [PubMed] [Google Scholar]
- 14. Coon ME, Diegel M, Leshinsky N, Klaus SJ. Selective pharmacologic inhibition of murine and human IL-12-dependent Th1 differentiation and IL-12 signaling. J Immunol 163: 6567–6574, 1999 [PubMed] [Google Scholar]
- 15. Cui P, Macdonald TL, Chen M, Nadler JL. Synthesis and biological evaluation of lisofylline (LSF) analogs as a potential treatment for Type 1 diabetes. Bioorg Med Chem Lett 16: 3401–3405, 2006 [DOI] [PubMed] [Google Scholar]
- 16. Diamant M, Heine RJ. Thiazolidinediones in type 2 diabetes mellitus: current clinical evidence. Drugs 63: 1373–1405, 2003 [DOI] [PubMed] [Google Scholar]
- 17. Duncan BB, Schmidt MI, Pankow JS, Ballantyne CM, Couper D, Vigo A, Hoogeveen R, Folson AR, Heiss G. Low-grade systemic inflammation and the development of type 2 diabetes: the atherosclerosis risk in communities study. Diabetes 52: 1799–1805, 2003 [DOI] [PubMed] [Google Scholar]
- 18. Ferguson AD, McKeever BM, Xu S, Wisniewski D, Miller DK, Yamin TT, Spencer RH, Chu L, Ujjainwalla F, Cunningham BR, Evans JF, Becker JW. Crystal structure of inhibitor-bound human 5-lipoxygenase-activating protein. Science 317: 510–512, 2007 [DOI] [PubMed] [Google Scholar]
- 19. Frangioudakis G, Garrard J, Raddatz K, Nadler JL, Mitchell TW, Schmitz-Peiffer C. Saturated- and n-6 polyunsaturated-fat diets each induce ceramide accumulation in mouse skeletal muscle: reversal and improvement of glucose tolerance by lipid metabolism inhibitors. Endocrinology 151: 4187–4196, 2010 [DOI] [PMC free article] [PubMed] [Google Scholar]
- 20. Gabriely I, Ma XU, Yang XM, Atzmon G, Rajala MW, Berg AH, Scherer P, Rosetti L, Barzilai N. Removal of visceral fat prevents insulin resistance and glucose tolerance of aging. Diabetes 51: 2951–2958, 2002 [DOI] [PubMed] [Google Scholar]
- 21. Grimble RF. Inflammatory status and insulin resistance. Curr Opin Clin Nutr Metab Care 5: 551–559, 2002 [DOI] [PubMed] [Google Scholar]
- 22. Grundy SM. Obesity, metabolic syndrome, and cardiovascular disease. J Clin Endocrinol Metab 89: 2595–2600, 2004 [DOI] [PubMed] [Google Scholar]
- 22a. Gubitosi-Klug RA, Talahalli R, Du Y, Nadler JL, Kern TS. 5-Lipoxygenase, but not 12/15-lipoxygenase, contributes to degeneration of retinal capillaries in a mouse model of diabetic retinopathy. Diabetes 57: 1387–1393, 2008 [DOI] [PMC free article] [PubMed] [Google Scholar]
- 23. Gustafson B, Gogg S, Hedjazifar S, Jenndahl L, Hammarstedt A, Smith U. Inflammation and impaired adipogenesis in hypertrophic obesity in man. Am J Physiol Endocrinol Metab 297: E999–E1003, 2009 [DOI] [PubMed] [Google Scholar]
- 24. Horrillo R, González-Périz A, Martínez-Clemente M, López-Parra M, Ferré N, Titos E, Morán-Salvador E, Deulofeu R, Arroyo V, Clària J. 5-lipoxygenase activating protein signals adipose tissue inflammation and lipid dysfunction in experimental obesity. J Immunol 184: 3978–3987, 2010 [DOI] [PubMed] [Google Scholar]
- 25. Hotamisligil GS, Arner P, Caro JF, Atkinson RL, Spiegelman BM. Increased adipose tissue. Expression of tumor necrosis factor-alpha in human obesity and insulin resistance. J Clin Invest 95: 2409–2415, 1995 [DOI] [PMC free article] [PubMed] [Google Scholar]
- 26. Hotamisligil GS, Spiegelman BM. Tumor necrosis factor alpha: a key component of the obesity-diabetes link. Diabetes 43: 1271–1278, 1994 [DOI] [PubMed] [Google Scholar]
- 27. Huang L, Zhao A, Wong F, Ayala JM, Struthers M, Ujjainwalla F, Wright SD, Springer MS, Evans J, Cui J. Leukotriene B4 strongly increases monocyte chemoattractant protein-1 in human monocytes. Arterioscler Thromb Vasc Biol 24: 1748–1749, 2004 [DOI] [PubMed] [Google Scholar]
- 28. Kaaman M, Rydén M, Axelsson T, Nordström E, Sicard A, Bouloumié A, Langin D, Arner P, Dahlman I. ALOX5AP expression, but not gene haplotypes, is associated with obesity and insulin resistance. Int J Obes (Lond) 30: 447–452, 2006 [DOI] [PubMed] [Google Scholar]
- 29. Kahn SE, Hull RL, Utzschneider KM. Mechanism linking obesity to insulin resistance and type 2 diabetes. Nature 444: 840–846, 2006 [DOI] [PubMed] [Google Scholar]
- 30. Kahn BB, Flier JS. Obesity and insulin resistance. J Clin Invest 106: 473–481, 2000 [DOI] [PMC free article] [PubMed] [Google Scholar]
- 31. Kanda H, Tateya S, Tamori Y, Kotani K, Hiasa K, Kitazawa R, Kitazawa S, Miyachi H, Maeda S, Egashira K, Kasuga M. MCP-1 contributes to macrophage infiltration into adipose tissue, insulin resistance, and hepatic steatosis in obesity. J Clin Invest 116: 1494–1505, 2006 [DOI] [PMC free article] [PubMed] [Google Scholar]
- 32. Kang SW, Adler SG, Nast CC, LaPage J, Gu JL, Nadler JL, Natarajan R. 12-lipoxygenase is increased in glucose-stimulated mesangial cells and in experimental diabetic nephropathy. Kidney Int 59: 1354–1362, 2001 [DOI] [PubMed] [Google Scholar]
- 34. Laybutt DR, Sharma A, Sgroi DC, Gaudet J, Bonner-Weir S, Weir GC. Genetic regulation of metabolic pathways in beta-cells disrupted by hyperglycemia. J Biol Chem 277: 10912–10921, 2002 [DOI] [PubMed] [Google Scholar]
- 35. Lumeng CN, Maillard I, Saltiel AR. T-ing up inflammation in fat. Nat Med 15: 846–847, 2009 [DOI] [PubMed] [Google Scholar]
- 36. Ma K, Nunemaker CS, Wu R, Chakrabarti SK, Taylor-Fishwick DA, Nadler JL. 12-Lipoxygenase Products Reduce Insulin Secretion and {beta}-Cell Viability in Human Islets. J Clin Endocrinol Metab 95: 887–893, 2010 [DOI] [PMC free article] [PubMed] [Google Scholar]
- 37. Manev H, Uz T. Primary culture of rat cerebellar granule cells as a model to study neuronal 5-lipoxygenase and FLAP gene expression. Ann NY Acad Sci 890: 183–190, 1999 [DOI] [PubMed] [Google Scholar]
- 38. McDuffie M, Maybee NA, Keller SR, Stevens BK, Garmey GC, Morris MA, Kropf E, Rival C, Ma K, Carter JD, Tersey SA, Nunemaker CS, Nadler JL. Nonobese diabetic (NOD) mice congenic for a targeted deletion of 12/15-lipoxygenase are protected from autoimmune diabetes. Diabetes 57: 199–208, 2008 [DOI] [PMC free article] [PubMed] [Google Scholar]
- 39. Moller DE, Kaufman KD. Metabolic syndrome: a clinical and molecular perspective. Annu Rev Med 56: 45–62, 2005 [DOI] [PubMed] [Google Scholar]
- 40. Natarajan R, Nadler JL. Lipid inflammatory mediators in diabetic vascular disease. Arterioscler Thromb Vasc Biol 24: 1542–1548, 2004 [DOI] [PubMed] [Google Scholar]
- 41. Nonogaki K, Fuller GM, Fuentes NL, Moser AH, Staprans I, Grunfeld C, Feingold KR. Interleukin-6 stimulates hepatic triglyceride secretion in rats. Endocrinology 136: 2143–2149, 1995 [DOI] [PubMed] [Google Scholar]
- 42. Neels JG, Olefsky JM. Inflamed fat: what starts the fire? J Clin Invest 116: 33–35, 2006 [DOI] [PMC free article] [PubMed] [Google Scholar]
- 43. Nunemaker CS, Chen M, Pei H, Kimble SD, Keller SR, Carter JD, Yang Z, Smith KM, Wu R, Bevard MH, Garmey JC, Nadler JL. 12-Lipoxygenase-knockout mice are resistant to inflammatory effects of obesity induced by western diet. Am J Physiol Endocrinol Metab 295: E1065–E1075, 2008 [DOI] [PMC free article] [PubMed] [Google Scholar]
- 44. Olefsky JM. IKKepsilon: a bridge between obesity and inflammation. Cell 138: 834–836, 2009 [DOI] [PubMed] [Google Scholar]
- 45. Osher E, Weisinger G, Limor R, Tordjman K, Stern N. The 5 lipoxygenase system in the vasculature: emerging role in health and disease. Mol Cell Endocrinol 27: 201–206, 2006 [DOI] [PubMed] [Google Scholar]
- 46. Pei H, Gu J, Thimmalapura PR, Mison A, Nadler JL. Activation of the 12-lipoxygenase and signal transducer and activator of transcription pathway during neointima formation in a model of the metabolic syndrome. Am J Physiol Endocrinol Metab 290: E92–E102, 2006 [DOI] [PubMed] [Google Scholar]
- 47. Peterson GL. A simplification of the protein assay method of Lowry et al. which is more generally applicable. Anal Biochem 83: 346–356, 1977 [DOI] [PubMed] [Google Scholar]
- 48. Pickup JC, Crook MA. Is type II diabetes mellitus a disease of the innate immune system? Diabetologia 41: 1241–1248, 1998 [DOI] [PubMed] [Google Scholar]
- 49. Pickup JC, Chusney GD, Thomas SM, Burt D. Plasma interleukin-6, tumour necrosis factor alpha and blood cytokine production in type 2 diabetes. Life Sci 67: 291–300, 2000 [DOI] [PubMed] [Google Scholar]
- 50. Qatanani M, Szwergold NR, Greaves DR, Rexford S, Ahima RS, Lazar MA. Macrophage-derived human resistin exacerbates adipose tissue inflammation and insulin resistance in mice. J Clin Invest 119: 531–539, 2009 [DOI] [PMC free article] [PubMed] [Google Scholar]
- 51. Rådmark O. 5-lipoxygenase-derived leukotrienes. Arterioscler Thromb Vasc Biol 23: 1140–1142, 2003 [DOI] [PubMed] [Google Scholar]
- 52. Reaven G, Abbasi F, McLaughlin T. Obesity, insulin resistance and cardiovascular disease. Recent Prog Horm Res 59: 207–223, 2004 [DOI] [PubMed] [Google Scholar]
- 53. Reilly KB, Srinivasan S, Hatley ME, Patricia MK, Lannigan J, Bolick DT, Vandenhoff G, Pei H, Natarajan R, Nadler JL, Hedrick CC. 12/15-Lipoxygenase activity mediates inflammatory monocyte/endothelial interactions and atherosclerosis in vivo. J Biol Chem 279: 9440–9450, 2004 [DOI] [PubMed] [Google Scholar]
- 54. Sears DD, Miles PD, Chapman J, Ofrecio JM, Almazan F, Thapar D, Miller YI. 12/15-lipoxygenase is required for the early onset of high fat diet-induced adipose tissue inflammation and insulin resistance in mice. PloS One 4: e7250, 2009 [DOI] [PMC free article] [PubMed] [Google Scholar]
- 55. Skurk T, Alberti-Huber C, Herder C, Hauner H. Relationship between adipocyte size and adipokine expression and secretion. J Clin Endocrinol Metab 92: 1023–1033, 2007 [DOI] [PubMed] [Google Scholar]
- 56. Smith U, Hammarstedt A. Antagonistic effects of thiazolidinediones and cytokines in lipotoxicity. Biochim Biophys Acta 1801: 377–380, 2010 [DOI] [PubMed] [Google Scholar]
- 57. Steinberger J, Daniels SR. Obesity, insulin resistance, diabetes, and cardiovascular risk in children. Circulation 107: 1448–1453, 2003 [DOI] [PubMed] [Google Scholar]
- 58. Sugiyama T, Yoshimoto T, Hirono Y, Suzuki N, Sakurada M, Tsuchiya K, Minami I, Iwashima F, Sakai H, Tateno T, Sato R, Hirata Y. Aldosterone increases osteopontin gene expression in rat endothelial cells. Biochem Biophys Res Commun 336: 163–167, 2005 [DOI] [PubMed] [Google Scholar]
- 59. Tabas I. Macrophage death and defective inflammation resolution in atherosclerosis. Nat Rev Immunol 10: 35–36, 2010 [DOI] [PMC free article] [PubMed] [Google Scholar]
- 60. Torpey N, Maher SE, Bothwell AL, Pober JS. Interferon alpha but not interleukin 12 activates STAT4 signaling in human vascular endothelial cells. J Biol Chem 279: 26789–26796, 2004 [DOI] [PubMed] [Google Scholar]
- 61. Van Gaal LF, Mertens IL, De Block CE. Mechanisms linking obesity with cardiovascular disease. Nature 444: 875–880, 2006 [DOI] [PubMed] [Google Scholar]
- 62. Wegner M, Winiarska H, Bobkiewicz-Kozlowska T, Dworacka M. IL-12 serum levels in patients with type 2 diabetes treated with sulphonylureas. Cytokine 42: 312–316, 2008 [DOI] [PubMed] [Google Scholar]
- 63. Weisberg SP, McCann D, Desai M, Rosenbaum M, Leibel RL, Ferrante AW., Jr Obesity is associated with macrophage accumulation in adipose tissue. J Clin Invest 112: 1796–1808, 2003 [DOI] [PMC free article] [PubMed] [Google Scholar]
- 64. Weiss R, Dziura J, Burgert TS, Tamborlane WV, Taksali SE, Yeckel CW, Allen K, Lopes M, Savoye M, Morrison J, Sherwin RS, Caprio S. Obesity and the metabolic syndrome in children and adolescents. N Engl J Med 350: 2362–2375, 2004 [DOI] [PubMed] [Google Scholar]
- 65. Wen Y, Gu J, Li SL, Reddy MA, Natarajan R, Nadler JL. Elevated glucose and diabetes promote interleukin-12 cytokine gene expression in mouse macrophages. Endocrinology 147: 2518–2525, 2006 [DOI] [PubMed] [Google Scholar]
- 66. Wen Y, Gu J, Chakrabarti SK, Aylor K, Marshall J, Takahashi Y, Yoshimoto T, Nadler JL. The role of 12/15-lipoxygenase in the expression of interleukin-6 and tumor necrosis factor-alpha in machrophages. Endocrinology 148: 1313–1322, 2007 [DOI] [PubMed] [Google Scholar]
- 67. Wueest S, Rapold RA, Schumann DM, Rytka JM, Schildknecth A, Nov O, Chervonsky AV, Rudich A, Schoenle EJ, Donath MY, Konrad D. Deletion of Fas in adipocytes relieves adipose tissue inflammation and hepatic manifestation of obesity in mice. J Clin Invest 120: 191–202, 2010 [DOI] [PMC free article] [PubMed] [Google Scholar]
- 68. Xu H, Barnes GT, Yang Q, Tan G, Yang D, Chou CJ, Sole J, Nichols A, Ross JS, Tartaglia LA, Chen H. Chronic inflammation in fat plays a crucial role in the development of obesity-related insulin resistance. J Clin Invest 112: 1821–1830, 2003 [DOI] [PMC free article] [PubMed] [Google Scholar]
- 69. Yang Z, Chen M, Ellett JD, Fialkow LB, Carter JD, McDuffie M, Nadler JL. Autoimmune diabetes is blocked in Stat-4 deficient mice. J Autoimmun 22: 191–200, 2004 [DOI] [PubMed] [Google Scholar]
- 70. Yang Z, Chen M, Nadler JL. Lisofylline: a potential lead for the treatment of diabetes. Biochem Pharmacol 69: 1–5, 2005 [DOI] [PubMed] [Google Scholar]
Associated Data
This section collects any data citations, data availability statements, or supplementary materials included in this article.


