Abstract
The domestic cat (Felis catus), a carnivore, naturally eats a very low carbohydrate diet. In contrast, the dog (Canis familiaris), a carno-omnivore, has a varied diet. This study was performed to determine the expression of the intestinal brush border membrane sodium/glucose cotransporter, SGLT1, sweet receptor, T1R2/T1R3, and disaccharidases in these species adapted to contrasting diets. The expression (this includes function) of SGLT1, sucrase, maltase and lactase were determined using purified brush border membrane vesicles and by quantitative immunohistochemistry of fixed tissues. The pattern of expression of subunits of the sweet receptor T1R2 and T1R3 was assessed using fluorescent immunohistochemistry. In proximal, middle, and distal small intestine, SGLT1 function in dogs was 1.9- to 2.3-fold higher than in cats (P = 0.037, P = 0.0011, P = 0.027, respectively), and SGLT1 protein abundance followed an identical pattern. Both cats and dogs express T1R3 in a subset of intestinal epithelial cells, and dogs, but not cats, express T1R2. In proximal and middle regions, there were 3.1- and 1.6-fold higher lactase (P = 0.006 and P = 0.019), 4.4- and 2.9-fold higher sucrase (both P < 0.0001), and 4.6- and 3.1-fold higher maltase activity (P = 0.0026 and P = 0.0005), respectively, in the intestine of dogs compared with cats. Dogs have a potential higher capacity to digest and absorb carbohydrates than cats. Cats may suffer from carbohydrate malabsorption following ingestion of high-carbohydrate meals. However, dogs have a digestive ability to cope with diets containing significant levels of carbohydrate.
Keywords: canine, feline, glucose transport, carbohydrate, intestine
in nonruminant mammals, dietary carbohydrate is hydrolyzed by pancreatic amylase and brush border membrane (BBM) disaccharidases to monosaccharides, mainly glucose, galactose and fructose. Glucose and galactose are transported across the BBM by sodium/glucose cotransporter-1 (SGLT1) (41). SGLT1 is the rate-limiting step for entry of glucose into the body. Therefore, its function is essential for the provision of glucose, contributing to glucose homeostasis. Little is known about SGLT1 expression in the intestine of domestic dogs (Canis familiaris) and cats (Felis catus).
It has been proposed that intestinal glucose transport tends to match the natural diet of a species (7, 19), and this process is also known to be adaptively regulated by diet in most species studied (6, 8, 12–14, 17, 27, 37, 39). Recent investigations have provided strong evidence that dietary regulation of intestinal SGLT1 expression (and thus BBM glucose transport capacity) involves sensing by the intestinal sweet receptor, the T1R2/T1R3 heterodimer, which is present in certain intestinal enteroendocrine cells (15, 30, 32). It has been shown that cats are unable to upregulate intestinal glucose transport in response to increased dietary carbohydrate (8). Interestingly, the gene for T1R2, a subunit of the sweet receptor, is a pseudogene in cats (28), while dogs possess the gene for this receptor subunit (34).
Dogs and cats are from separate branches within the order Carnivora. This order contains more than 260 species, most of which are omnivores, despite their name. Dogs are carno-omnivorous animals, adapted to eat a varied diet, whereas cats are carnivorous and naturally eat a diet of principally protein and fat, with very little carbohydrate.
The major objectives of this study were to determine, quantitatively, intestinal brush border membrane carbohydrate digestive and absorptive functions in cats and dogs, and to correlate Na+-dependent BBM glucose uptake with SGLT1 protein abundance in these two species. To achieve this, it was necessary to clone cDNA encoding for cat SGLT1. Furthermore, we set out to assess the expression of the T1R2 and T1R3 sweet receptor subunits at the protein level.
MATERIALS AND METHODS
Animals, diets, and tissues.
Intestinal tissues were obtained from healthy weaned dogs and cats, which were used for research purposes at the University of Pennsylvania School of Veterinary Medicine. All procedures were approved by the Ethics Committee of the University of Pennsylvania. Ten cats and twelve dogs, neutered and of both sexes, had been maintained on nutritionally balanced commercial dry food containing 32% and 45–51% digestible carbohydrate, respectively (dry matter basis). Animals were euthanized by rapid intravenous injection of pentobarbital sodium. Immediately, the entire small intestine was removed and cut into three equal pieces, corresponding to proximal, middle, and distal portions. Intestinal sections were opened using sharp scissors, rinsed in ice-cold 0.9% wt/vol NaCl, and blotted with paper towel. A 1–2-cm piece of intestine was placed into 4% paraformaldehyde for subsequent fixing and histology/immunohistochemistry. Remaining pieces of whole intestine were wrapped in aluminum foil and placed into liquid nitrogen. All samples were shipped to the laboratory in the UK packed in dry ice. Samples were subsequently stored at −80°C until use.
Cloning cat SGLT1.
RNA was extracted from cat intestinal mucosa (RNeasy Mini Kit, Qiagen), according to the manufacturer's instructions. Single-stranded cDNA was produced using purified cat RNA as a template, oligo(dT)20 primers and Superscript III reverse transcriptase (Invitrogen). Using consensus primers, based on the known sequences of dog, human, rat, rabbit, and sheep SGLT1, and a proofreading DNA polymerase (Accuzyme, Bioline), nested PCR was performed to produce an amplicon of 846 base pairs. This was purified, cloned into pGEM-T easy vector (Promega), and custom sequenced (Eurofins). Overlapping segments of feline SGLT1 (fSGLT1) were subsequently cloned in the same way, using cat-specific and consensus primers. Rapid amplification of complementary DNA ends (RACE) was performed to sequence the ends of the mRNA. RACE products were cloned and sequenced as above. Sequence alignments were performed using commercial software (Vector NTI).
Oligonucleotides.
5′-ACAGYASCACCTKGAGCCCC-3′, 5′-CCACTGGGGGCTTTGAATGG-3′, 5′-TGGGTACCTGAAGCTGCTGC-3′ and 5′-TCTGCAAGAGAGTCAATGAACAGGG-3′ are forward primers used in cloning fSGLT1. 5′-ATGTCTGCCGAGATCTTGGTGAAA-3′, 5′-GCAGTCCATTGGGCATGAGC-3′, 5′-TRATYKTGGGRCAGTTGCTGGG-3′, and 5′-GTGTCTGTCATCTTCAGCTTCAT-3′ are reverse primers used in cloning fSGLT1. 5′-GATGTTTCAGGCGAGCCTATG-3′ and 5′-TGGCCTGGACCAACAGAAG-3′ are sense primers used in 3′RACE. 5′-GCAGTCCATTGGGCATGAGC-3′, 5′-ATGTCTGCCGAGATCTTGGTGAAA-3′, and 5′-AGGTAGATCTGGATCCTCTTGCCTC-3′ are reverse primers used in 5′RACE.
Preparation of brush border membrane vesicles.
Brush border membrane vesicles (BBMV) were prepared from frozen samples of intestine using magnesium precipitation and differential centrifugation, as described previously (35). BBMV were suspended in buffer containing 300 mmol/l mannitol, 20 mmol/l 4-(2-hydroxyethyl)-1-piperazineethanesulfonic acid/tris(hydroxymethyl)aminomethane (HEPES/Tris) pH 7.4 and 0.1 mmol/l MgSO4. All uptake experiments were performed using freshly prepared BBMV; BBMV for disaccharidase assays were stored at −80°C until use.
Protein assay.
Protein concentration of BBMV samples was determined by measuring the binding of Coomassie Brilliant Blue in acidic solution (Bio-Rad technique). Porcine γ-globulin was used to produce each standard curve.
Measurement of Na+-dependent glucose transport into BBMV.
Uptake of d-[U14C]glucose by BBMV was measured using the rapid filtration stop technique, as described previously (36). Glucose transport was determined in the presence of either 100 mmol/l sodium thiocyanate (NaSCN) or 100 mmol/l potassium thiocyanate (KSCN) and in triplicate. For kinetic studies, glucose concentrations of 0.01 mmol/l to 2.5mmol/l were used. To assess the activity of any potential facilitated glucose transporter, the initial rate of uptake of 2-deoxy-d-glucopyranoside, a specific substrate of Na+-independent glucose transporter isoforms (GLUT), into BBMV was determined. For the latter, the incubation medium consisted of 270 mmol/l mannitol, 20 mmol/l HEPES/Tris (pH 7.4), 0.1 mmol/l MgSO4, 0.02% (wt/vol) NaN3 and 33 mmol/l [U-14C]-2-deoxy-d-glucopyranoside.
Western blot analysis.
The abundance of SGLT1 protein in cellular homogenates and BBMV was determined by Western blotting, as described previously (31). Protein components of BBMV were separated by SDS-PAGE on 8% (wt/vol) polyacrylamide minigels, containing 0.1% (wt/vol) SDS, and electrotransferred to PVDF membrane. PVDF membranes were incubated for 1 h at room temperature in PBS-TM [PBS containing 0.5% (wt/vol) nonfat dried milk and 0.05% (vol/vol) Tween-20] and then incubated for 1 h with a 1:1,000 dilution of anti-SGLT1 antibody in PBS-TM. The antibody to SGLT1 was raised in rabbits to a synthetic peptide corresponding to amino acids 402–420 (STLFTMDIYTKIRKKASEK), an intracellular loop region of SGLT1 that is conserved among various species (13, 18). Immunoreactive bands were detected by incubation for 1 h with affinity-purified horseradish peroxidase-linked anti-rabbit secondary antibody (DAKO) diluted 1:2,000 in PBS-TM, and visualized using an enhanced chemiluminescence system (GE Healthcare). The intensity of immunoreactive bands was quantified using scanning densitometry (Phoretix). The PVDF membranes were stripped by 3 × 10-min washes in 137 mM NaCl, 20 mM glycine/HCl, at pH 2.5 and then probed with a monoclonal antibody to β-actin (1:10,000; clone AC-15; Sigma Aldrich) as a loading control. To determine potential presence of GLUT2 in the BBMV, PVDF membranes were probed with antibodies to GLUT2 (either raised against the COOH-terminus or residues 40–55 of GLUT2 amino acid sequence). The procedure was as described for SGLT1, except that the blocking reagent that was used consisted of buffer, PBS-TE [PBS, 0.1% (vol/vol) Triton X-100, and 0.1 mM EDTA] with 5% (wt/vol) nonfat dried milk, and PVDF membranes were incubated with GLUT2 antibodies diluted 1:1,000 in PBS-TE + 1% (wt/vol) nonfat dried milk.
Immunohistochemistry for determining expression of SGLT1, GLUT2, T1R2, and T1R3, and quantitative immunohistochemistry for SGLT1.
Immunohistochemistry was performed as previously described (13). Frozen fixed tissue was cut into 10-μm sections, followed by a 1-h incubation in blocking solution [10% (vol/vol) donkey serum in PBS], at 25°C in a humidifier chamber. Sections were incubated for 16 h at 4°C with the primary antibody. The antibody to SGLT1 was the same as used in Western blot analysis (see above). One of the antibodies used for immunohistochemical localization of GLUT2 was raised in rabbits to a peptide (AAVEMEFLGATETA) corresponding to amino acids 511–524 of equine GLUT2. The other antibody to GLUT2 (ab1342; Millipore, UK) was raised against a peptide (SHYRHVLGVPLDDRRA) corresponding to residues 40–55 of rat GLUT2. These sequences are conserved in GLUT2 in various species (13). The antibodies to T1R2 (H-90) and T1R3 (H-145) were raised in rabbits and obtained from Santa Cruz Biotechnology. For coexpression of T1R2 and T1R3 in dog intestine the antibody to T1R2 (T-20; Santa Cruz Biotechnology) was raised in goats. Slides were then washed and stained using a 1:500 dilution of secondary antibodies, either Cy3 or FITC-conjugated donkey anti-rabbit/anti-goat IgG (Jackson Healthcare) and incubated for 1 h at room temperature. The composition of the buffer containing antibodies was 2.5% donkey serum, 0.25% Na azide, 0.2% (vol/vol) Triton X-100 in PBS. Immunofluorescent labeling was visualized using an epifluorescence microscope (Nikon), and images were captured with a Hamamatsu digital camera (C4742–96-12G04; Hamamatsu Photonics). Omission of primary antibodies was routinely used as the control. Images for double immune staining of dog intestinal T1R2 and T1R3 were merged using Imaging Products Laboratory imaging software (Nikon).
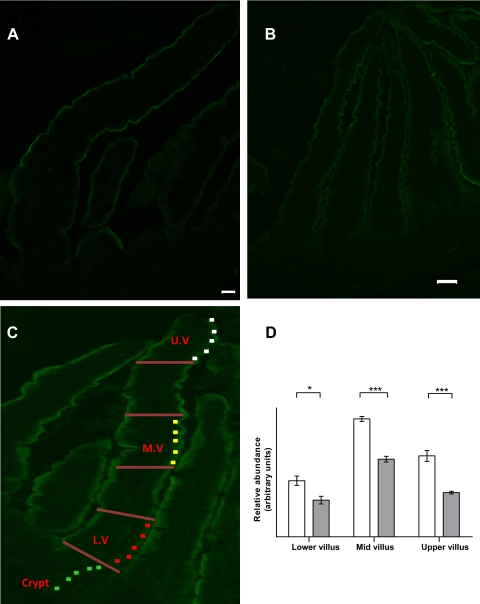
The amount of specific fluorescent labeling for SGLT1 was determined as follows and has been published previously (31). Images were captured using IP lab (Nikon). Quantitative analyses were carried out using MetaMorph (MDS Analytical Technologies). Each stage in the process was standardized. Villi assessed for quantitative analysis were subject to strict criteria; each being well orientated and intact, with SGLT1 labeling along both sides of the villus. Parameters for image acquisition were set to make sure that each fluorescent signal was in the linear range. Each villus was divided into five equal areas lengthwise from villus tip to the crypt/villus junction (see the diagram in Fig. 5C). The first, third, and fifth areas were designated as upper villus (UV), middle villus (MV), and lower villus (LV), respectively. Analyses were carried out in these areas, eliminating the assessment of overlapping areas. Five regions of interest, 16 pixels in size, were positioned over the brush border membrane. The integrated intensity for each region of interest was recorded, and the average value was normalized to that in the crypt (which has negligible SGLT1 signal). Five villi were measured per slide for three sections, five sections apart, for each animal. A five-section gap between quantified sections was used to ensure that the same villus was not accidentally measured twice.
Fig. 5.
Immunofluorescent localization and measurement of SGLT1 protein abundance along the crypt-villus axis of dogs and cats. A and B: representative immunofluorescent images showing labeling for SGLT1 protein along the length of the villi in the dog (A) and cat (B). There is negligible labeling in the crypts. ×100 magnification; scale bar = 10 μm. C: diagram showing the areas used for measurement of SGLT1 abundance in lower, mid and upper villus (L.V, M.V, and U.V). D: histogram comparing SGLT1 protein abundance in three regions of the villus in dogs (open bars) and cats (gray bars). Results are shown as means with SD. Significant difference *P < 0.05, ***P < 0.001.
Morphometry.
Morphometric analysis was performed on 10-μm cross sections prepared from frozen intestinal sections, stained with hematoxylin and eosin. Digital images were captured and analyzed using ImageJ software (Wayne Rasband, National Institutes of Health, USA), calibrated using a 100-μm gradient slide. Villus height was measured as the average distance from crypt-villus junction to villus tip from an average of sixteen well-oriented villi per section, from at least eight different cross sections per tissue segment. Crypt depth was calculated as the distance from crypt base to crypt-villus junction for each specimen.
Disaccharidase enzyme assay.
Disaccharidase assays were performed on the basis of the method of Dahlqvist (10). BBMV were diluted in a buffer (300 mmol/l mannitol, 20 mmol/l HEPES/Tris pH 7.4 and 0.1 mmol/l MgSO4) to the desired concentration. Diluted membrane vesicles were incubated at 38°C in reaction buffer containing 56 mmol/l lactose, maltose, or sucrose (depending on the assay) and 100 mmol/l Na maleate pH 6.0 for 15 min. For lactase assay, 200 mmol/l 4-chloromercuribenzoate was included in the reaction buffer to inhibit lysosomal lactase. Reactions were stopped by immersion in boiling water for 2 min, and glucose concentration in the reaction mixtures was measured using a commercial kit for d-glucose (Roche), from which enzyme activity was calculated (17, 35).
Statistical analysis.
Commercial software (GraphPad Prism 5) was used for statistical analysis. Continuous variables were shown to be normally distributed using the Shapiro-Wilk method. Analysis of changes in Na+-dependent glucose uptake along the length of the small intestine and SGLT1 expression along the crypt-villus axis (lower villus compared with middle and upper villus) were determined using two-way ANOVA. A Bonferroni post hoc test was used to determine differences in SGLT1 expression between species in lower, middle, and upper villus. All other statistical analyses were performed using Student's t-test. The level of statistical significance was set at P < 0.05.
RESULTS
Nucleotide and amino acid sequence of fSGLT1.
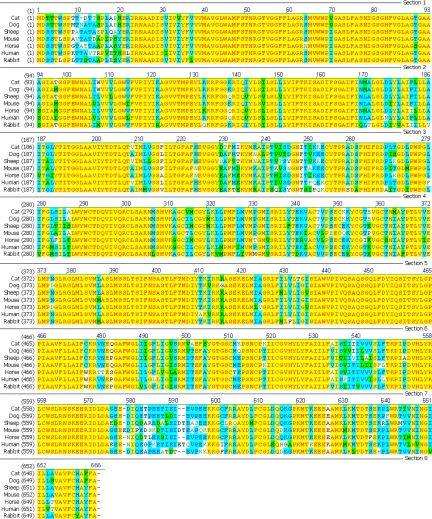
Comparison of the amino acid sequences of cat, dog, horse, human, rabbit, mouse and sheep SGLT1 is shown in Fig. 1. The feline sequence is most closely related to that of the dog. The fSGLT1 coding sequence has 84–93% identity, and the amino acid sequence has 92–97% similarity and 85–93% identity with that from other species. SGLT1 is N-glycosylated at Asn248 in other species (40); this asparagine residue is conserved in the cat. The cat shares hypervariable regions at amino acids 6–22 and 576–600 with other species, shares a two-amino acid deletion at positions 592–593 with the dog, horse and rabbit, and has a single amino acid deletion at position 11, not seen in other species. The peptide used for production of the polyclonal antibody to SGLT1 is the 19-amino acid polypeptide from position 402–420 of the sequence (13), an intracellular loop that corresponds to the cytoplasmic loop between transmembrane helices 9 and 10 (38). In this region the fSGLT1 amino acid sequence is identical to that in the horse and one amino acid different to the rabbit (with arginine substituted for lysine at position 416; both these amino acids have basic side chains). The GenBank accession number for the nucleotide sequence of fSGLT1 is HQ014365.
Fig. 1.
Alignment of sodium/glucose cotransporter 1 (SGLT1) amino acid sequence in cat, dog, sheep, mouse, horse, human, and rabbit. The cat sequence is most closely related to that in the dog, with 97% similarity and 93% identity.
Membrane origin and purity of membrane vesicles.
The membrane origin of membrane vesicles was determined by determining the enrichment of the brush border membrane markers maltase and SGLT1 in membrane vesicles compared with crude cellular homogenates. Compared with homogenates, maltase activity was 10- to 11-fold higher in membrane vesicle preparations in both species (data not shown). Western blot analysis showed 15- to 18-fold enrichment of SGLT1 in membrane vesicles compared with homogenates (not shown) supporting that membrane vesicles originated from the intestinal brush border membrane. Furthermore, Western blotting showed no detectable GLUT2 protein, a classical intestinal basolateral membrane marker, in the BBMV, confirming that membrane vesicles were devoid of any contamination with the basolateral membrane.
Properties of sodium-dependent glucose transport, and SGLT1 protein abundance in BBMV isolated from cat and dog intestine.
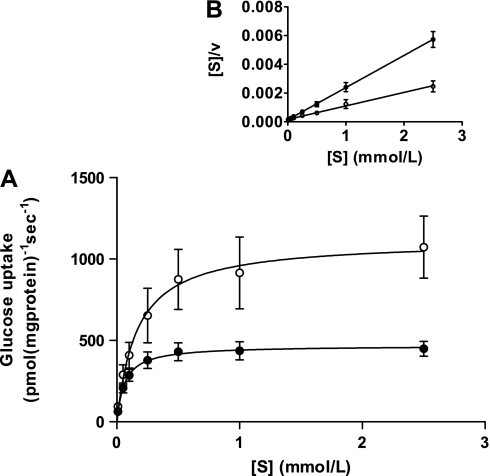
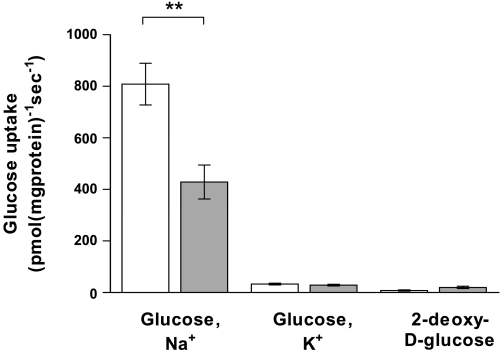
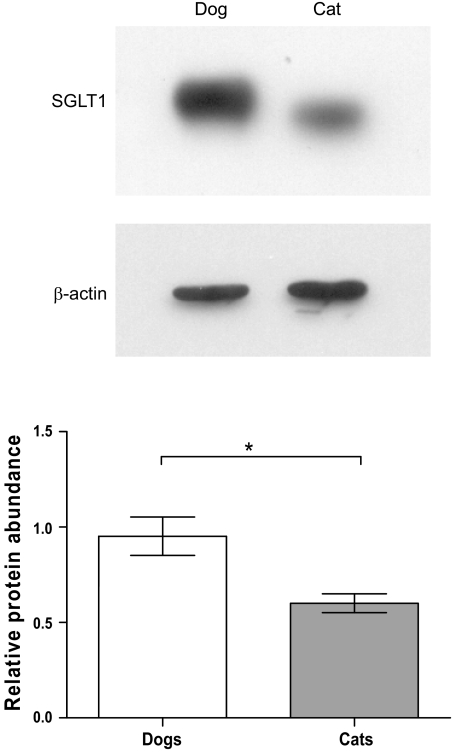
The properties of glucose transport into BBMV isolated from the midintestine of four cats and four dogs indicated that the transport is Na+ dependent. Time course studies of Na+-dependent glucose transport into BBMV confirmed that 3 s is a suitable time point to measure initial rate of uptake (data not shown). Initial rates of glucose transport into BBMV in the presence of a 100 mmol/l NaSCN gradient (out > in) showed a typical Michaelis-Menten curve (Fig. 2), with dogs showing >2-fold higher maximal rate of transport compared with cats. In dogs, maximal rate of transport (Vmax) was 1,116 pmol·mg protein−1·s−1 [95% confidence interval (CI) 856 to 1,377], and the Michaelis-Menten constant (Km) was 0.16 mmol/l (95% CI 0.02 to 0.30). In cats, Vmax was 468 pmol·mg protein−1·s−1 (95% CI 412 to 524) and Km was 0.06 mmol/l (95% CI 0.03 to 0.10). A plot of glucose concentration ([S])/initial rate (v) against [S] showed a single straight line for each species (Fig. 2, inset). Initial rates of glucose transport into BBMV, isolated from the middle intestine of all 10 cats and 12 dogs, at glucose concentration 3 × Km were measured (Fig. 3). In the presence of Na+, mean rate of transport was 1.9-fold higher in dogs (809 pmol·mg protein−1s−1, SD 242) than in cats (429 pmol·mg protein−1·s−1, SD 208) (P = 0.0019). When Na+ in the incubation medium was replaced with K+, the rates were reduced to 33 (SD 9) and 29 (SD 6) pmol·mg protein−1·s−1 for dogs and cats, respectively. The rates of 2-deoxy-d-glucopyranoside uptake into the same population of BBMV, when measured at 33 mM, 3 × Km; Km = 11 mM for 2-deoxy-d-glucose (2), were negligible and similar to glucose uptake in the presence of a K+ gradient. Western blot analysis of BBMV isolated from midintestine showed a 1.6-fold higher abundance of SGLT1 protein in dogs compared with cats (P = 0.039, Fig. 4).
Fig. 2.
Kinetics of sodium-dependent glucose transport into brush border membrane vesicles (BBMV). A: plot of initial rate of sodium-dependent glucose transport into BBMV (v) against glucose concentration ([S]) in dogs (○) and cats (●). Vmax is significantly (twofold) higher in dogs than in cats (P < 0.0001). B: Hanes plot of [S]/v against v.
Fig. 3.
Histograms showing initial rates of uptake of d-glucose into BBMV in the presence of 100 mmol/l NaSCN (glucose, Na+) or 100 mmol/l KSCN (glucose, K+), and initial rate of uptake of 2-deoxy-d-glycopyranoside into BBMV (2-deoxy-d-glucose) in dogs (open bars) and cats (gray bars). Significant difference **P < 0.01.
Fig. 4.
Representative Western blots (top), showing SGLT1 and β-actin protein abundance in BBMV prepared from the middle intestine of dogs and cats. Densitometric scans of Western blots normalized to β-actin are presented as histograms (bottom); dogs (open bar) and cats (gray bar). Results are shown as mean with SD. Significant difference *P < 0.05.
Quantitative immunohistochemistry.
Routine histology (hematoxylin/eosin staining) confirmed that the fixed sections of dog and cat intestine were intact, with epithelial cells attached. Immunohistochemistry showed expression of SGLT1 along the entire length of the villus in both dogs and cats, with no SGLT1 expressed in the crypt as shown in other species (13, 15, 31) (see Fig. 5, A and B). In both species, expression was mid > upper > lower villus. Quantitative immunohistochemistry showed that dogs express significantly more SGLT1 than cats at the lower villus (1.5-fold, P = 0.018), middle villus (1.5-fold, P < 0.0001), and upper villus (1.8-fold, P = 0.0006) (see Fig. 5D).
Pattern of glucose uptake and SGLT1 protein abundance along the length of the small intestine.
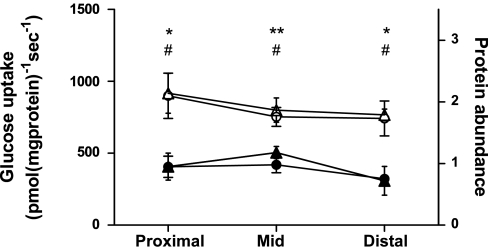
Initial rate of Na+-dependent glucose transport was also measured in BBMV from the proximal and distal regions of the small intestine. There were no significant differences in glucose transport between regions of the small intestine in dogs or in cats (Fig. 6). In all three regions, transport in dogs was 1.9–2.3 fold higher than in the corresponding region in cats (P = 0.037, P = 0.0011, P = 0.027, respectively).
Fig. 6.
Comparison of initial rate of Na+-dependent uptake of d-glucose into BBMV prepared from regions along the length of the small intestine in dogs (○) and cats (●), measured in pmol·mg protein−1·s−1, matched to SGLT1 protein abundance in the same BBMV prepared from dogs (▵) and cats (▴), measured by Western blot and given in arbitrary units. Results are shown as means with SD. Significant difference in initial rate of glucose uptake *P < 0.05, **P < 0.01. Significant difference in protein abundance #P < 0.05.
There were no significant differences in SGLT1 protein abundance between regions of the small intestine in dogs or in cats. In all three regions, SGLT1 protein abundance in dogs was 1.6- to 2.3-fold higher than in the corresponding region in cats (P = 0.016, P = 0.039, P = 0.013, respectively). SGLT1 protein abundance was closely matched to Na+-dependent glucose transport in all three regions (Fig. 6).
Pattern of disaccharidase activity along the length of the small intestine.
Disaccharidase activity was measured in BBMV isolated from the proximal, middle, and distal regions of the small intestine (Table 1). In the proximal and middle regions there were 3.1 and 1.6-fold higher lactase (P = 0.006 and P = 0.019), 4.4 and 2.9-fold higher sucrase (both P < 0.0001), and 4.6 and 3.1-fold higher maltase activity (P = 0.0026 and P = 0.0005), respectively, in the dog intestine compared with that of the cat. Enzyme activities were lower in the distal intestine in both species.
Table 1.
Disaccharidase activity in purified brush border membrane vesicles isolated from proximal, middle, and distal regions of the small intestine of dogs and cats
| Specific Activity, nmol mg−1 min−1 |
|||
|---|---|---|---|
| Region of Small Intestine |
|||
| Proximal | Middle | Distal | |
| Dogs (n = 12) | |||
| Lactase | 254 ± 32 | 309 ± 31 | 40 ± 9 |
| Sucrase | 302 ± 61 | 234 ± 33 | 158 ± 39 |
| Maltase | 1627 ± 158 | 1241 ± 158 | 759 ± 222 |
| Cats (n = 10) | |||
| Lactase | 82 ± 36 | 188 ± 22 | 100 ± 11 |
| Sucrase | 68 ± 11 | 82 ± 5 | 113 ± 10 |
| Maltase | 355 ± 57 | 400 ± 24 | 479 ± 52 |
Values are given as means ± SD.
Morphometry.
There were no differences in villus length or crypt depth between dogs and cats (data not shown).
Expression of GLUT2.
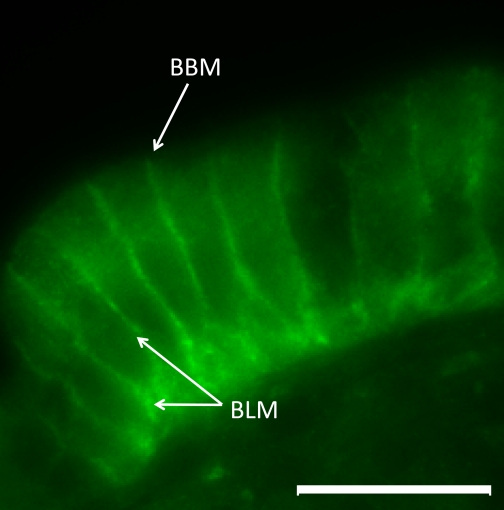
Immunohistochemistry using antibodies raised to either the COOH-terminal region of GLUT2, or to residues 40–55 of GLUT2 located this protein on the basolateral membranes of enterocytes, with no staining at the BBM, in the intestines of both dogs and cats (Fig. 7, a typical representation of GLUT2 expression in the intestine of either cats or dogs).
Fig. 7.
A representative image showing immunofluorescent localization of GLUT2 in the intestinal mucosa of dogs or cats. Signal for GLUT2 is observed along the basolateral membrane of enterocytes, with no detectable signal at the brush border membrane. ×1,000 magnification, scale bar = 10 μm. BBM, brush border membrane; BLM, basolateral membrane.
Immunodetection of T1R2 and T1R3.
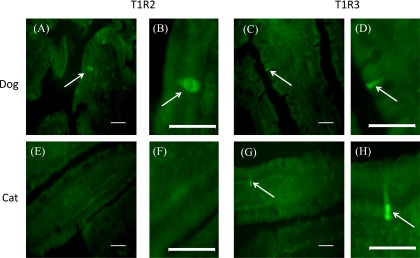
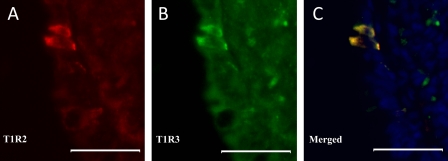
Frozen sections of the intestine from cats and dogs were probed with antibodies to T1R2 and T1R3, subunits of the intestinal sweet receptor (15, 30). In contrast to SGLT1, expressed on the luminal membrane of epithelial cells of the entire villus (see Fig. 5, A and B), T1R2 in dog intestine was present only in a subset of cells likely to be enteroendocrine cells, as shown in other species (30, 32) (Fig. 8, A and B). There was no labeling for T1R2 in any region of the cat intestine along the entire crypt-villus axis (Fig. 8, E and F). When the same sections of the intestine from cats and dogs were incubated with the antibody to T1R3, in both species, T1R3 was expressed in a subpopulation of cells [Fig. 8, C and D (dog) and G and H (cat)]; with T1R2 and T1R3 coexpressed in the same cell (Fig. 9).
Fig. 8.
Immunofluorescent detection of T1R2 and T1R3 proteins in the intestinal mucosa of dogs T1R2 (A and B) and T1R3 (C and D); cats T1R2 (E and F) and T1R3 (G and H). ×200 magnification; scale bar = 10 μm for A, C, E and G. B, D, F, and H are higher magnifications of the same areas at ×1,000 magnification; scale bar = 10 μm.
Fig. 9.
Colocalization of T1R2 and T1R3 in a subset of epithelial cells of the intestinal mucosa of dogs. Double immune-staining of frozen sections of small intestine was used for immunofluorescent detection of T1R2 (A, red) and T1R3 (B, green). The images have been merged and show colocalization of T1R2 and T1R3 in the same cells (C, yellow). C: nuclei are stained blue with 4',6-diamidino-2-phenylindole (DAPI). Scale bar = 15 μm.
DISCUSSION
Domestic dogs are descended from wolves (Canis lupus) and are closely related to coyotes (Canis latrans). Wolves eat predominantly meat in the habitats in which they are found today, although they may have eaten a more wide-ranging diet before widespread persecution by humans (5). They are both predators and scavengers, and their natural prey is large herbivorous animals such as deer, elk, and buffalo. Viscera of these prey animals are eaten and so partially digested vegetable material forms part of the wolf's natural diet (11). Coyotes and jackals, also in the genus Canis, eat fruit and other plant materials when prey is scarce (5). Similar to the other members of the genus Canis, dogs are opportunistic in their eating behavior, and their anatomy and physiology are adapted to a varied diet. The ratio of gastrointestinal (GI) tract length to total body length is 6:1, consistent with an omnivorous diet intermediate in digestibility (for comparison, in the carnivorous cat, the ratio is 4:1, and in herbivores, the ratio is 10–20:1) (11).
Cats are descended from the African wildcat Felis silvestris lybica. They are obligate carnivores, naturally consuming small rodents and birds (high in protein, with moderate fat, and very small amounts of carbohydrate), and are much more specialized predators than wolves. The GI tract of cats is comparatively short (26). Cats are metabolically adapted to their diet of principally protein and fat. They have a greater dietary protein requirement than omnivorous species, partly because they use amino acids for energy and are unable to downregulate catabolism of amino acids (9, 42). They lack salivary amylase and have minimal activity of hepatic glucokinase (responsible for phosphorylation of glucose prior to storage or oxidation) (3) and hepatic glycogen synthetase (21, 22). They are, thus, vulnerable to hyperglycemia following ingestion of high-carbohydrate meals. Surprisingly, despite these features, many commercial cat diets contain relatively high levels of carbohydrate.
In this study, we have addressed the question of how the evolutionary diets of dogs and cats correspond with the intestinal capacity to digest and absorb dietary carbohydrates. It has been reported that dogs have much higher activity of pancreatic amylase compared with cats (21), supporting the higher ability to hydrolyze soluble carbohydrates in dogs' intestine compared with cats. Furthermore, we have shown here that activities of lactase, maltase, and sucrase are ∼1.5- to 4.5-fold higher in the intestine of dogs compared with cats, providing dogs with a higher ability to hydrolyze disaccharides. Both species express lactase, dogs 1.6- to 3.1-fold more than cats, indicating that they can consume milk in adulthood, although adult cats can develop diarrhea if given too much milk (26).
We have demonstrated that expression of the intestinal glucose transporter, SGLT1, is approximately twofold higher in the intestine of dogs compared with cats, as shown by a twofold higher Vmax and supported by measurements of SGLT1 protein abundance by quantitative immunohistochemistry and Western blot analysis. This increase is not due to any structural changes; the morphometric analysis indicates that villus height and crypt depth are the same in cats and dogs. While cDNA encoding SGLT1 has been cloned in a number of species, there was no information on sequence of fSGLT1. This knowledge was necessary to assess the suitability of our antibody raised to the peptide STLFTMDIYTKIRKKASEK used successfully to measure SGLT1 expression in BBMV isolated from the intestine of a number of species (13, 14, 16, 17, 30, 31, 39). In cats, this sequence is very similar to other species and is identical to that in the horse. It is of interest that the cat nucleotide and amino acid sequences are most closely related to that of the dog, which may reflect their close ancestral relationship.
It has been shown that the capacity of the intestine to absorb glucose is enhanced in response to high concentrations of dietary carbohydrate in many species (8, 12–14, 17, 27, 37, 39). Using wild-type and knockout rodent models, we have demonstrated that the sweet taste receptor subunit T1R3 and the transducer G-protein gustducin are expressed in enteroendocrine cells. They are required for SGLT1 upregulation in response to luminal sugars or sweeteners (30). In wild-type mice kept on a high-carbohydrate (70%) diet for either 2 wk (30) or 3 h (unpublished data), SGLT1 expression was twofold higher than in mice fed a low-carbohydrate (1.9%) diet. However, gustducin- and T1R3-knockout mice showed no change in SGLT1 expression. On either diet, the expression of SGLT1 in knockout mice was identical to that of wild-type animals on the low-carbohydrate diet. This suggested that there is a constitutive pathway, independent of luminal sugar sensing by the sweet receptor, that maintains the basal expression of SGLT1, and an inducible pathway initiated through the sugar activation of T1R2/T1R3, resulting in enhanced expression of SGLT1 (30). In addition, we have recently shown that when piglets were maintained on isocaloric diets containing increasing concentrations of carbohydrate (7%, 36%, 53%, or 60%), SGLT1 expression remained constant on low-moderate carbohydrate diets, but there was an increase in SGLT1 expression when the carbohydrate content of the diet exceeded 50% (31). Collectively, the data indicate that the intestine has capacity to absorb glucose via the basal level of SGLT1, but this becomes limiting when dietary carbohydrate exceeds a certain limit.
Cats have a limited capacity to digest and metabolize carbohydrate (21–25), but they can absorb some dietary sugar and starches (33). As shown in this study, cats do express SGLT1, and it is likely that this level of SGLT1 is sufficient for absorbing the carbohydrate content of their natural diet. It has been shown, however, that cats are unable to upregulate intestinal glucose transport in response to increased dietary carbohydrate (8). Indeed, the gene for T1R2 is not expressed in cats (28). Furthermore, it has been demonstrated that T1R2 protein is not present in cats' lingual epithelium (unpublished data), and here, we show that this sweet receptor subunit is not expressed in their intestine. The findings provide a good explanation for cats' lack of preference for sweet (29) and their inability to upregulate SGLT1 in response to high dietary carbohydrates (8). The lack of ability to upregulate the intestinal capacity to transport glucose suggests that high-carbohydrate diets are unsuitable for cats. Dogs, in contrast, are known to taste sweet (4, 20), and have been shown to have the genes encoding for the sweet taste receptor subunits, T1R2 and T1R3 (34). In addition, we have shown here that they express T1R2 and T1R3 proteins in their intestine, providing the means for SGLT1 upregulation.
Using immunohistochemistry, with the antibody to residues 40–55 of GLUT2, the classical intestinal basolateral membrane monosaccharide transporter, Affleck et al. (1) have proposed that this antibody detects GLUT2 on the brush border membrane of rat enterocytes. The data presented, however, are open to interpretations that differ from the conclusions made. Using immunohistochemistry, we have shown in this study and also in our other studies (13, 31, 32) that both GLUT2 antibodies raised to peptides corresponding to either the COOH terminus or residues 40–55 of GLUT2 sequence, react with a protein exclusively located on the intestinal basolateral membrane in cats and dogs (this study), horses (13), and pigs (31, 32). In addition, there was negligible uptake of 2-deoxy-d-glucose, a substrate transported by GLUT proteins, in BBMV isolated from the intestines of cats and dogs. It is notable that the same population of BBMV had the ability to transport glucose in a Na+-dependent manner.
Collectively, our data indicate that glucose transport across the luminal membrane of cat and dog intestine is achieved mainly by SGLT1. Furthermore, cat intestine provides a naturally occurring T1R2 knockout model, supporting the requirement for the presence of the T1R2/T1R3 heterodimer for SGLT1 upregulation and that the T1R3 alone cannot act as the intestinal sweet receptor.
Perspectives and Significance
Intestinal carbohydrate digestive and absorptive functions are significantly higher in the intestine of the carno-omnivorous dog compared with the carnivorous cat, demonstrating a good correlation in the adaptive response of the intestinal function to the dietary characteristics. Furthermore, there is a strong association between the absence of T1R2, a subunit of the intestinal glucose sensor, and reduced expression levels of intestinal glucose transport. A better understanding of the molecular and cellular mechanisms involved in digestion and absorption of nutrients will assist in the rational formulation of diets and avoidance of malabsorption.
GRANTS
D. Batchelor is supported by a Doctoral Training Grant provided by the Biotechnology and Biological Sciences Research Council and Pfizer (UK), and M. Al-Rammahi is supported by a doctoral fellowship awarded by the Iraqi Ministry of Higher Education and Scientific Research. A. Moran is a postdoctoral fellow funded by Pancosma. Work in the laboratory of M. Haskins is supported by National Institutes of Health Grant PR02512.
DISCLOSURES
No conflicts of interest, financial or otherwise, are declared by the authors.
REFERENCES
- 1. Affleck JA, Helliwell PA, Kellett GL. Immunocytochemical detection of GLUT2 at the rat intestinal brush-border membrane. J Histochem Cytochem 51: 1567–1574, 2003 [DOI] [PMC free article] [PubMed] [Google Scholar]
- 2. Arbuckle MI, Kane S, Porter LM, Seatter MJ, Gould GW. Structure-function analysis of liver-type (GLUT2) and brain-type (GLUT3) glucose transporters: expression of chimeric transporters in Xenopus oocytes suggests an important role for putative transmembrane helix 7 in determining substrate selectivity. Biochemistry 35: 16519–16527, 1996 [DOI] [PubMed] [Google Scholar]
- 3. Ballard F. Glucose utilization in mammalian liver. Comp Biochem Physiol 14: 437–443, 1965 [DOI] [PubMed] [Google Scholar]
- 4. Bradshaw JW. Sensory and experiential factors in the design of foods for domestic dogs and cats. Proc Nutr Soc 50: 99–106, 1991 [DOI] [PubMed] [Google Scholar]
- 5. Bradshaw JW. The evolutionary basis for the feeding behaviour of domestic dogs (Canis familiaris) and cats (Felis catus). J Nutr 136: 1927S–1931S, 2006 [DOI] [PubMed] [Google Scholar]
- 6. Buddington RK. Does the natural diet influence the intestine's ability to regulate glucose absorption? J Comp Physiol [B] 157: 677–688, 1987 [DOI] [PubMed] [Google Scholar]
- 7. Buddington RK. Intestinal nutrient transport during ontogeny of vertebrates. Am J Physiol Regul Integr Comp Physiol 263: R503–R509, 1992 [DOI] [PubMed] [Google Scholar]
- 8. Buddington RK, Chen JW, Diamond JM. Dietary regulation of intestinal brush-border sugar and amino acid transport in carnivores. Am J Physiol Regul Integr Comp Physiol 261: R793–R801, 1991 [DOI] [PubMed] [Google Scholar]
- 9. Buddington RK, Diamond J. Ontogenetic development of nutrient transporters in cat intestine. Am J Physiol Gastrointest Liver Physiol 263: G605–G616, 1992 [DOI] [PubMed] [Google Scholar]
- 10. Dahlqvist A. Method for assay of intestinal disaccharidases. Anal Biochem 7: 18–25, 1964 [DOI] [PubMed] [Google Scholar]
- 11. Debraekeleer J, Gross KL, Zicker SC. Normal dogs. In: Small Animal Clinical Nutrition, edited by Hand MS, Thatcher CD, Remillard RL, Roudebush P. Topeka, Kansas: Walsworth, 2000, p. 213–219 [Google Scholar]
- 12. Diamond JM, Karasov WH, Cary C, Enders D, Yung R. Effect of dietary carbohydrate on monosaccharide uptake by mouse small intestine in vitro. J Physiol 349: 419–440, 1984 [DOI] [PMC free article] [PubMed] [Google Scholar]
- 13. Dyer J, Al-Rammahi M, Waterfall L, Salmon KS, Geor RJ, Boure L, Edwards GB, Proudman CJ, Shirazi-Beechey SP. Adaptive response of equine intestinal Na+/glucose co-transporter (SGLT1) to an increase in dietary soluble carbohydrate. Pflügers Arch 458: 419–430, 2009 [DOI] [PubMed] [Google Scholar]
- 14. Dyer J, Barker PJ, Shirazi-Beechey SP. Nutrient regulation of the intestinal Na+/glucose co-transporter (SGLT1) gene expression. Biochem Biophys Res Commun 230: 624–629, 1997 [DOI] [PubMed] [Google Scholar]
- 15. Dyer J, Daly K, Salmon KS, Arora DK, Kokrashvili Z, Margolskee RF, Shirazi-Beechey SP. Intestinal glucose sensing and regulation of intestinal glucose absorption. Biochem Soc Trans 35: 1191–1194, 2007 [DOI] [PubMed] [Google Scholar]
- 16. Dyer J, Fernandez-Castano ME, Salmon KS, Proudman CJ, Edwards GB, Shirazi-Beechey SP. Molecular characterisation of carbohydrate digestion and absorption in equine small intestine. Equine Vet J 34: 349–358, 2002 [DOI] [PubMed] [Google Scholar]
- 17. Dyer J, Hosie KB, Shirazi-Beechey SP. Nutrient regulation of human intestinal sugar transporter (SGLT1) expression. Gut 41: 56–59, 1997 [DOI] [PMC free article] [PubMed] [Google Scholar]
- 18. Dyer J, Vayro S, King TP, Shirazi-Beechey SP. Glucose sensing in the intestinal epithelium. Eur J Biochem 270: 3377–3388, 2003 [DOI] [PubMed] [Google Scholar]
- 19. Ferraris RP, Diamond J. Regulation of intestinal sugar transport. Physiol Rev 77: 257–302, 1997 [DOI] [PubMed] [Google Scholar]
- 20. Grace J, Russek M. The influence of previous experience on the taste behavior of dogs towards sucrose and saccharin. Physiol Behav 4: 553–558, 1968 [Google Scholar]
- 21. Kienzle E. Carbohydrate metabolism of the cat. 1. Activity of amylase in the gastrointestinal tract of the cat. J Anim Physiol Anim Nutr 69: 92–101, 1993 [Google Scholar]
- 22. Kienzle E. Carbohydrate metabolism of the cat. 2. Digestion of starch. J Anim Physiol Anim Nutr 69: 102–114, 1993 [Google Scholar]
- 23. Kienzle E. Carbohydrate metabolism of the cat. 3. Digestion of sugars. J Anim Physiol Anim Nutr 69: 203–210, 1993 [Google Scholar]
- 24. Kienzle E. Carbohydrate metabolism of the cat. 4. Activity of maltase, isomaltase, sucrase and lactase in the gastrointestinal tract in relation to age and diet. J Anim Physiol Anim Nutr 70: 89–96, 1993 [Google Scholar]
- 25. Kienzle E. Effect of carbohydrates on digestion in the cat. J Nutr 124: 2568S–2571S, 1994 [DOI] [PubMed] [Google Scholar]
- 26. Kirk C, Debraekeleer J, Armstrong PJ. Normal cats. In: Small Animal Clinical Nutrition, edited by Hand MS, Thatcher CD, Remillard RL, Roudebush P. Topeka, Kansas: Walsworth, 2000, p. 291–303 [Google Scholar]
- 27. Lescale-Matys L, Dyer J, Scott D, Freeman TC, Wright EM, Shirazi-Beechey SP. Regulation of the ovine intestinal Na+/glucose co-transporter (SGLT1) is dissociated from mRNA abundance. Biochem J 291: 435–440, 1993 [DOI] [PMC free article] [PubMed] [Google Scholar]
- 28. Li X, Li W, Wang H, Cao J, Maehashi K, Huang L, Bachmanov AA, Reed DR, Legrand-Defretin V, Beauchamp GK, Brand JG. Pseudogenization of a sweet-receptor gene accounts for cats' indifference toward sugar. PLoS Genet 1: 27–35, 2005 [DOI] [PMC free article] [PubMed] [Google Scholar]
- 29. MacDonald ML, Rogers QR, Morris JG. Nutrition of the domestic cat, a mammalian carnivore. Annu Rev Nutr 4: 521–562, 1984 [DOI] [PubMed] [Google Scholar]
- 30. Margolskee RF, Dyer J, Kokrashvili Z, Salmon KS, Ilegems E, Daly K, Maillet EL, Ninomiya Y, Mosinger B, Shirazi-Beechey SP. T1R3 and gustducin in gut sense sugars to regulate expression of Na+-glucose cotransporter 1. Proc Natl Acad Sci USA 104: 15075–15080, 2007 [DOI] [PMC free article] [PubMed] [Google Scholar]
- 31. Moran AW, Al-Rammahi M, Arora DK, Batchelor DJ, Coulter EA, Ionescu C, Bravo D, Shirazi-Beechey SP. Expression of Na+/glucose co-transporter 1 (SGLT1) in the intestine of piglets weaned to different concentrations of dietary carbohydrate. Br J Nutr 104: 647–655, 2010 [DOI] [PubMed] [Google Scholar]
- 32. Moran AW, Al-Rammahi MA, Arora DK, Batchelor DJ, Coulter EA, Daly K, Ionescu C, Bravo D, Shirazi-Beechey SP. Expression of Na+/glucose co-transporter 1 (SGLT1) is enhanced by supplementation of the diet of weaning piglets with artificial sweeteners. Br J Nutr 1–10, 2010 [DOI] [PubMed] [Google Scholar]
- 33. Morris JG, Trudell J, Pencovic T. Carbohydrate digestion by the domestic cat (Felis catus). Br J Nutr 37: 365–373, 1977 [DOI] [PubMed] [Google Scholar]
- 34. Shi P, Zhang J. Contrasting modes of evolution between vertebrate sweet/umami receptor genes and bitter receptor genes. Mol Biol Evol 23: 292–300, 2006 [DOI] [PubMed] [Google Scholar]
- 35. Shirazi-Beechey SP, Davies AG, Tebbutt K, Dyer J, Ellis A, Taylor CJ, Fairclough P, Beechey RB. Preparation and properties of brush-border membrane vesicles from human small intestine. Gastroenterology 98: 676–685, 1990 [DOI] [PubMed] [Google Scholar]
- 36. Shirazi-Beechey SP, Gorvel JP, Beechey RB. Phosphate transport in intestinal brush-border membrane. J Bioenerg Biomembr 20: 273–288, 1988 [DOI] [PubMed] [Google Scholar]
- 37. Shirazi-Beechey SP, Hirayama BA, Wang Y, Scott D, Smith MW, Wright EM. Ontogenic development of lamb intestinal sodium-glucose co-transporter is regulated by diet. J Physiol 437: 699–708, 1991 [DOI] [PMC free article] [PubMed] [Google Scholar]
- 38. Turk E, Kerner CJ, Lostao MP, Wright EM. Membrane topology of the human Na+/glucose cotransporter SGLT1. J Biol Chem 271: 1925–1934, 1996 [DOI] [PubMed] [Google Scholar]
- 39. Wood IS, Dyer J, Hofmann RR, Shirazi-Beechey SP. Expression of the Na+/glucose co-transporter (SGLT1) in the intestine of domestic and wild ruminants. Pflügers Arch 441: 155–162, 2000 [DOI] [PubMed] [Google Scholar]
- 40. Wright EM. The intestinal Na+/glucose cotransporter. Annu Rev Physiol 55: 575–589, 1993 [DOI] [PubMed] [Google Scholar]
- 41. Wright EM, Hirayama BA, Loo DF. Active sugar transport in health and disease. J Intern Med 261: 32–43, 2007 [DOI] [PubMed] [Google Scholar]
- 42. Zoran DL. The carnivore connection to nutrition in cats. J Am Vet Med Assoc 221: 1559–1567, 2002 [DOI] [PubMed] [Google Scholar]


