Abstract
Low extracellular pH (pHe) occurs in a number of clinical conditions and sensitizes to the development of pancreatitis. The mechanisms responsible for this sensitization are unknown. Because abnormal Ca2+ signaling underlies many of the early steps in the pathogenesis of pancreatitis, we evaluated the effect of decreasing pHe from 7.4 to 7.0 on Ca2+ signals in the acinar cell. Low pHe significantly increased the amplitude of cerulein-induced Ca2+ signals. The enhancement in amplitude was localized to the basolateral region of the acinar cell and was reduced by pretreatment with ryanodine receptor (RYR) inhibitors. Because basolateral RYRs also have been implicated in the pathogenesis of pancreatitis, we evaluated the effects of RYR inhibitors on pancreatitis responses in acidic conditions. RYR inhibitors significantly reduced the sensitizing effects of low pHe on zymogen activation and cellular injury. These findings suggest that enhanced RYR-mediated Ca2+ signaling in the basolateral region of the acinar cell is responsible for the injurious effects of low pHe on the exocrine pancreas.
Keywords: Calcium, Calcium Channels, Calcium Imaging, Cell pH, Pancreas, Ryanodine
Introduction
Acute pancreatitis is a common, inflammatory disease of the exocrine pancreas, often caused by alcohol or gallstone disease (1). Clinical conditions associated with an acute acid load, including diabetic ketoacidosis (2), propionic acidemia (3), and lactic acidosis (4–7), are associated with an increased risk or severity of pancreatitis. These disease states can be associated with a systemic pH of 7.0 or lower (8). Reducing extracellular pH (pHe)2 from 7.4 to 7.0 sensitizes acinar cells to pancreatitis responses both in vitro and in vivo in a cerulein model of pancreatitis (9). Other findings also suggest a relationship between acidic conditions and acute pancreatitis. Tissue damage seen with supramaximal stimulation has been linked to luminal acidification that occurs as a result of protons co-released during enzyme secretion (10). Further, when intracellular pH is increased by the weak base, chloroquine, pathologic intraacinar zymogen activation and acinar cell injury are ameliorated, and survival improves in several pancreatitis models (11, 12). Additionally, pathologic zymogen activation observed in hyperstimulation models of pancreatitis requires the activity of a specific proton pump that acidifies intracellular compartments (13). However, the mechanism responsible for the sensitizing effect of low pH is unknown.
Abnormal Ca2+ signaling has been linked to most of the early pathologic acinar cell responses in acute pancreatitis, including premature zymogen activation, inhibition of secretion, and necrosis (14–18). Two distinct Ca2+ release channels, the apical inositol 1,4,5-trisphosphate receptor (IP3R) and the basolateral ryanodine receptor (RYR), generate increases in cytosolic Ca2+ and have been implicated in both physiologic acinar cell responses and in the pathogenesis of acute pancreatitis (16, 19–22). In the context of pancreatitis, the effects of pathophysiologically relevant decreases in pHe on Ca2+ signaling in the acinar cell are unknown. Therefore, we investigated whether the injurious effects of low pHe on the acinar cell are mediated through changes in Ca2+ signaling.
MATERIALS AND METHODS
Preparation and Stimulation of Pancreatic Acini
Acini were isolated from rat pancreas as described (23). Briefly, male Sprague-Dawley rats, ∼50 g, were killed by carbon dioxide narcosis. Acinar medium contained 10 mm HEPES (pH 7.4), 95 mm NaCl, 4.7 mm KCl, 0.6 mm MgCl2, 1 mm NaH2PO4, 10 mm glucose, 2 mm glutamine, plus 0.1% bovine serum albumin, 1 × minimal essential medium amino acids (Invitrogen), and 1.3 mm CaCl2. The pancreas was collected in 15 ml of Ca2+-free acinar medium. The pancreas was then minced in Ca2+-free medium for 5 min and washed three times with Ca2+-free medium. The minced tissue was then placed into a 50-ml flask with 12 ml of acinar medium containing 100–200 units/ml type 4 collagenase (Worthington, Freehold, NJ) for 60 min at 37 °C with shaking (120 rpm). The digest was then washed three times with buffer and manually shaken vigorously to isolate acini (groups of 5–15 acinar cells) for Ca2+ signaling experiments.
For zymogen activation and lactate dehydrogenase (LDH) assays, larger acini (20–200 cells) were isolated by filtration through a 300–400-μm mesh (Sefar American, Depew, NY). Acini were recovered for 120 min at 37 °C under constant O2 with shaking (90 rpm). Medium was changed at 60 min, and pH was adjusted at 105 min. At 120 min, acini were treated with physiologic cerulein (10–100 pm), supramaximal cerulein (100 nm), or carbachol (100 nm) in the presence or absence of 75 μm dantrolene or 100 μm ryanodine. Samples were collected, placed in 1.5-ml centrifuge tubes (USA Scientific, Waltham, MA), and centrifuged for 1 min at 30× g. Fifty μl of the resulting cell-free supernatant was removed to a 0.5-ml microcentrifuge tube to assay for LDH. The remaining 450 μl of cells and medium was retained for zymogen activation assays and determination of total LDH. All samples were stored at −80 °C.
Detection of Cellular Ca2+ Signals
Acini were incubated for 30 min with a Ca2+-sensing dye, either fluo-5F/AM or fluo-4/AM (both at 6 μm; Molecular Probes). Acinar cells were then perfused with cerulein (10 pm or 100 nm) or carbachol (0.1 μm) after a 2- min pretreatment with buffer at pH 7.4 or 7.0. A Zeiss LSM 510 NLO confocal microscope (Thornwood, NY) was employed to visualize Ca2+ signals, using either a 20 × or 63 × 1.4 numerical aperture. An argon laser was used to excite the dye at 488-nm wavelength, and emission signals >515 nm were collected.
Fluorescence Measurement of Intracellular pH
Pancreatic acinar cells were loaded with the pH-sensitive fluoroprobe BCECF-AM (2 μm) (Molecular Probes) by incubation for 30 min at room temperature and allowed to settle and adhere to a coverslip. The coverslips were mounted in a perfusion chamber on the stage of an inverted microscope (Zeiss Axiovert 100). This was equipped with a video imaging system (Visitron, Munich, Germany). Experiments were performed at room temperature. Cells were then alternately excited at 440 and 490 nm by using a DG-4 filter changer (Sutter Instruments, Novato, CA) every 10 s, and emitted fluorescence was captured at 530 nm by using a Cooke Sensicam (Cooke, Auburn Hills, MI) 12-bit frame transfer digital camera. A ratio of the fluorescence at 490 versus 440 nm was computed. Intracellular pH (pHi) was then estimated by using an in situ calibration (24), where external pH was changed in the presence of high K+ and the ionophore nigericin (5 μm). The high K+ solution used to calibrate ratios into pH values contained 105 mm KCl, 32.8 mm N-methyl-d-glucamine, 1.2 mm MgCl2, 1.0 mm CaCl2, 32.2 mm HEPES, 5 mm mannitol, and 0.005 mm nigericin, and the pH was adjusted to between 6.5 and 7.5. The fluorescence ratios computed for pH solutions over the physiological range of 6.5–7.5 were linear. All data are representative of four or more experimental runs.
Enzymatic Activity Assays
Samples containing 450 μl of cells and medium were thawed on ice, homogenized in a conical 1-ml Eppendorf tube with a pestle, and centrifuged at 1,000 × g for 1 min. From the resulting postnuclear supernatant, 100 μl was added to wells of a 24-well tissue culture plate containing 350 μl of trypsin assay buffer (50 mm Tris (pH 8.1), 150 mm NaCl, 1 mm CaCl2, 0.01% BSA). Finally, 50 μl of 400 μm enzyme substrate (trypsin 3135; Peptides International, Louisville, KY, and chymotrypsin; Calbiochem) diluted in trypsin assay buffer (40 μm final) was added to each well. The plate was read by using a fluorometric microtiter plate reader (model HTS 7000; Perkin-Elmer Analytical Instruments, Shelton, CT) using a 380-nm excitation wavelength and 440-nm emission for 20 reads over 10 min. The slope of the line, which represents enzyme activity of the homogenate, was normalized to total amylase activity and expressed as relative fluorescence units per second per microgram of total amylase.
LDH Assay
LDH activity was measured using the commercially available Cytotox 96 nonradioactive cytotoxicity assay kit (Promega). In brief, acinar cells were treated with physiologic (100 pm) or supramaximal (100 nm) cerulein alone or in the presence of either 100 μm ryanodine or 75 μm dantrolene for 2 h at pH 7.4 or 7.0. Samples were collected and centrifuged at 30 × g for 30 s. A 50-μl aliquot of medium was then removed to measure LDH release from the cells. A manufacturer-provided lysis reagent was then added to the remaining 450 μl of cells and medium to determine total LDH. Both cell and medium samples were assayed. The results are expressed as the percent LDH released into the medium.
Statistical Analysis
Data represent means ± S.E. of at least three individual experiments unless otherwise noted, with each experiment being performed in at least duplicate. A Student's t test analysis was used to determine statistical significance and p values of <0.05 were assigned significance.
RESULTS
Low pHe Alters Ca2+ Signals
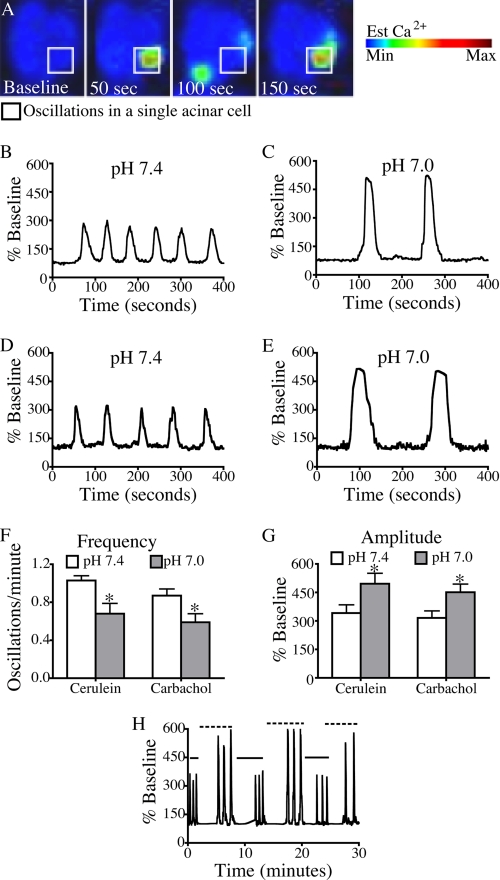
To determine the effects of low pHe, isolated acinar cells were perfused with either pH 7.4 or 7.0 HEPES buffer for 2 min. Consistent with the work of others (25, 26), we found that pHi was directly related to pHe under these conditions (supplemental Fig. S1). To examine Ca2+ signals, acini were treated with a physiologic concentration of cerulein (10 pm). Cytosolic Ca2+ measurements were obtained once per second by time lapse confocal microscopy (Fig. 1A) and normalized to base-line fluorescence for each individual cell (Fig. 1, B and C). Changing pHe from 7.4 to 7.0 in the absence of cerulein had no effect on base-line Ca2+ signals, demonstrating that the Ca2+ dye used was unaffected by pH values in this range (data not shown). Low pHe effects on frequency and amplitude occurred over 2 min (data not shown) and were reversible (Fig. 1H).
FIGURE 1.
Reducing pHe from 7. 4 to 7.0 is associated with a reversible decrease in the frequency and an increase in the amplitude of Ca2+ oscillations. A, changes in whole cell cytosolic Ca2+ were measured once per second by time lapse confocal microscopy using the Ca2+ dye fluo-4/AM. B–E, representative plots of fluorescence over time were recorded from a single cell treated with 10 pm cerulein at pH 7.4 (B) and 7.0 (C) and 100 nm carbachol at pH 7.4 (D) and pH 7.0 (E). F and G, the pH-dependent changes in frequency (F) and amplitude (G) were quantified in cells treated with 10 pm cerulein or 100 nm carbachol. H, the pH-dependent changes in frequency and amplitude were reversible when pH was alternated between pH 7.4 (solid line) and pH 7.0 (dashed line). The percentage of cells responding per treatment condition was 70% for cerulein (pH 7.4), 73% for cerulein (pH 7.0), 63% for carbachol (pH 7.4), and 57% for carbachol (pH 7.0). There were 30 cells/treatment group; mean ± S.E. (error bars) for three separate experiments is shown. *, p < 0.05 versus pH 7.4.
Fig. 1F demonstrates that the frequency of cerulein-induced Ca2+ oscillations significantly decreased under low pH conditions (1.03 oscillations/min at pH 7.4 compared with 0.68 oscillations/min at pH 7.0; p < 0.05). Fig. 1G shows that cells treated at pH 7.0 conditions also exhibited higher amplitude Ca2+ signals than those treated at pH 7.4 (512% base line versus 352% base line, respectively; p < 0.05). Similar effects on amplitude and frequency were seen when the pHe was decreased further to 6.8. There were no significant changes in Ca2+ signals when the pH was increased from 7.4 to 7.6 (supplemental Fig. S2). To ensure that these responses were not limited to Ca2+ signals induced by a specific G protein-coupled receptor, the effects of low pHe on muscarinic agonist (carbachol)-induced Ca2+oscillations were also examined (Fig. 1, D and E). A similar pattern of decreased oscillation frequency and increased amplitude was observed (Fig. 1, F and G) with 100 nm carbachol at pH 7.0.
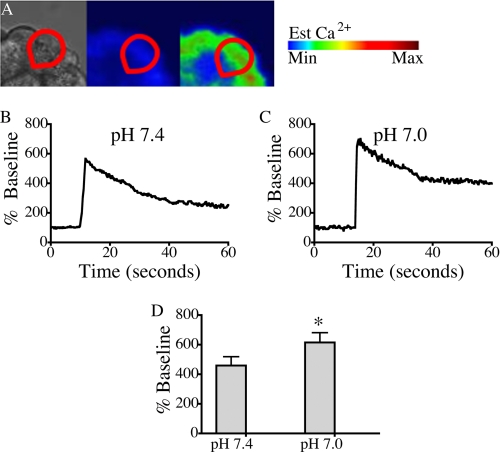
Because low pHe also enhances zymogen activation and cellular injury induced by supramaximal secretagogue stimulation (9), the effects of low pH on calcium signals induced by supraphysiologic (100 nm) cerulein were also examined. With high dose cerulein stimulation at pH 7.4 and 7.0, a peak plateau Ca2+ signal was observed (Fig. 2, A–C). Fig. 2D demonstrates that at pH 7.0, acinar cells responded with significantly higher peak amplitude increasing from 459% base line to 615% base line (p < 0.05). These findings establish that lowering pHe significantly enhances agonist-induced Ca2+ signals in pancreatic acinar cells.
FIGURE 2.
Reducing pHe from 7. 4 to 7.0 is associated with an enhancement in Ca2+ signal amplitude in acini treated with supramaximal cerulein. A, changes in whole cell (red outline) cytosolic Ca2+ were measured by time lapse confocal microscopy using the Ca2+ dye fluo-5F/AM. B and C, representative plots of fluorescence over time were recorded from a single cell treated with 100 nm cerulein at pH 7.4 (B) and 7.0 (C). D, the pH-dependent changes in amplitude were quantified in three separate experiments. The percentage of cells responding per treatment condition was: 94% for cerulein (pH 7.4) and 88% for cerulein (pH 7.0). There were 18 cells/treatment group; mean ± S.E. (error bars) is shown. *, p < 0.05 versus pH 7.4.
Low pHe Modulates RYR-mediated Ca2+ Release
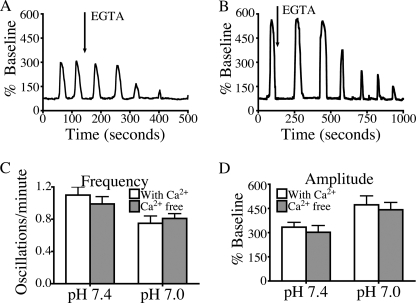
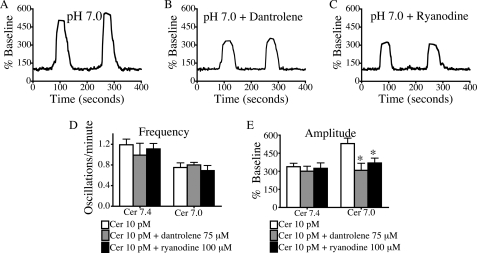
Several studies were performed to determine the source of Ca2+ responsible for the effects of lowering pHe. To determine the role of influx of extracellular Ca2+, cells were perfused with Ca2+-free medium containing 0.5 mm EGTA (Fig. 3). This medium did not alter the signaling responses to low pH, suggesting that these effects are mediated by intracellular Ca2+ channels rather than Ca2+ entry. To determine which intracellular Ca2+ release channel is responsible for the changes in Ca2+ signals seen at low pHe, cells were treated with inhibitors of IP3R and RYR, the two principal channels in acinar cells (21, 27, 28). When cells were treated with the IP3R antagonist, 2-aminoethoxydiphenyl borate (100 μm), Ca2+ oscillations at either pH 7.4 or 7.0 ceased (supplemental Fig. S3). These findings are consistent with previous observations that Ca2+ signals in the acinar cell are initiated by Ca2+ release from IP3Rs (29, 30), which are concentrated in the apical region of the cell (20, 31, 32). Fig. 4 shows that when cells were pretreated with the RYR inhibitors, dantrolene (75 μm) and ryanodine (100 μm), there was a significant reduction in oscillation amplitude, but no change in oscillation frequency. These data suggest that Ca2+ signals at pHe 7.4 or 7.0 require activation of IP3R, but the effects of low pHe on oscillation amplitude are mediated by RYR.
FIGURE 3.
Calcium-free medium does not alter low pH effects. A and B, representative plots of fluorescence over time are recorded from a single cell treated with 10 pm cerulein at pH 7.4 (A) and 7.0 (B), with a change to Ca2+-free medium containing 0.5 mmol EGTA denoted by an arrow. C and D, frequency and amplitude of the first two oscillations after the change to Ca2+ free medium are quantified and were not significantly different from controls treated with Ca2+-containing buffer. Given that oscillations diminish as intracellular Ca2+ is depleted, only the first two oscillations after the change to Ca2+ free medium were quantified in three separate experiments. The percentage of cells responding per treatment condition was 64% for cerulein (pH 7.4) and 67% for cerulein (pH 7.0) for cells treated with Ca2+-free medium. There were 30 cells/treatment group; mean ± S.E. (error bars) is shown. *, p < 0.05.
FIGURE 4.
RYR inhibitors reduce low pH effects on amplitude but do not affect frequency. Cells were pretreated for 30 min with 75 μm dantrolene or 100 μm ryanodine and then perfused with 10 pm cerulein (Cer). A–C, representative plots of fluorescence over time from a single cell treated with 10 pm cerulein at pH 7.0 (A) and with 10 pm cerulein at pH 7.0 in the presence of dantrolene (B) and ryanodine (C) are shown. D and E, changes in (D) oscillation frequency and (E) amplitude of Ca2+ signals were quantified in three separate experiments under each condition. The percentage of cells responding per treatment condition was 67% for cells treated with dantrolene and 73% for cells treated with ryanodine. There were 30 cells/treatment group; mean ± S.E. (error bars) is shown. *, p < 0.05 versus 10 pm cerulein.
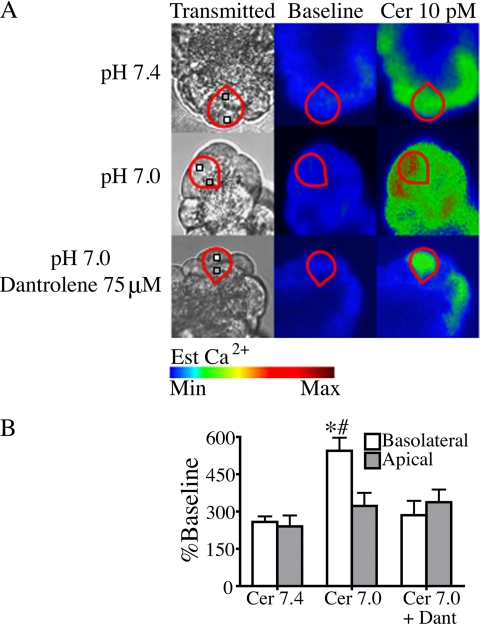
To confirm that the effects of low pHe are mediated by the basolaterally localized RYR, subcellular changes in cytosolic Ca2+ were measured. Work by others in acinar cells suggests that low affinity dyes are more sensitive in characterizing subcellular differences in cytosolic Ca2+ (33). Therefore, the low affinity Ca2+ dye, fluo-5 (Kd = 2.3 μm) was used to determine whether low pHe enhances Ca2+ signals in a particular subcellular region. Fig. 5 shows that there was a significant increase in the amplitude of basolateral Ca2+ signals when pHe was reduced from 7.4 to 7.0 (p < 0.05), but there was no significant difference in apical Ca2+ signaling. The increase in basolateral Ca2+ at low pHe was abrogated with dantrolene pretreatment (p < 0.05). The previously identified role of RYR in propagating Ca2+ waves from the apical to basolateral subcellular regions (22, 34) was not evaluated in this study.
FIGURE 5.
Low pHe selectively enhances basolateral Ca2+ signals in cells treated with 10 pm cerulein. A, cerulein (Cer)-induced (10 pm) changes in subcellular cytosolic Ca2+ at pH 7.4 and 7.0 were measured using the low affinity Ca2+ dye fluo-5F/AM and observed by time lapse confocal microscopy. Regions of interest in the basolateral (white box) and apical (gray box) region were analyzed for each individual cell (red outline). B, a significant increase in basolateral Ca2+ signaling was seen at pH 7.0 but was inhibited by pretreatment with 75 μm dantrolene (Dant). There were no significant changes in apical Ca2+ signals (three separate experiments with 18 cells/treatment group; mean ± S.E. (error bars); *, p < 0.05 versus cerulein 7.4; #, p < 0.05 versus cerulein 7.0 + dantrolene).
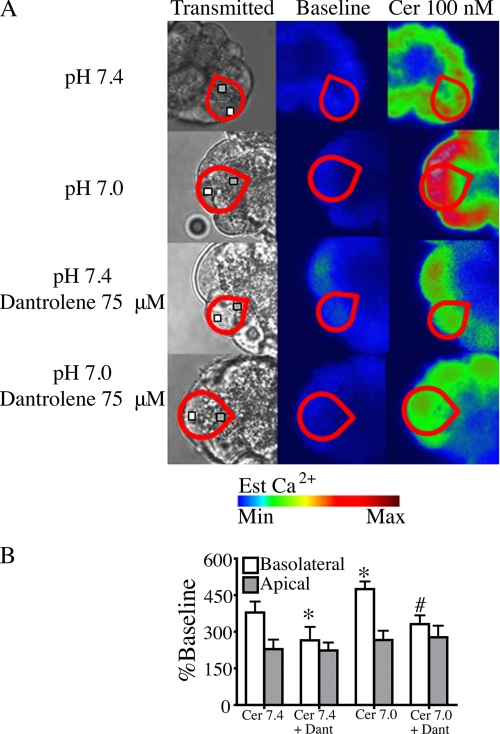
The role of RYR in mediating the effects of low pH in acini treated with supramaximal cerulein was also evaluated. As previously reported, supramaximal agonist stimulation enhances basolateral Ca2+ signaling via RYR (21). Fig. 6 shows that low pH further enhances basolateral Ca2+ signal amplitude. The enhancement in basolateral Ca2+ signaling at pH 7.0 was significantly reduced by dantrolene pretreatment. In acini treated with dantrolene, there was no significant difference between basolateral signal amplitude at pH 7.4 and 7.0. These results further support the hypothesis that low pHe enhances Ca2+ signaling through the RYR.
FIGURE 6.
Low pHe selectively enhances basolateral Ca2+ signals in cells treated with 100 nm cerulein. A, cerulein (Cer)-induced (10 pm) changes in subcellular cytosolic Ca2+ at pH 7.4 and 7.0 were measured using the low affinity Ca2+ dye fluo-5F/AM and observed by time lapse confocal microscopy. Regions of interest in the basolateral (white box) and apical (gray box) region were analyzed for each individual cell (red outline). B, supramaximal cerulein at pH 7.4 increases basolateral Ca2+ signaling. A further increase in basolateral Ca2+ signaling was seen at pH 7.0. Basolateral Ca2+ signals at pH 7.4 and 7.0 were inhibited by pretreatment with 75 μm dantrolene (Dant). There were no significant changes in apical Ca2+ signals between treatments. The percentage of cells responding per treatment condition was 94% for cerulein (pH 7.4) and 100% for cerulein (pH 7.0), 88% for cerulein with dantrolene (pH 7.4), and 94% for cerulein with dantrolene (pH 7.0). There were three separate experiments with 18 cells/treatment group; mean ± S.E. (error bars) for three separate experiments; *, p < 0.05 versus cerulein (pH 7.4); #, p < 0.05 versus cerulein (pH 7.0) + dantrolene.
Low pHe Promotes Pancreatitis Responses through Its Effects on the RYR
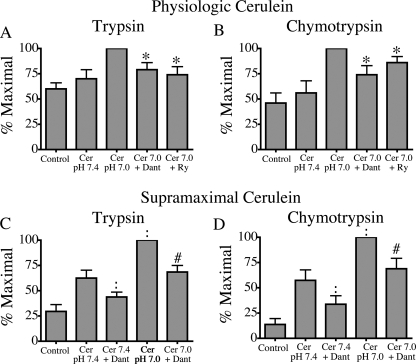
Low pHe sensitizes the acinar cell to key measures of pancreatitis in vitro: zymogen activation and cellular injury (9). Given our observation that low pHe effects on Ca2+ signaling are mediated by RYR, we hypothesized that the sensitizing effects of low pHe on pancreatitis responses would be decreased by pretreatment with RYR inhibitors, dantrolene and ryanodine. This was tested in three ways: 1) by measuring premature intracellular activation of zymogens (35), 2) by determining LDH release as a marker of loss of cell integrity (23), and 3) by examining morphological changes associated with acinar cell damage (36). Fig. 7 shows that the sensitizing effects of acid on trypsin and chymotrypsin activation are significantly reduced by pretreatment with RYR inhibitors (p < 0.05).
FIGURE 7.
RYR inhibitors reduce the sensitizing effects of low pHe on premature zymogen activation. Acini were incubated with or without 75 μm dantrolene (Dant) or 100 μm ryanodine (Ry) in the presence of physiologic (100 pm) and supramaximal (100 nm) cerulein (Cer). Samples were assayed for trypsin (A and C) and chymotrypsin (B and D) activity. Results of three separate experiments are expressed as a percentage of the treatment that produced maximum zymogen activation (mean ± S.E.; *, p < 0.05 versus 100 pm cerulein at pH 7.0; :, p < 0.05 for 100 nm cerulein at pH 7.4; #, p < 0.05 for 100 nm cerulein at pH 7.0).
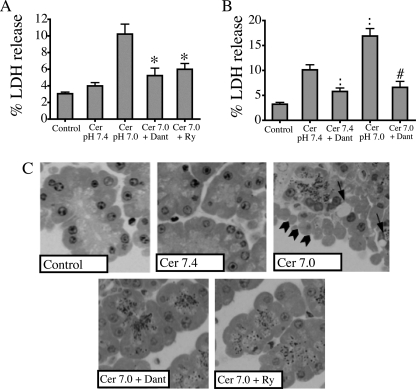
Fig. 8A shows that sensitizing effects of acid on cellular injury are also ameliorated by RYR inhibitors, as demonstrated by a decrease in LDH release in cells treated with 100 pm cerulein at pH 7.0 from 10.2% in control cells to 5.2% and 6.0% in cells pretreated with dantrolene and ryanodine, respectively (p < 0.05). RYR inhibitors had no effect on zymogen activation or LDH at pH 7.4 with 10 pm cerulein (data not shown). To evaluate the effects of RYR inhibition on cellular injury further, morphological indicators of injury were examined (Fig. 8C). First, the appearance of large cytoplasmic vacuoles, a hallmark of acute pancreatitis, was evaluated. Whereas untreated control cells or those exposed to physiological concentrations of cerulein at pH 7.4 did not exhibit this feature, cells treated with low dose cerulein at pH 7.0 demonstrated prominent vacuoles. This effect was reduced significantly by pretreatment with RYR inhibitors. Blebbing of the basolateral membranes, a characteristic of injury in isolated acini, similarly was seen in cells treated with 100 pm cerulein at pH 7.0, and this marker of injury was also eliminated by RYR inhibitors. Cellular injury in acini treated with supramaximal cerulein was assessed by examining LDH release (Fig. 8B). Pretreatment with dantrolene reduced LDH release in cells treated with 100 nm cerulein at pH 7.0 from 16.9% to 6.6% (p < 0.05). Taken together, these complementary measures of acinar cell injury provide further support that RYR mediates the injurious effects of cerulein combined with low pHe on the acinar cell.
FIGURE 8.
RYR inhibitors ameliorate the injurious effects of low pHe. Acini were incubated with or without 75 μm dantrolene (Dant) or 100 μm ryanodine (Ry) in the presence of 100 pm or 100 nm cerulein (Cer) for 2 h. A and B, samples were assayed for LDH release. %LDH release was quantified in three separate experiments. C, morphological indicators demonstrate that RYR antagonists ameliorate injury caused by low pHe in these representative photographs showing basolateral blebbing (arrowheads) and vacuolization (arrows) (mean ± S.E. (error bars); *, p < 0.05 versus 100 pm cerulein at pH 7.0; :, p < 0.05 for 100 nm cerulein at pH 7.4; #, p < 0.05 for 100 nm cerulein at pH 7.0).
DISCUSSION
A number of studies have provided evidence that the early events in pancreatitis are mediated by pathologic Ca2+ signaling (14–18). In other nonexcitable cell types, low pHe has been shown to enhance Ca2+ signals (37). However, the injurious effects of low pHe on the acinar cell have not previously been linked to abnormal Ca2+ signaling patterns. Our data show that a pathophysiologically relevant decrease in pHe from 7.4 to 7.0 enhances the amplitude of Ca2+ signals. Furthermore, when the effects of low pHe on Ca2+ signal amplitude are inhibited by RYR antagonists, the sensitizing effects of low pHe on intracellular zymogen activation and cellular injury are eliminated.
One possible explanation for the observed effects of low pHe on Ca2+ signaling in the acinar cell is that acidic conditions change ligand binding properties. For cholecystokinin receptors, the optimum pH for ligand binding is slightly acidic at 6.0–7.0 (38). In contrast, ligand binding to muscarinic receptors is very modestly inhibited at pH 7.0, compared with pH 7.4 (39, 40). Given that ligand binding to cholecystokinin and muscarinic receptors is affected in opposite ways by low pH, the consistent effects of low pH on carbachol- and cerulein-induced oscillations suggest that the effects of low pH are not mediated by changes in ligand binding.
A key and previously undescribed finding of this study is that the effects of low pHe are mediated through RYR. Our study identifies RYR as the mediator of low pHe-related Ca2+ release in two ways: 1) using RYR inhibitors and 2) selectively evaluating basolateral Ca2+ signals. RYR is concentrated in the basolateral region of the acinar cell (21, 41, 42). This subcellular localization overlaps with the supranuclear vesicular compartment where initial zymogen activation occurs, and RYR-mediated Ca2+ release has been implicated in the pathogenesis of acute pancreatitis in vitro and in vivo (21, 43–45). Our data provide the first evidence that low pH can sensitize to RYR-mediated Ca2+ release and injury under conditions of physiologic and supramaximal agonist stimulation. Further, because RYR inhibitors had no effect on the frequency or amplitude of Ca2+ signals produced by low dose cerulein at pH 7.4, this study also suggests that RYR-mediated Ca2+ release is not essential for the production of physiologic Ca2+ oscillations.
Work in other cell types has shown that low pHe can sensitize to RYR-mediated Ca2+ release (46), but the mechanism underlying this effect is unknown. Single channel studies have shown that RYR open probability is modestly inhibited by low pH (47), which suggests that the effects of low pHe on RYR-sensitive Ca2+ stores are indirect and not the result of receptor protonation. RYR activity is known to be affected by posttranslational modifications, including phosphorylation (48–54), oxidation (55–57), and nitrosylation (58–60). Furthermore, in addition to kinases and phosphatases, RYR interacts with a number of accessory proteins, most notably calmodulin (61, 62), which could be a direct target of low pHe. Determining which, if any, of these mechanisms is responsible for the effects of low pHe on RYR-mediated Ca2+ release will require further study.
Our study demonstrates that low pHe also has a RYR-independent effect on the frequency of Ca2+ oscillations. The slowed frequency of oscillations may be caused by an effect on the IP3R. IP3 binding to IP3R and the rate of IP3-induced Ca2+ release are inhibited by acidic pH in several cell types (63–65). The pacemaker function that initiates and propagates acinar cell Ca2+ signals is IP3R-dependent as well (29, 66). Patch clamp studies have shown that low pH can affect IP3R spike duration (10). In our study, IP3R inhibition caused cessation of all Ca2+ signaling at both pH 7.4 and pH 7.0, making it difficult to conclude whether low pHe may be having a subtle effect on pacemaker function. However, it appears that the effects of low pHe on signal amplitude, rather than the effects on signal frequency, are responsible for the enhanced zymogen activation and cellular injury seen at pHe 7.0.
Other studies have implicated additional mechanisms to explain the effects of low pH on the acinar cell. In a model of ERCP pancreatitis, low pH contrast injected into the pancreatic duct mediated injurious effects through the pH-sensitive cation channel TRPV1 (67). However, this model of pancreatitis based on elevated intraductal pressure may not be relevant to systemic acidosis. Furthermore, the most pronounced TRPV1-mediated effects were seen at pH 6.0, which is not a clinically relevant systemic pH. Unlike our study, which found no relationship between low pHe and Ca2+ entry, a previous study showed that decreasing pHe inhibited Ca2+ uptake into the cell (68). However, a significantly lower pHe of 6.4 was used in those experiments, which may explain the discrepancy. Several studies have shown that low pHi, achieved through the application of weak acids, can enhance acinar cell Ca2+ signals through effects on intracellular stores (69–71). However, none of these studies examined the effects of low pHe, and the magnitude of pH changes often was not quantified, making it difficult to extrapolate such findings to the sensitizing effects of acidosis in vivo. Furthermore, the identity of putative pH-sensitive intracellular Ca2+ stores has not previously been identified.
In summary, the current work provides evidence that decreasing pHe significantly increases the amplitude of secretagogue-dependent Ca2+ signaling in the acinar cell. The enhancement in amplitude is mediated by RYR and is responsible for the enhanced pancreatitis responses including zymogen activation and cellular injury seen with low pHe. Further work will be needed to determine whether the risk of pancreatitis can be ameliorated by pharmacologic inhibition of RYR in patients with clinical conditions that are associated with acidosis.
Supplementary Material
This work was supported by an American Gastroenterological Association Fellowship to Faculty Transition Award and National Institutes of Health Training Grant T32 DK007356-31 (to A. M. R.), National Institutes of Health Grants R01 DK083327, R03 DK078707, K08 DK68116, and DK34989 (to the Yale Liver Center), a Children's Digestive Health and Nutrition Young Investigator award (to S. Z. H.), National Institutes of Health Grant R01 DK54021 and a Veterans Affairs merit award (to F. S. G.), and National Institutes of Health Grants DK34989, DK57751, DK45710, and DK61747 (to M. H. N.).

The on-line version of this article (available at http://www.jbc.org) contains supplemental Figs. S1–S3.
- pHe
- extracellular pH
- BCECF-AM
- 2′,7′)-bis-(2-carboxyethyl)-5-(and-6)-carboxyfluorescin, acetomethyl ester
- IP3R inositol
- 1,4,5-trisphosphate receptor
- LDH
- lactate dehydrogenase
- pHi
- intracellular pH
- RYR
- ryanodine receptor.
REFERENCES
- 1. Whitcomb D. C. (2006) N. Engl. J. Med. 354, 2142–2150 [DOI] [PubMed] [Google Scholar]
- 2. Nair S., Yadav D., Pitchumoni C. S. (2000) Am. J. Gastroenterol. 95, 2795–2800 [DOI] [PubMed] [Google Scholar]
- 3. Bultron G., Seashore M. R., Pashankar D. S., Husain S. Z. (2008) J. Pediatr. Gastroenterol. Nutr. 47, 370–371 [DOI] [PubMed] [Google Scholar]
- 4. Coghlan M. E., Sommadossi J. P., Jhala N. C., Many W. J., Saag M. S., Johnson V. A. (2001) Clin. Infect. Dis. 33, 1914–1921 [DOI] [PubMed] [Google Scholar]
- 5. Wester C. W., Okezie O. A., Thomas A. M., Bussmann H., Moyo S., Muzenda T., Makhema J., van Widenfelt E., Musonda R., Novitsky V., Gaolathe T., Ndwapi N., Essex M., Kuritzkes D. R., DeGruttola V., Marlink R. G. (2007) J. Acquir. Immune. Defic. Syndr. 46, 318–322 [DOI] [PubMed] [Google Scholar]
- 6. Audia P., Feinfeld D. A., Dubrow A., Wincester J. F. (2008) Clin. Toxicol. (Phila). 46, 164–166 [DOI] [PubMed] [Google Scholar]
- 7. Mori S., Ebihara K. (2008) Mod. Rheumatol. 18, 634–638 [DOI] [PubMed] [Google Scholar]
- 8. Nyenwe E. A., Razavi L. N., Kitabchi A. E., Khan A. N., Wan J. Y. (2010) Diabetes Care 33, 1837–1839 [DOI] [PMC free article] [PubMed] [Google Scholar]
- 9. Bhoomagoud M., Jung T., Atladottir J., Kolodecik T. R., Shugrue C., Chaudhuri A., Thrower E. C., Gorelick F. S. (2009) Gastroenterology 137, 1083–1092 [DOI] [PMC free article] [PubMed] [Google Scholar]
- 10. Behrendorff N., Floetenmeyer M., Schwiening C., Thorn P. (2010) Gastroenterology 139, 1711–1720 [DOI] [PubMed] [Google Scholar]
- 11. Leach S. D., Bilchik A. J., Karapetian O., Gorelick F. S., Modlin I. M. (1993) Pancreas 8, 64–69 [DOI] [PubMed] [Google Scholar]
- 12. Guillaumes S., Blanco I., Villanueva A., Sans M. D., Clavé P., Chabás A., Farré A., Lluís F. (1997) Pancreas 14, 262–266 [DOI] [PubMed] [Google Scholar]
- 13. Waterford S. D., Kolodecik T. R., Thrower E. C., Gorelick F. S. (2005) J. Biol. Chem. 280, 5430–5434 [DOI] [PMC free article] [PubMed] [Google Scholar]
- 14. Raraty M., Ward J., Erdemli G., Vaillant C., Neoptolemos J. P., Sutton R., Petersen O. H. (2000) Proc. Natl. Acad. Sci. U.S.A. 97, 13126–13131 [DOI] [PMC free article] [PubMed] [Google Scholar]
- 15. Muallem S., Kwiatkowska K., Xu X., Yin H. L. (1995) J. Cell Biol. 128, 589–598 [DOI] [PMC free article] [PubMed] [Google Scholar]
- 16. Criddle D. N., Murphy J., Fistetto G., Barrow S., Tepikin A. V., Neoptolemos J. P., Sutton R., Petersen O. H. (2006) Gastroenterology 130, 781–793 [DOI] [PubMed] [Google Scholar]
- 17. Gerasimenko J. V., Gerasimenko O. V., Palejwala A., Tepikin A. V., Petersen O. H., Watson A. J. (2002) J. Cell Sci. 115, 485–497 [DOI] [PubMed] [Google Scholar]
- 18. Criddle D. N., Raraty M. G., Neoptolemos J. P., Tepikin A. V., Petersen O. H., Sutton R. (2004) Proc. Natl. Acad. Sci. U.S.A. 101, 10738–10743 [DOI] [PMC free article] [PubMed] [Google Scholar]
- 19. Petersen O. H. (2005) Cell Calcium 38, 171–200 [DOI] [PubMed] [Google Scholar]
- 20. Nathanson M. H., Fallon M. B., Padfield P. J., Maranto A. R. (1994) J. Biol. Chem. 269, 4693–4696 [PubMed] [Google Scholar]
- 21. Husain S. Z., Prasad P., Grant W. M., Kolodecik T. R., Nathanson M. H., Gorelick F. S. (2005) Proc. Natl. Acad. Sci. U.S.A. 102, 14386–14391 [DOI] [PMC free article] [PubMed] [Google Scholar]
- 22. Nathanson M. H., Padfield P. J., O'Sullivan A. J., Burgstahler A. D., Jamieson J. D. (1992) J. Biol. Chem. 267, 18118–18121 [PubMed] [Google Scholar]
- 23. Chaudhuri A., Kolodecik T. R., Gorelick F. S. (2005) Am. J. Physiol. Gastrointest. Liver Physiol. 288, G235–G243 [DOI] [PMC free article] [PubMed] [Google Scholar]
- 24. Thomas J. A., Buchsbaum R. N., Zimniak A., Racker E. (1979) Biochemistry 18, 2210–2218 [DOI] [PubMed] [Google Scholar]
- 25. Carter K. J., Rutledge P. L., Steer M. L., Silen W. (1987) Am. J. Physiol. Gastrointest. Liver Physiol. 253, G690–G696 [DOI] [PubMed] [Google Scholar]
- 26. Muallem S., Loessberg P. A. (1990) J. Biol. Chem. 265, 12806–12812 [PubMed] [Google Scholar]
- 27. Muallem S. (1989) Annu. Rev. Physiol. 51, 83–105 [DOI] [PubMed] [Google Scholar]
- 28. Streb H., Bayerdörffer E., Haase W., Irvine R. F., Schulz I. (1984) J. Membr. Biol. 81, 241–253 [DOI] [PubMed] [Google Scholar]
- 29. Yule D. I., Stuenkel E., Williams J. A. (1996) Am. J. Physiol. Cell Physiol. 271, C1285–C1294 [DOI] [PubMed] [Google Scholar]
- 30. Thorn P., Lawrie A. M., Smith P. M., Gallacher D. V., Petersen O. H. (1993) Cell 74, 661–668 [DOI] [PubMed] [Google Scholar]
- 31. Lee M. G., Xu X., Zeng W., Diaz J., Wojcikiewicz R. J., Kuo T. H., Wuytack F., Racymaekers L., Muallem S. (1997) J. Biol. Chem. 272, 15765–15770 [DOI] [PubMed] [Google Scholar]
- 32. Yule D. I., Ernst S. A., Ohnishi H., Wojcikiewicz R. J. (1997) J. Biol. Chem. 272, 9093–9098 [DOI] [PubMed] [Google Scholar]
- 33. Ito K., Miyashita Y., Kasai H. (1997) EMBO J. 16, 242–251 [DOI] [PMC free article] [PubMed] [Google Scholar]
- 34. Leite M. F., Burgstahler A. D., Nathanson M. H. (2002) Gastroenterology 122, 415–427 [DOI] [PubMed] [Google Scholar]
- 35. Leach S. D., Modlin I. M., Scheele G. A., Gorelick F. S. (1991) J. Clin. Invest. 87, 362–366 [DOI] [PMC free article] [PubMed] [Google Scholar]
- 36. Müller M. W., McNeil P. L., Büchler P., Ceyhan G. O., Wolf-Hieber E., Adler G., Beger H. G., Büchler M. W., Friess H. (2007) Pancreas 35, e30–e40 [DOI] [PubMed] [Google Scholar]
- 37. Gourine A. V., Kasymov V., Marina N., Tang F., Figueiredo M. F., Lane S., Teschemacher A. G., Spyer K. M., Deisseroth K., Kasparov S. (2010) Science 329, 571–575 [DOI] [PMC free article] [PubMed] [Google Scholar]
- 38. Szecòwka J., Goldfine I. D., Williams J. A. (1985) Regul. Pept. 10, 71–83 [DOI] [PubMed] [Google Scholar]
- 39. Anthony B. L., Aronstam R. S. (1986) J. Neurochem. 46, 556–561 [DOI] [PubMed] [Google Scholar]
- 40. Asselin J., Waelbroeck M., Robberecht P., de Neef P., Christophe J. (1983) Biochem. J. 216, 11–19 [DOI] [PMC free article] [PubMed] [Google Scholar]
- 41. Fitzsimmons T. J., Gukovsky I., McRoberts J. A., Rodriguez E., Lai F. A., Pandol S. J. (2000) Biochem. J. 351, 265–271 [DOI] [PMC free article] [PubMed] [Google Scholar]
- 42. Leite M. F., Dranoff J. A., Gao L., Nathanson M. H. (1999) Biochem. J. 337, 305–309 [PMC free article] [PubMed] [Google Scholar]
- 43. Orabi A. I., Shah A. U., Ahmad M. U., Choo-Wing R., Parness J., Jain D., Bhandari V., Husain S. Z. (2010) Am. J. Physiol. Gastrointest. Liver Physiol. 99, G196–G204 [DOI] [PMC free article] [PubMed] [Google Scholar]
- 44. Grady T., Mah'Moud M., Otani T., Rhee S., Lerch M. M., Gorelick F. S. (1998) Am. J. Physiol. Gastrointest. Liver Physiol. 275, G1010–G1017 [DOI] [PubMed] [Google Scholar]
- 45. Hofbauer B., Saluja A. K., Lerch M. M., Bhagat L., Bhatia M., Lee H. S., Frossard J. L., Adler G., Steer M. L. (1998) Am. J. Physiol. Gastrointest. Liver Physiol. 275, G352–G362 [DOI] [PubMed] [Google Scholar]
- 46. Rohra D. K., Saito S. Y., Ohizumi Y. (2003) Life Sci. 72, 1259–1269 [DOI] [PubMed] [Google Scholar]
- 47. Ma J., Fill M., Knudson C. M., Campbell K. P., Coronado R. (1988) Science 242, 99–102 [DOI] [PubMed] [Google Scholar]
- 48. Marx S. O., Reiken S., Hisamatsu Y., Jayaraman T., Burkhoff D., Rosemblit N., Marks A. R. (2000) Cell 101, 365–376 [DOI] [PubMed] [Google Scholar]
- 49. Wang J., Best P. M. (1992) Nature 359, 739–741 [DOI] [PubMed] [Google Scholar]
- 50. Witcher D. R., Kovacs R. J., Schulman H., Cefali D. C., Jones L. R. (1991) J. Biol. Chem. 266, 11144–11152 [PubMed] [Google Scholar]
- 51. Strand M. A., Louis C. F., Mickelson J. R. (1993) Biochim. Biophys. Acta 1175, 319–326 [DOI] [PubMed] [Google Scholar]
- 52. Suko J., Maurer-Fogy I., Plank B., Bertel O., Wyskovsky W., Hohenegger M., Hellmann G. (1993) Biochim. Biophys. Acta 1175, 193–206 [DOI] [PubMed] [Google Scholar]
- 53. Lokuta A. J., Meyers M. B., Sander P. R., Fishman G. I., Valdivia H. H. (1997) J. Biol. Chem. 272, 25333–25338 [DOI] [PubMed] [Google Scholar]
- 54. Rodriguez P., Bhogal M. S., Colyer J. (2003) J. Biol. Chem. 278, 38593–38600 [DOI] [PubMed] [Google Scholar]
- 55. Menshikova E. V., Salama G. (2000) J. Cardiovasc. Pharmacol. 36, 656–668 [DOI] [PubMed] [Google Scholar]
- 56. Kawakami M., Okabe E. (1998) Mol. Pharmacol. 53, 497–503 [DOI] [PubMed] [Google Scholar]
- 57. Morad M., Suzuki Y. J., Okabe E. (2000) Antioxid. Redox. Signal. 2, 1–3 [DOI] [PubMed] [Google Scholar]
- 58. Ziolo M. T., Katoh H., Bers D. M. (2001) Am. J. Physiol. Heart. Circ. Physiol. 281, H2295–H2303 [DOI] [PubMed] [Google Scholar]
- 59. Barouch L. A., Harrison R. W., Skaf M. W., Rosas G. O., Cappola T. P., Kobeissi Z. A., Hobai I. A., Lemmon C. A., Burnett A. L., O'Rourke B., Rodriguez E. R., Huang P. L., Lima J. A., Berkowitz D. E., Hare J. M. (2002) Nature 416, 337–339 [DOI] [PubMed] [Google Scholar]
- 60. Zhou L., Burnett A. L., Huang P. L., Becker L. C., Kuppusamy P., Kass D. A., Kevin Donahue J., Proud D., Sham J. S., Dawson T. M., Xu K. Y. (2002) Biochem. Biophys. Res. Commun. 294, 1030–1035 [DOI] [PubMed] [Google Scholar]
- 61. Balshaw D. M., Yamaguchi N., Meissner G. (2002) J. Membr. Biol. 185, 1–8 [DOI] [PubMed] [Google Scholar]
- 62. Yamaguchi N., Xu L., Pasek D. A., Evans K. E., Meissner G. (2003) J. Biol. Chem. 278, 23480–23486 [DOI] [PubMed] [Google Scholar]
- 63. Worley P. F., Baraban J. M., Supattapone S., Wilson V. S., Snyder S. H. (1987) J. Biol. Chem. 262, 12132–12136 [PubMed] [Google Scholar]
- 64. Joseph S. K., Rice H. L., Williamson J. R. (1989) Biochem. J. 258, 261–265 [DOI] [PMC free article] [PubMed] [Google Scholar]
- 65. Tsukioka M., Iino M., Endo M. (1994) J. Physiol. 475, 369–375 [DOI] [PMC free article] [PubMed] [Google Scholar]
- 66. Stauffer P. L., Zhao H., Luby-Phelps K., Moss R. L., Star R. A., Muallem S. (1993) J. Biol. Chem. 268, 19769–19775 [PubMed] [Google Scholar]
- 67. Noble M. D., Romac J., Vigna S. R., Liddle R. A. (2008) Gut 57, 1566–1571 [DOI] [PMC free article] [PubMed] [Google Scholar]
- 68. Muallem S., Pandol S. J., Beeker T. G. (1989) Am. J. Physiol. Gastrointest. Liver Physiol. 257, G917–G924 [DOI] [PubMed] [Google Scholar]
- 69. Speake T., Yodozawa S., Elliott A. C. (1998) Eur. J. Morphol. 36, S165–S169 [PubMed] [Google Scholar]
- 70. Nishiguchi H., Hayashi T., Shigetomi T., Ueda M., Tomita T. (1997) Jpn. J. Physiol. 47, 41–49 [DOI] [PubMed] [Google Scholar]
- 71. Speake T., Elliott A. C. (1998) J. Physiol. 506, 415–430 [DOI] [PMC free article] [PubMed] [Google Scholar]
Associated Data
This section collects any data citations, data availability statements, or supplementary materials included in this article.


