

Abstract
The X-chromosomal GPR34 gene encodes an orphan Gi protein-coupled receptor that is highly conserved among vertebrates. To evaluate the physiological relevance of GPR34, we generated a GPR34-deficient mouse line. GPR34-deficient mice were vital, reproduced normally, and showed no gross abnormalities in anatomical, histological, laboratory chemistry, or behavioral investigations under standard housing. Because GPR34 is highly expressed in mononuclear cells of the immune system, mice were specifically tested for altered functions of these cell types. Following immunization with methylated BSA, the number of granulocytes and macrophages in spleens was significantly lower in GPR34-deficient mice as in wild-type mice. GPR34-deficient mice showed significantly increased paw swelling in the delayed type hypersensitivity test and higher pathogen burden in extrapulmonary tissues after pulmonary infection with Cryptococcus neoformans compared with wild-type mice. The findings in delayed type hypersensitivity and infection tests were accompanied by significantly different basal and stimulated TNF-α, GM-CSF, and IFN-γ levels in GPR34-deficient animals. Our data point toward a functional role of GPR34 in the cellular response to immunological challenges.
Keywords: G Protein-coupled Receptors (GPCR), Gene Knockout, Innate Immunity, Macrophage, Signal Transduction
Introduction
G protein-coupled receptors (GPCR)2 form the largest gene family among transmembrane receptors, including more than 900 genes in humans and other mammals (1). A great number of stimuli, such as light, hormones, neurotransmitters, peptides, and nucleotides, activate the distinct receptors. Nonodorant receptors form about one-third of the GPCR repertoire. Although more than 200 non-odorant GPCR have been assigned to specific agonists and functions, about 155 so-called “orphan” GPCR (2) await identification of their physiological relevance. The importance of GPCR in controlling almost every physiological function makes this receptor family the most frequently used target for therapeutic drugs. Therefore, unveiling the function of orphan GPCR is a central issue in academic and industrial research.
Among the five structurally different GPCR families (1, 3), the rhodopsin-like receptors form the largest in humans and other vertebrates. The rhodopsin-like family is divided further into subfamilies and groups. The P2Y12-like receptor group includes the ADP receptors P2Y12 and P2Y13, the UDP-glucose receptor P2Y14, and the orphan receptors GPR87, GPR82, and GPR34 (4). Apart from the ADP receptor P2Y12, which has a central role in platelet aggregation and is the therapeutic target of clopidogrel (5, 6), very little is known about the function of the other members of this group.
GPR34, an orphan receptor of the P2Y12-like receptor group, was first discovered by mining GenBankTM for novel GPCR sequences and homology cloning and has been assigned to the human X chromosome (7, 8). Phylogenetic studies revealed that GPR34 has been highly conserved over the past 450 million years of vertebrate evolution, and no GPR34-deficient vertebrate has been identified yet (9). To date, there is no report of GPR34 deficiency in humans, and sequencing of more than 100 worldwide samples of human genomic DNA revealed no functionally relevant alleles indicating the physiological importance of the gene (10). GPR34 was, however, included in a microdeletion and breakpoints at the Xp11.4 locus in a Turner syndrome patient (11) and mucosa-associated lymphoid tissue lymphoma (12, 13).
GPR34 shows a ubiquitous expression pattern in murine and human tissues (8). More detailed analyses showed GPR34 expression in the myeloid progenitor cell line HL-60 in K562 cells, and WEHI-3B cells, the macrophage cell line RAW 264.1 (10), and in the murine mast cell line P815. These findings suggest a granulocytic/monocytic expression pattern that is consistent with the ubiquitous expression pattern seen in tissues.
Recently, several members of the P2Y12-like receptor group have been assigned to agonists, including nucleotide derivates and lipids (14–16). Specifically, GPR34 was shown to be activated by lyso-phosphatidylserine (lyso-PS) in vitro. lyso-PS is generated by hydrolysis of membrane lipids through phospholipases A1 and A2 when apoptotic cells expose phosphatidylserine on their surface to these phospholipases (17, 18). lyso-PS is a potent activator of histamine release from mast cells (19). Furthermore, lyso-PS has been described as a growth inhibitor of T cells and as a chemotactic substance for fibroblasts and tumor cells (18–21). These findings suggest an involvement of GPR34 in cellular chemotaxis and immune response, but proof of this concept has yet to be obtained.
We generated and characterized a GPR34-deficient (KO) mouse model with specific focus on immunological functions. We found no evidence that lyso-PS is a natural agonist of the murine and human GPR34. KO mice showed no major alterations in a wide range of tests. However, GPR34 deficiency leads to improper immune response upon antigen and pathogen challenge.
EXPERIMENTAL PROCEDURES
Materials
If not stated otherwise, all standard substances were purchased from Sigma, Merck, and C. Roth GmbH (Karlsruhe, Germany). Cell culture material was obtained from Sarstedt (Nürnbrecht, Germany), and primers were purchased from Invitrogen. Primer sequences are provided in supplemental Table S1. For expression of GPR34 orthologs in yeast, the p416GPD vector (22) (kindly provided by Dr. Mark Pausch, Wyeth Research, Princeton, NJ) was used, and mammalian expression was performed using the pcDps vector (23). Restriction enzymes were purchased from New England Biolabs (Frankfurt/Main, Germany). “Brain”-lyso-PS whose main component is stearyl-lyso-PS (S-lyso-PS) was obtained from Avanti Polar Lipids (Alabaster, AL).
Methods
Preparation and Purification of P-lyso-PS
Because the P-lyso-PS used by Sugo et al. (16) was no longer commercially available at Sigma or any other company, P-lyso-PS was synthesized by hydrolysis of 2-dipalmitoyl-sn-glycero-3-phospho-l-serine with phospholipase A2. P-lyso-PS was purified from the reaction mixture by extraction and thin layer chromatography (for further details see supplemental material).
Cell Culture, Transfection, and Functional Assays
The haploid Saccharomyces cerevisiae yeast strain MPY578t5 (provided by Dr. Mark Pausch) was used for the expression of GPR34 orthologs. Cells were transformed with plasmid DNA using electroporation as described previously (24). For expression in mammalian cells, COS-7 cells were grown in Dulbecco's modified Eagle's medium (DMEM supplemented with 10% (v/v) fetal bovine serum, 100 units/ml penicillin, and 100 μg/ml streptomycin) at 37 °C in a humidified 5% CO2 incubator. Cyclic AMP measurements were performed as described previously (25) using the AlphaScreen® technology. Transient co-transfection experiments of COS-7 cells with the GPR34 constructs and the chimeric G protein Gαqi4 and inositol phosphate accumulation assays (26) were essentially performed as described previously (9). All GPR34 constructs were introduced into the mammalian expression vector pcDps and double-tagged with an N-terminal HA tag and a C-terminal FLAG tag to monitor and quantify total cellular and plasma membrane expression using ELISA (27). Correctness of all PCR-derived constructs was verified by sequencing.
Generation of a GPR34-deficient Mouse Strain
The construction of the GPR34 conditional knock-out allele is shown in supplemental Fig. S1. The neomycin cassette was flanked by two loxP sites (28), and a third loxP site was inserted into the 5′ region of Gpr34. Neomycin-resistant ES cells were screened for homologous recombination. Positive ES cell clones were injected into blastocysts. Chimeric offsprings were fertile and crossed into a C57BL/6 background. Correct homologous recombination was verified by sequencing of PCR products containing sequences of the 5′ and 3′ arms of the targeting constructs and the respective genomic flanking regions, which were not included in the targeting vector.
The initial study described here was performed on complete GPR34-deficient mice. To obtain these animals, female heterozygous mice carrying the mutant loxP Gpr34-Neo cassette locus were bred with homozygous male EIIa-Cre mice. Correct deletion of the Gpr34 coding sequence and neomycin cassette was verified by PCR and locus sequencing. Resulting GPR34-deficient mice (referred to as KO mice) were backcrossed for 12 generations onto the C57BL/6 background. Animals were maintained in a controlled animal facility with 21 °C room temperature, 55% humidity, and a 12-h light/12-h dark cycle. All animal experiments were conducted in accord with accepted standards of humane animal care and approved by the respective regional government agency of the State of Saxony, Germany (TVV 43/07).
Routine genotyping of KO and WT mice was performed by PCR using the primers loxP-GP34-2 sense, loxP-GP34-1-2 antisense, and loxP-GP34-3 antisense (supplemental Table S1). The genomic sequence was amplified from mouse tail DNA using a PCR protocol with the following conditions: 95 °C for 45 s, 60 °C for 45 s, and 72 °C for 45 s for 35 cycles followed by a 10-min extension at 72 °C. Amplification of the KO allele and the WT allele resulted in 270- and 385-bp fragments, respectively (supplemental Fig. S2).
Morphological and Laboratory Chemical Characterization of GPR34-deficient Mice
Litters of newborn KO and WT mice were followed in respect to genotype, gender, and vitality. The daily observation after birth further included measurement of weight and body length. At 3 months of age, mice were sacrificed. Organs, urine, and blood samples were taken for further examination. Histological slices (5 μm) were prepared from organs being fixed in 4% paraformaldehyde solution and embedded in paraffin wax. Slices were stained with hematoxylin and eosin. Blood cell counting from EDTA blood samples was performed automatically (Scil Vet abc; Scil Corp., Viernheim, Germany) and manually under a light microscope after May-Grünwald-Giemsa staining. Electrolytes, metabolites, enzymes, and hormones were analyzed in serum or, where appropriate, in whole blood, according to the guidelines of the German Society of Clinical Chemistry and Laboratory Medicine, using a Hitachi PPE-Modular analyzer (Roche Diagnostics). Acylcarnitine profiles were determined by electrospray ionization-MS/MS (API 2000, Applied Biosystems, Darmstadt, Germany) (29–30). Blood glucose was measured using the Accu Check® device (Roche Diagnostics). Urine samples were obtained by direct urinary bladder puncture and tested for osmolality differences between the genotypes using a vapor pressure osmometer (Wescor®, Logan, UT).
Behavioral Tests: Modified SHIRPA, Open Field Test, Light-Dark Test, and Hot Plate Test
A modified SHIRPA protocol (31, 32) was used to assess a number of motoric, sensoric, and autonomic functions of 8-week-old mice. The open field test and the light-dark test were performed as reported previously (33–35) using automated measuring technology (TSE Systems, Bad Homburg, Germany). Activity of mice was recorded for a period of 5 min.
In a hot plate test (Hot Plate 602001, TSE) the elapsed time until the first reaction of the mice to the heat stimulus (52 °C) was recorded. As end points, shaking or licking of one of the hind paws or jumping off the analgesia meter were used.
RNA Isolation, Microarray Expression Analysis, and Real Time PCR
Hearts were removed from five WT and KO mice at an age of 3 months. Total RNA was extracted from the tissues using TRIzol reagent (Invitrogen) according to the manufacturer's instructions. Total RNA was further purified with RNeasy kits (Qiagen, Hilden, Germany) according to the RNA clean-up protocol. For microarray analysis, RNA integrity and concentration were quantified on an Agilent 2100 Bioanalyzer (Agilent Technologies, Palo Alto, CA) using the RNA 6.000 LabChip kit (Agilent Technologies) according to the manufacturer's instructions. Microarray expression analysis using GeneChip® Mouse Genome Arrays 430A 2.0 and data analysis were performed as described previously (36).
For quantitative real time PCR analysis (qPCR), total RNA was reversely transcribed (Superscript II, Invitrogen) with oligo(dT) primer. cDNA from 500 ng of total RNA was subjected to qPCR using Platinum-SYBR Green® qPCR Supermix (Invitrogen), 0.6 μm forward and reverse primers, and 100 nm ROXTM (5-carboxy-X-rhodamine, passive reference dye). Oligonucleotide primers (supplemental Table S2) were designed with the Primer3 software (37) to flank intron sequences. qPCR was performed by an MX 3000P instrument (Stratagene, La Jolla, CA) using the following protocol: 2 min at 50 °C, 2 min at 95 °C and 50 cycles of 15 s at 95 °C and 30 s at 60 °C. A product melting curve was recorded to confirm the presence of a single amplicon. The correct amplicon size and identity were additionally confirmed by agarose gel electrophoresis and restriction enzyme cleavage or sequencing. Standard curves with serial dilutions of cDNA were generated for each primer pair to assert linear amplification. Threshold cycle (Ct) values were set within the exponential phase of the PCR. After normalization to β2-microglobulin, ΔCt values were used to calculate the relative expression levels (38). Gene regulation was statistically evaluated by subjecting the ΔΔCt values derived from matched littermate samples to a two-sided Student's t test assuming equal variances. Gene regulation ratios are given as 2ΔΔCt values.
Mast Cell Degranulation Assay and Histamine Concentration Measurements
Peritoneal mast cells were obtained by peritoneal lavage from 3-month-old mice and cultured in RPMI 1640 medium (Sigma). A degranulation assay was performed as described previously (16). Briefly, peritoneal mast cells were adjusted to equal numbers per reaction assembly and stimulated with P-lyso-PS (10 μm). After incubation for 20 min, suspensions were centrifuged, and supernatant and pellet were resuspended separately in 1 ml of Ca2+/Mg2+-free Tyrode's buffer. Histamine was extracted using bis-(2-ethylhexyl)-phosphoric acid in heptane. For quantification through a fluorescence detector, derivatization of histamine was performed with o-phthaldialdehyde. After filtration and degassing of the individual extracts, histamine concentration was obtained by high performance liquid chromatography (HPLC) (KNAUER, Berlin, Germany) with a stationary phase consisting of phenyl on silica gel (Nucleosil®, MACHEREY-NAGEL GmbH & Co. KG, Düren, Germany) and a mobile phase with a sodium dihydrogen phosphate buffer/acetonitrile gradient of 5–50%. Chromatograms were recorded and analyzed by Chromgate® version 3.1 software (KNAUER, Berlin, Germany- based on EZChrom Elite®).
Chemotaxis Assay
A chemotaxis assay was performed using transwell plates (Greiner Bio-One, Solingen, Germany) as described previously (18, 39). Cells were harvested by peritoneal lavage with PBS, centrifuged, and resuspended in DMEM (plus 0.5% FBS, penicillin/streptomycin) for each mouse separately. A dry non-coated polycarbonate filter (8-μm pore size) was placed in a cavity of a 24-well plate, and the upper chamber was filled with 150 μl of cell suspension (3.3 × 10⁶ cells/ml). Cells were incubated overnight at 37 °C to allow adhesion onto the membrane. The next day, different concentrations of S-lyso-PS in a volume of 800 μl were applied to the lower chamber. After incubation for 4 h at 37 °C, non-migratory cells on the upper surface of the filter were removed by scraping, and migrated adherent cells on the lower surface of the filter were fixed and stained with the hemacolor set (Merck). The stained cells were counted in four randomly chosen high power fields (×40) for each well. The number of migrated nonadherent cells in the medium of the lower chamber was determined using a Neubauer counting cell chamber.
Glial Swelling Test
GPR34 is highly expressed in glial cells (40) such as astrocytes and microglia (detailed expression data from own studies, see supplemental Table S3). One function of glial cells in brain and retina is the compensation of osmotic imbalances. To assess whether GPR34 is involved in this specific glial function. a retinal glia swelling test was performed. To monitor volume changes of retinal glial cells in response to hypotonic challenge, the somata of glial cells in the inner nuclear layer of retinal slices or the somata of isolated single cells were focused. Filter stripes with the retinal slices (about 1 mm thick) were transferred to recording chambers and kept submerged in extracellular solution. The chambers were mounted on the stage of an upright confocal laser scanning microscope (LSM 510 Meta; Zeiss, Oberkochen, Germany). All experiments were performed at room temperature (20–23 °C). Retinal slices or isolated cells were loaded with the vital dye Mitotracker Orange (10 μm), which has been shown to stain somata of Müller glial cells selectively in the inner nuclear layer of retinal tissues (41). After an incubation time of 3 min, slices or cells were continuously perfused with extracellular solution at a flow rate of 2 ml/min, and recordings were made with an Achroplan 63×/0.9 water immersion objective. The pinhole was set at 172 μm; the thickness of the optical section was adjusted to 1 μm. Mitotracker Orange was excited at 543 nm with an HeNe laser, and emission was recorded with a 560-nm long pass filter. Images were obtained with an x-y frame size of 256 × 256 pixels (73.1 × 73.1 μm). In the course of the experiments, the Mitotracker Orange-stained somata of Müller glial cells were recorded at the plane of their maximal extension. To ensure that the maximum soma area was precisely measured, the focal plane was continuously adjusted in the course of the experiments.
Delayed Type Hypersensitivity (DTH) Response
The DTH response test to methylated BSA (mBSA; Sigma) was performed according to Nambu et al. (42). At day 1, mice were immunized intradermally with 200 μl of 2 mg/ml mBSA emulsified with complete Freund's adjuvant. After 8 days, mice were challenged intradermally in one footpad with 20 μl of 5 mg/ml mBSA in 0.9% NaCl solution and an equal volume of solely 0.9% NaCl solution in the other footpad. Footpad swelling was measured every 12 h over a total time period of 48 h using a millimeter screw (Kroeplin GmbH, Schlüchtern, Germany). DTH reaction was determined as difference between thickness of mBSA- and NaCl solution-injected footpad.
At the end of the experiment, mice were sacrificed, and primary spleen cell cultures were established. Thus, spleen tissue of the individual mice was disintegrated through a 100-μm cell strainer to obtain a single cell suspension in PBS. After erythrocyte lysis with Gey's solution, cells were resuspended (5 × 10⁶ cells/ml in Iscove's medium with glutamine, 10% FBS, 100 units/ml penicillin, 100 μg/ml streptomycin), seeded into 24-well plates, and stimulated with different concentrations of mBSA for 72 h. Cytokine concentrations in supernatants of untreated and mBSA-treated cells were measured in a multiplex assay (Th1/Th2-Kit, Bio-Rad) according to the manufacturer's instructions. For IL-1β and IL-6 measurements, an ELISA kit (BioLegend, Fell, Germany) was used according to the manufacturer's protocol.
Pulmonary Infection with Cryptococcus neoformans
Local infection of mice with C. neoformans was carried out as described previously (43–44). Prior to infection, the encapsulated C. neoformans strain 1841, serotype D, was incubated overnight in Sabouraud dextrose medium (2% glucose, 1% peptone; Sigma) at 30 °C. Twenty μl of a 2.5 × 10⁴ cells/ml Cryptococcus cell suspension (500 colony-forming units) were administered into one nostril. During this procedure, mice were intraperitoneally anesthetized with a 1:1 mixture of 10% ketamine (100 mg/ml; Ceva Animal Health) and 2% xylazine (20 mg/ml; Ceva Animal Health).
Infected mice were observed daily for any signs of morbidity. After 60 days, animals were sacrificed, and lung, spleen, and brain were removed under sterile conditions. All organs were weighed, and equal organ parts were homogenized with an Ultra-Turrax® (T8; Ika-Werke, Staufen, Germany) in 1 ml of PBS. Serial dilutions of homogenates were administered on Sabouraud-dextrose agar plates, and grown colonies were counted after 72 h of incubation at 30 °C.
For cytokine measurements, spleens of sacrificed animals were pooled in groups, and primary spleen cell culture was performed as described above. Cells were incubated with medium (control) or the heat-inactivated acapsular C. neoformans serotype D strain CAP67 (hiCap) (1 × 10⁷ cells/ml) for 72 h at 30 °C. Subsequently, cytokine concentrations in supernatants were determined in a multiplex assay (Th1/Th2-Kit, Bio-Rad).
FACS Analysis
To monitor macrophages by fluorescence, KO mice were crossed into a mouse line expressing enhanced GFP under control of the CX3CR1 receptor promoter (45). The background of both mouse strains was C57BL/6. For experiments, WT and KO animals heterozygous for the CX3CR1 receptor were used. Spleens from naive and mBSA-immunized WT and KO animals were collected individually and disintegrated through a 100-μm nylon cell strainer (BD Biosciences). Erythrocytes were lysed with Gey's solution, and after centrifugation leukocytes were resuspended in FACS/wash buffer (PBS containing 1% FBS and 0.1% NaN3). After Fc-block (FcR blocking reagent, Miltenyi Biotec GmbH, Bergisch Gladbach, Germany), cells were counted, and 105 cells per staining reaction were incubated with labeled antibodies to identify different spleen cell populations. The following antibodies were used: anti-CD3ϵ, -CD8, -Gr1, and -CD11c (BD Biosciences); anti-CD4, -B220, -CD86, and -F4/80 (eBiosciences, Frankfurt, Germany); anti-CD11b (CALTAG, Buckingham, UK), anti-Nkp46 (R&D Systems, Wiesbaden-Nordenstadt, Germany); and anti-CD117 (Miltenyi Biotech GmbH). Measurement of stained cells was performed in a 96-well format with a flow cytometer (FACSCalibur with HTS loader, BD Biosciences).
RESULTS AND DISCUSSION
lyso-PS Is Not an Agonist for Murine and Human GPR34
We initially set out to verify that lyso-PS is an agonist for GPR34 (16). Because GPR34 is coupled to Gi proteins (9, 16), we first performed cAMP inhibition assays where GPR34-transfected COS-7 cells were preincubated with forskolin (10 μm), and P-lyso-PS was applied at different concentrations. We found no P-lyso-PS-induced reduction in cAMP levels (data not shown). P-lyso-PS also failed to stimulate the human GPR34 in Fura-2 calcium measurement and in the Dynamic Mass Redistribution Assay (Corning Epic® Biosensor Measurements) (46) with transiently and stably transfected mammalian cells (data not shown).
Next, we co-transfected COS-7 cells with human or mouse GPR34 and the chimeric G protein Gαqi4. The functionality of this approach, which links signal transduction of a Gi protein-coupled receptor to the phospholipase C/inositol phosphate pathway has been demonstrated for GPR34 (9) and many other GPCR (47). GPR34 activation was measured using an inositol phosphate accumulation assay. Although the Gi protein-coupled ADP receptor P2Y12 showed a robust increase in inositol phosphate levels upon agonist stimulation (methyl-S-adenosine diphosphate), no specific agonistic effect was detected for mouse and human GPR34 orthologs (Fig. 1). Sufficient cellular and plasma membrane expression was verified in total and cellular ELISA (data not shown). Sugo et al. (16) showed that GPR34 activation was dependent on the length of the fatty acid chain in lyso-PS with a preference for long chains, and therefore, S-lyso-PS may also function as an agonist at GPR34. Again, no activation of human and mouse GPR34 was found for S-lyso-PS (Fig. 1). The study of Sugo et al. (16) showed variation of EC50 values among species. Therefore, we tested several GPR34 orthologs. Interestingly, the carp GPR34 subtype 2b (9) displayed a robust response to P-lyso-PS and S-lyso-PS (Fig. 1).
FIGURE 1.

Effect of P- and S-lyso-PS on different GPR34 orthologs in COS-7 cells. COS-7 cells were transiently co-transfected with GPR34 orthologs and human P2Y12 (control) with the chimeric G protein Gαqi4. Listed substances were applied in equal concentrations (10 μm). GFP-transfected cells were used as negative control, whereas the ADP-sensitive receptor P2Y12, stimulated with methyl-S-adenosine diphosphate (MeS-ADP), served as positive control. Results are means ± S.E. (n = 3), with each experiment performed in triplicate. IP, inositol phosphate.
Several Gi protein-coupled receptors of the P2Y12-like receptor group have been functionally expressed in sensitive and convenient yeast expression systems (48, 49). Therefore, several GPR34 orthologs were cloned into the yeast expression plasmid p416GPD and expressed in the S. cerevisiae strain MPY578t5 (allowing coupling of Gi protein-coupled receptors to the yeast mating pathway (50)). This yeast strain is genetically modified such that it requires productive receptor/G protein coupling for growth in histidine-deficient medium. As shown in Fig. 2A, both S-lyso-PS and P-lyso-PS did not activate the human GPR34, although yeast cells expressing the carp GPR34 subtype 2b showed agonist-dependent growth. The carp GPR34 subtype 2a displayed remarkable basal and agonist-dependent activity, whereas carp GPR34 subtype 1 showed low S-lyso-PS-induced activity only at high agonist concentrations (Fig. 2A). To ensure proper expression and coupling of the human GPR34 in this yeast strain, we introduced the activating mutation T264A (9). As expected, the mutant GPR34 mediated agonist-independent yeast cell growth (Fig. 2B).
FIGURE 2.

Functional expression of GPR34 orthologs and mutants in yeast. A, yeast cells expressing the human GPR34 and carp GPR34 subtypes were incubated with different concentrations of P-lyso-PS and S-lyso-PS. Receptor activation-dependent growth was measured as A600 nm after 24 h. B, yeast cells expressing the human (h) GPR34 (hGPR34) and a constitutively active mutant (hGPR34-T264A) were cultured in histidine- and uracil-deficient medium. Receptor activation-dependent growth was measured as A600 nm over time. C, yeast cells expressing the human and carp GPR34 subtype 2a and two chimeric constructs were incubated with increasing concentrations of S-lyso-PS. Receptor activation-dependent growth was measured as A600 nm after 24 h. Details of the constructs and cell surface and total cellular expression levels are given in supplemental Table S15. Mean ± S.E. of one representative assay performed in triplicate is shown.
Next, we approached structural determinants enabling the carp GPR34 subtype 2a to recognize S-lyso-PS as agonist by systematic generation and testing of carp/human GPR34 chimeras (only parts of this study are shown herein). As shown in Fig. 2C, replacing transmembrane regions 3–5 (TM3–5) with the carp subtype 2a resulted in an S-lyso-PS activation of the human GPR34. In contrast, the opposite chimera, TM3–5 of the human GPR34 in the carp subtype 2a, abolished its function (see also supplemental Table S15).
Taken together, different expression and functional systems did not provide evidence for activation of the human and mouse GPR34 by P-lyso-PS, contrary to previous findings (16, 51). Differences in the functional assay setup and cellular expression systems and differences in the purity and chemical composition of P-lyso-PS used may account for this discrepancy. However, our findings are in congruence with another recent study where the human GPR34 did not respond to P-lyso-PS (52). Although several carp GPR34 subtypes displayed activity, mammalian orthologs showed no function upon lyso-PS stimulation in our study. Our studies with chimeric receptors revealed that the ability to be activated by P-lyso-PS can be transferred from carp to human GPR34 by exchanging TM3–5. Preliminary data suggest multiple determinants involved in this species-specific agonist specificity.
GPR34-deficient Mice Show No Obvious Phenotype under Specific Pathogen-free Conditions
To analyze the physiological relevance of GPR34, a gene-deficient mouse strain was established and characterized for a wide range of traits. Hemi- and homozygous GPR34-deficient offspring were vital and fertile. There was no significant difference in litter genotype distribution (see supplemental Fig. S3). Other examined parameters of development, histology, clinical chemistry, and behavior (Table 1) showed no significant differences between WT and KO mice.
TABLE 1.
Basic characterization of GPR34-deficient mice
A number of initial screens was performed to characterize GPR34 deficiency in mice kept under specific pathogen-free conditions. Detailed experimental setups and results are given in the supplemental material.
| Parameter | Result |
|---|---|
| Morphology and histology | |
| Weight development, body length, tail length, fur development, ear erection, abnormalities in teeth or extremities | No abnormalities detected |
| Weight of organs | No significant difference between genotypes (supplemental Table S3) |
| Hematoxylin and eosin and toluidine blue staining of histological slices of main organs | No abnormalities detected |
| Clinical laboratory examinations | |
| Different serum parameters, blood glucose, urine osmolality, differential hemogram, AA/AC screening | No significant difference between genotypes (supplemental Tables S4–S6) |
| Behavioral assays | |
| SHIRPA protocol hot plate test | No significant difference between genotypes (supplemental Table S7) |
| Open field test | Reduced activity of KO mice (supplemental Table S8) |
| Light-dark test | Increased activity of KO mice in the light arena (supplemental Table S8) |
Because our initial studies with KO animals did not reveal the physiological GPR34 function, we analyzed the impact of GPR34 deficiency at the molecular and cellular level. We compared genome-wide myocardial mRNA expression levels in WT and KO mice using microarrays. The myocardium was chosen because previous studies showed high GPR34 expression levels (10) and because myocytes form the great majority of cells in this tissue, making it very homogeneous for mRNA analysis. We identified 360 genes with significantly different regulation (p < 0.01) between the two genotypes. In particular, no GPR34 expression was detected in the myocardium of KO mice, but GPR34 was detected in WT mice (p < 0.0001, see supplemental material and supplemental Table S9 for details). There were no significant changes in established cellular pathways or functions that could be confirmed by qPCR (see supplemental Table S13).
The lack of an obvious phenotype may seem surprising given the gene has been highly conserved in the vertebrate genome for the last 450 million years (9). However, more than 50% of GPCR-deficient mouse strains previously studied exhibited no noticeable differences to WT mice under SFP conditions. Differences were only unveiled when transgenic animals were exposed to specific challenging conditions (53, 54). Thus, we first analyzed the function of three cell types known to express GPR34 (mast cells, monocytes, and glial cells) from transgenic and WT mice, and we further tested whether KO and WT mice differ in their response to pathogens.
Mast Cell Activation by lyso-PS Is Not Mediated through GPR34
Mast cells play an important role in allergy and anaphylaxis and are also involved in wound healing and defense against pathogens. Because lyso-PS activates mast cells (19) and GPR34 is highly expressed in these cells (16), it was speculated that GPR34 mediates mast cell degranulation (16). Taking advantage of our Gpr34-KO mouse model, we asked whether GPR34 mediates lyso-PS-induced mast cell activation. As shown in Fig. 3, P-lyso-PS increased histamine release from peritoneal mast cells, but there was no significant difference between cells from WT and KO mice. We also found no differences between WT and KO cells (data not shown) when histamine release was induced by co-stimulation of the mast cell IgE receptor with anti-2,4-dinitrophenyl-IgE/2,4-dinitrophenyl-BSA and P-lyso-PS (16). Our data clearly indicate that P-lyso-PS does not mediate the histamine release from peritoneal mast cells via activation of GPR34. This is well in line with our finding that lyso-PS did not activate the murine GPR34 (Fig. 1) and is further supported by a recent study showing that lyso-phosphatidylthreonine induces mast cell degranulation with higher potency than lyso-PS. However, lyso-phosphatidylthreonine did not activate GPR34 (51). It remains open whether lyso-PS induces histamine release through phospholipase C-mediated Ca2+ increase via another currently unknown pertussis toxin-sensitive GPCR or via a pertussis toxin-insensitive pathway (18, 20).
FIGURE 3.
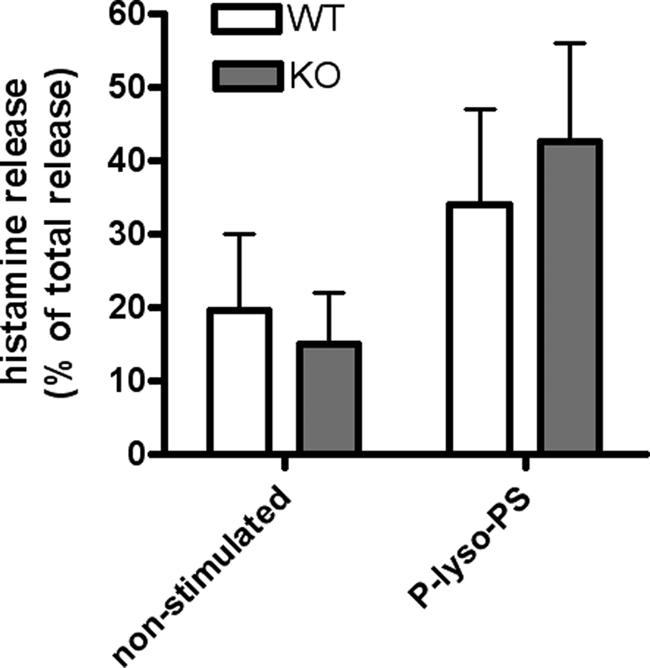
Histamine release from peritoneal mast cells. Peritoneal mast cells from WT and KO mice were obtained by peritoneal lavage and enriched by short term cultivation. Cells were stimulated with P-lyso-PS (10 μm), and histamine contents were measured in the pellet and supernatant. Results are shown for P-lyso-PS-stimulated cells in comparison with untreated mast cells. Histamine release in the supernatant is given in % of total histamine release in both pellet and supernatant. Results are means ± S.E. of a representative assay (total number of experiments = 3 and number of animals per genotype in each assay = 6), with each experiment performed in duplicate.
Peritoneal Monocytes from GPR34-deficient Mice Show Elevated Basal Migration
Several studies reported that lyso-PS has a chemotactic effect on migrating cells (18, 20, 21). Using our KO mouse model, we tested whether GPR34 is involved in lyso-PS-induced cell migration. As shown in Fig. 4, S-lyso-PS induced migration of peritoneal monocytes from WT mice. This effect was abolished in cells from KO animals. However, basal migration of GPR34-deficient cells was already 1.8-fold higher in comparison with basal migration of WT cells expressing GPR34 (Fig. 4), although chemotaxis in WT cells reached only a 1.4-fold increase under maximum stimulation. Undirected migration of KO peritoneal monocytic cells appeared to be already increased under basal conditions, and lyso-PS did not further enhance migration. Therefore, it remains open whether GPR34 is involved in lyso-PS-induced cell migration.
FIGURE 4.
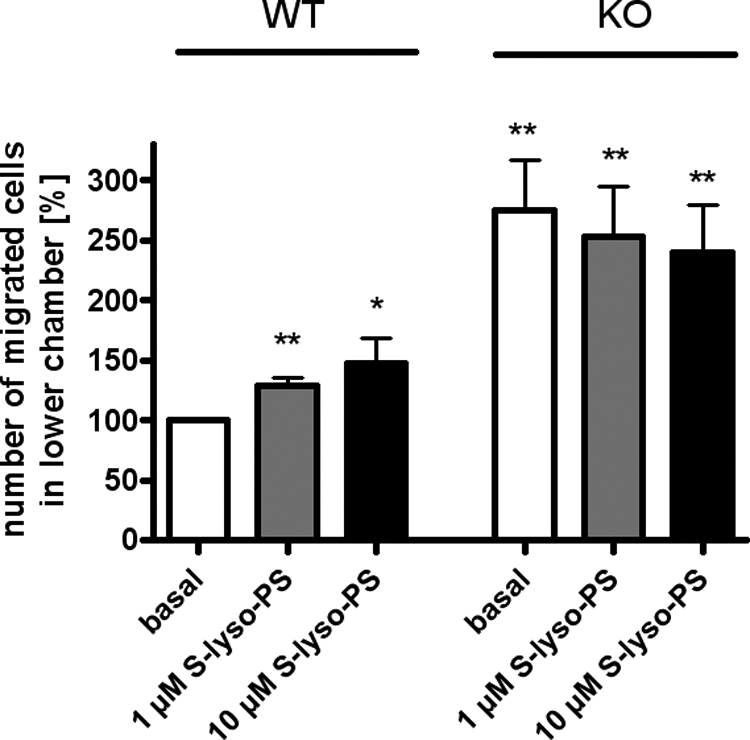
Chemotaxis of peritoneal monocytic cells. Cells were incubated with different concentrations of S-lyso-PS, and cell migration was determined as described under “Experimental Procedures.” The percentage of cells migrated into the lower chamber in relation to WT basal migration (set as 100% = 5.6 × 10⁵ cells) is given. Results are means ± S.E. (number of animals per group = 5) with each experiment performed in duplicate. Differences to non-stimulated migration of WT cells were tested for significance with Student's t test: *, p < 0.05; **, p < 0.01.
Cell Swelling Is Altered in Retinal Glial Cells from GPR34-deficient Mice
GPR34 is highly expressed in glial cells (40). Additionally to their function in immune response, glial cells are important for maintaining osmotic homeostasis in brain and brain-derived tissues such as retinae (55). Therefore, the relevance of GPR34 function in glial cells was tested in retinal glial cell swelling experiments. Normally, mouse retinal glial cells display only a slight, non-significant increase in the size of their cell bodies within 4 min of hypotonic exposure (Fig. 5). It has been shown that murine retinal glial cells maintain their cell volume constant up to 20 min of hypotonic exposure before cellular swelling becomes obvious (56). The lack of significant cellular swelling under these conditions can be explained by the activation of an endogenous purinergic signaling cascade (57). As shown in Fig. 5A, GPR34 deficiency caused a significant increase in retinal cell swelling in response to hypoosmotic challenging. Next, we tested isolated Müller cells, the retinal glial cells that mediate inner retinal osmohomeostasis, in this assay. Again, the resistance of GPR34-deficient Müller cells to hypoosmotic challenge was significantly reduced compared with cells from WT animals (Fig. 5B). This indicates an involvement of GPR34 in maintaining the osmotic homeostasis of glial cells. Further experiments are needed to elucidate the physiological consequence of this cellular phenotype.
FIGURE 5.

Cell swelling is altered in retinal glial cells from GPR34-deficient mice. A, perfusion of retinal slices from WT and KO mice with a hypoosmolar solution (containing 60% of control osmolarity) in the absence (control) and presence of barium chloride (1 mm) resulted in a swelling of glial somata. Mean ± S.E. soma areas of retinal glial cells were measured after perfusion with a hypoosmolar solution for 4 min. Data are expressed in percent of the soma size recorded before hypoosmotic challenge (100%). Note that perfusion of retinal slices from WT animals with hypoosmolar solution for 4 min did not significantly increase the size of glial cell somata. However, hypoosmotic swelling of glial somata was evoked in the presence of barium chloride (1 mm). The bar diagrams display data obtained in 13–21 cells from retinae of two different animals each. B, same investigations were performed with isolated Müller cells (5–7 cells/bar). Significant differences to WT control: **, p < 0.01; ***, p < 0.001. Significant differences between KO and WT in the presence of barium chloride: ●●, p < 0.01; ●●●, p < 0.001.
Increased DTH Reaction in GPR34-deficient Mice
Because GPR34 is highly expressed in immune cells (10, 16, 40), we challenged the immune system in a DTH test to screen for differences between WT and KO mice. The DTH test investigates the reaction of the organism toward an antigen after prior immunization. The local reaction after re-exposure to the same antigen is quantified by measuring footpad swelling. As shown in Fig. 6, footpad swelling was significantly increased in KO mice 24 h after mBSA injection in the footpad and remained significantly different over the entire observation time. The increased DTH reaction in KO mice was accompanied by an elevated basal concentration of almost all examined cytokines in the supernatant of spleen cell cultures (Table 2). The increased cytokine levels were global and therefore cannot be referred to as either regulatory (IL-10) or proinflammatory (TNF-α, IL-6) Th1 (IFN-γ, IL-2, IL-12) or Th2 (IL-4, IL-5) cytokines. Re-stimulation of cultivated spleen cells with mBSA led to increases of most cytokine concentrations in both genotypes (Table 2). Although the cytokine levels in cell supernatants of KO mice were higher than in WT upon mBSA exposure. the concentration gain was significantly higher for WT cells, except for IL-2.
FIGURE 6.
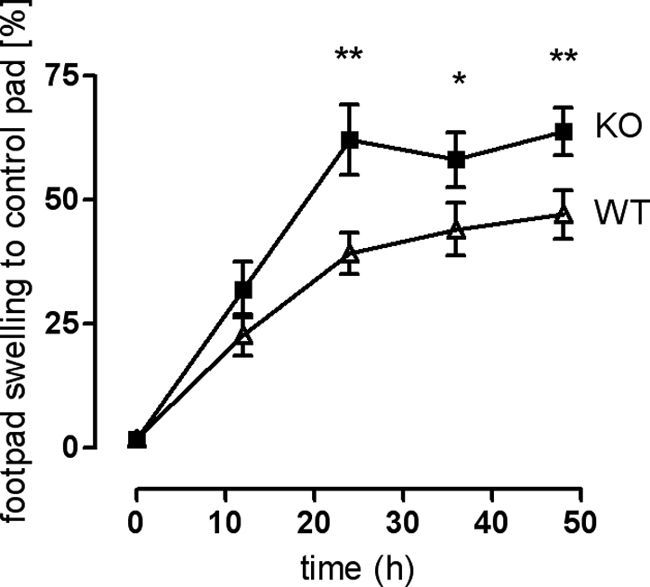
Increased footpad swelling (DTH test) in GPR34-deficient mice. Mice were immunized with mBSA. Eight days post-infection, one footpad was injected with mBSA, and the other was injected with 0.9% NaCl solution (control). Footpad thickness was measured using a millimeter screw. The graph shows swelling of mBSA-injected footpad in relation to reference footpad over a period of 48 h. Results are means ± S.D. from two independent experiments with 10 animals per genotype per experiment. Swelling differences between KO and WT were tested for significance using Student's t test: *, p < 0.05; **, p < 0.01.
TABLE 2.
Quantification of different cytokines in spleen cell cultures of DTH-treated mice
Spleens (10 per genotype) were removed from animals of the DTH test, and spleen cells were cultivated. In supernatants of untreated and mBSA-incubated spleen cells, cytokine levels were determined as described under “Experimental Procedures.” Results are means ± S.E. Significant differences between genotypes are marked in boldface.
| Non-stimulated |
mBSA (20 μg/ml) |
|||
|---|---|---|---|---|
| WT | KO | WT | KO | |
| pg/ml | pg/ml | |||
| TNF-α | 19.5 ± 0.8 | 48.7 ± 3.8a | 69.7 ± 1.5 | 103 ± 6a |
| IFN-γ | 76.0 ± 25.0 | 329 ± 56b | 366 ± 55 | 735 ± 90b |
| GM-CSF | 31.8 ± 4.2 | 128 ± 10a | 228 ± 3 | 402 ± 63 |
| IL-1βc | 105 ± 4.4 | 109 ± 5.1 | 116 ± 13 | 91.2 ± 2.5 |
| IL-2 | 558 ± 90 | 2290 ± 86a | 557 ± 6 | 2684 ± 317a |
| IL-4 | 12.0 ± 1.0 | 58.4 ± 3.3a | 43.2 ± 2.6 | 38.2 ± 3.4 |
| IL-5 | 9.9 ± 2.2 | 47.1 ± 8.9b | 47.5 ± 1.7 | 122 ± 8a |
| IL-6c | 118 ± 8.2 | 172 ± 16 | 187 ± 16 | 190 ± 5.5 |
| IL-10 | 24.8 ± 4.4 | 127 ± 6a | 18.3 ± 0.8 | 48.2 ± 4.6b |
| IL-12 | 3.3 ± 0.2 | 11.4 ± 0.7a | 18.0 ± 2.3 | 17.1 ± 0.8 |
a p < 0.01.
b p < 0.05.
c Cytokines were measured by ELISA (BioLegend GmbH, Fell, Germany).
The DTH test indicates the ability of the organism to respond to an antigen at re-exposition. Immunocompromised individuals barely develop a paw swelling (58), whereas increased paw edema may be a sign of an increased active immune system as seen in KO mice. Despite disparity in paw swelling, no striking differences were detected in histological sections of WT and KO paws (data not shown).
To further analyze the role of GPR34 in the immune system, we examined spleen cell populations and immunoglobulin levels in mBSA-immunized mice. ELISA measurements of IgG1 (indicator for a Th2 response) and IgG2 (indicator for a Th1 response) in naive animals showed no difference in basal immunoglobulin levels, whereas the IgG1 level in mBSA-immunized WT animals was higher compared with those in KO animals. A significant difference is seen in the IgG2a:IgG1 ratio between WT and KO animals (see supplemental Fig. S5).
Next, spleen cell populations were quantified in naive mice and mBSA-immunized WT and KO mice by FACS analysis. To monitor macrophages by fluorescence, KO mice were crossed into a mouse line expressing enhanced GFP under control of the CX3CR1 receptor promoter (45). There were no significant differences in spleen cell populations between naive WT and KO mice. In WT mice, mBSA immunization resulted in a significant increase in granulocyte/macrophage (CD11b+/Gr1+) and mast cell (CD117+) fractions (Table 3). In contrast, spleens of mBSA-immunized KO mice displayed significantly lower fractions of granulocyte/macrophage and mast cells. Analysis of granulocyte/macrophage subpopulations (CD86+ or CD86−, CX3CR1+ or CX3CR1−) did not reveal a specific population that causes this difference. It appears that migration and/or proliferation of granulocytes/macrophages in(to) the spleen is/are disturbed in KO mice.
TABLE 3.
FACS analysis of spleen cells
Spleen cell populations were labeled with different antibodies (see “Experimental Procedures”) and analyzed by flow cytometry (FACS). Naive WT and KO animals showed no significant differences in spleen cell populations. However, immunization of animals with mBSA resulted in significant differences in specific spleen cell populations between WT and KO animals. Data, % of all spleen cells, are given as means ± S.D.
| Cell population (marker) | WT naive (n = 5) | KO naive (n = 5) | WT mBSA (n = 8) | KO mBSA (n = 8) |
|---|---|---|---|---|
| % total spleen cells | % of total spleen cells | |||
| T cells (CD3+) | 49.84 ± 8.57 | 54.47 ± 6.80 | 43.49 ± 9.36 | 48.27 ± 6.42 |
| TH cells (CD4+) | 28.73 ± 5.02 | 32.24 ± 4.16 | 25.06 ± 6.46 | 28.47 ± 3.95 |
| Tc cells (CD8+) | 16.07 ± 4.85 | 17.79 ± 1.96 | 14.72 ± 3.50 | 14.61 ± 2.37 |
| Mast cells (CD117+) | 0.55 ± 0.12 | 0.55 ± 0.10 | 1.38 ± 0.54 | 0.81 ± 0.28a |
| Granulocytes, macrophages (CD11b+/Gr1+) | 2.30 ± 0.15 | 2.89 ± 0.86 | 11.7 ± 3.96 | 5.10 ± 1.70b |
| Granulo/macrophages (CX3CR1+) | 1.70 ± 0.21 | 2.07 ± 0.35 | 5.41 ± 1.39 | 3.08 ± 0.82b |
| Granulo/macrophages (CX3CR1−) | 0.55 ± 0.10 | 0.78 ± 0.63 | 6.22 ± 2.63 | 1.99 ± 0.95b |
| Activated granulo/macrophages (CD86+) | 1.29 ± 0.13 | 1.48 ± 0.37 | 4.15 ± 1.12 | 2.43 ± 0.72b |
| Subpopulation (CX3CR1+) | 3.05 ± 0.95 | 1.62 ± 0.53b | ||
| Subpopulation (CX3CR1−) | 1.10 ± 0.30 | 0.71 ± 0.29a | ||
| Non-activated granulo/macrophages (CD86−) | 0.75 ± 0.09 | 1.13 ± 0.53 | 7.16 ± 2.83 | 2.43 ± 1.05b |
| Subpopulation (CX3CR1+) | 4.80 ± 2.33 | 1.14 ± 0.70b | ||
| Subpopulation (CX3CR1−) | 1.88 ± 0.48 | 1.07 ± 0.37b | ||
| Spleen cells (CX3CR+) | 4.26 ± 1.04 | 4.35 ± 0.24 | 7.38 ± 1.37 | 5.90 ± 1.34 |
a p < 0.05.
b p < 0.01.
GPR34-deficient Mice Are More Susceptible toward a Disseminating C. neoformans Infection
Countering pathogen infection is a natural function of the immune system. The encapsulated yeast-like fungus C. neoformans is the cause of systemic cryptococcosis, which develops after inhalation of the pathogen. The formation of pathogen-containing granuloma in the lung is the first stage of the disease. Depending on the effectiveness of the host cellular immune defense system, the fungus can spread into different organs, primarily the brain, and it finally causes death. Microglia represents the main source of the cellular immune defense in the brain. Because GPR34 is highly expressed in microglia (40), we tested whether the central nervous progression of C. neoformans infection is altered in KO mice.
WT and KO mice were infected intranasally, and the progression of the disease was monitored. Although there was no significant difference in the survival rate (data not shown), KO mice showed significantly higher pathogen burden in lung, spleen, and brain (Fig. 7) 2 months post-infection.
FIGURE 7.
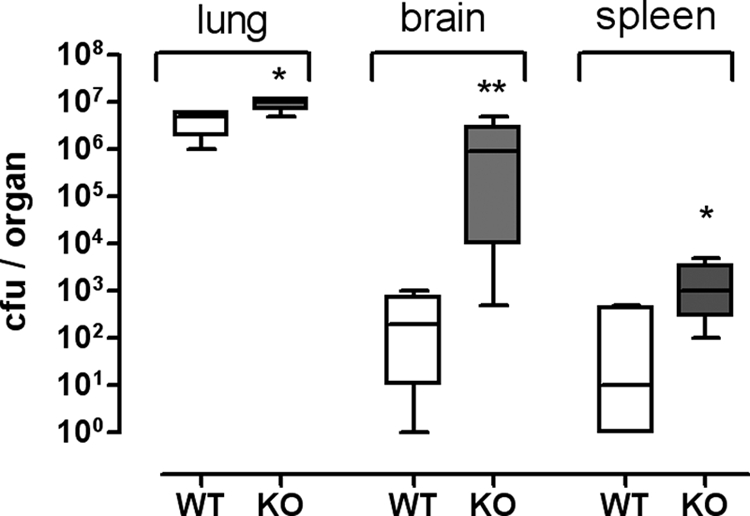
GPR34-deficient mice show an increased pathogen burden after infection with C. neoformans. WT and KO mice were intranasally infected with C. neoformans. Animals were sacrificed after 60 days, and lung, brain, and spleen were removed. Fungal burden was determined by counting of growing colonies on agar plates plated with organ suspensions (n = 4 animals per genotype). Means, 95% percentiles and ranges are given. *, p < 0.05; **, p < 0.01.
To assess cytokine production in non-infected and infected mice, spleen cells were cultured and incubated with C. neoformans antigen (hiCap). Cells from non-infected naive animals displayed no genotype-specific differences in cytokine concentrations (see supplemental Table S14). However, cells from infected KO mice showed significantly higher cytokine concentrations under basal conditions than WT cells (Table 4). Re-exposition with hiCap led to an increase in all cytokine concentrations in WT, although in cells from KO mice, only TNF-α, IL-4, and IL-12 concentrations increased. Interestingly, elevated cytokine concentrations after re-exposition of WT cells with hiCap did not reach basal KO cytokine levels (Table 4). These data confirm the results from the DTH test (see above) that immune cells from KO mice exhibit higher basal levels of cytokines post-infection.
TABLE 4.
Quantification of different cytokines in supernatants of spleen cells of Cryptococcus-infected mice
Two months after nasal infection with C. neoformans, spleen cells (four animals per genotype) were cultivated. In supernatants of non-stimulated and hiCap-incubated pooled spleen cells, cytokine levels were determined as described under “Experimental Procedures.” Results are means ± S.E. Significant differences between genotypes are marked in boldface. ND means not detectable, below detection limit.
| Non-stimulated |
hiCap |
|||
|---|---|---|---|---|
| WT | KO | WT | KO | |
| pg/ml | pg/ml | |||
| TNF-α | 1.9 ± 0.7 | 12.7 ± 1.9a | 362 ± 34 | 795 ± 175b |
| IFN-γ | ND | 62.4 ± 7.9a | ND | 18.5 ± 12.7 |
| GM-CSF | 10.1 ± 2.5 | 24.8 ± 1.9a | 15.9 ± 1.4 | 20.2 ± 0.9a |
| IL-2 | 25.7 ± 2.8 | 135.8 ± 3.8a | 28.3 ± 2.6 | 48.5 ± 0.6a |
| IL-4 | 9.0 ± 0.4 | 19.6 ± 0.8a | 18.7 ± 1.2 | 39.3 ± 4.2a |
| IL-5 | 35.5 ± 5.1 | 116 ± 1a | 49.9 ± 6.2 | 81.7 ± 6.0a |
| IL-10 | 15.4 ± 2.6 | 72.3 ± 10.1a | 25.6 ± 5.3 | 38.6 ± 6.6 |
| IL-12 | 1.1 ± 1.3 | 4.6 ± 1.8 | 2.8 ± 0.2 | 7.0 ± 1.5a |
a p < 0.01.
b p < 0.05.
CD4+ T lymphocytes play a pivotal role in the cellular immune response against C. neoformans (59). Also, the cytokine profile is decisive for the outcome; a preponderance of inflammatory Th1 cytokines is a prerequisite for an efficient defense against the pathogen, whereas a Th2 dominant cytokine profile leads to loss of control of fungal growth and therefore facilitates its spread throughout the body (60). Both Th1 and Th2 cytokines are involved in the response against C. neoformans infection and, consistently, an imbalanced activity toward Th2 cytokines has been associated with an increased fungal burden (43, 44, 61, 62). We conclude that KO mice are less efficient in the defense of C. neoformans infection due to an inadequate activation of the immune system. One can speculate that an improper macrophage function, which was observed already in immunization experiments (see above), may account for increased pathogen burden in KO mice.
Conclusion
We used a KO mouse model to study the function of the evolutionary highly conserved GPR34. We found no experimental support that GPR34 is the receptor for lyso-PS, in line with recent work from other groups. Furthermore, we found no evidence that the known effects of lyso-PS, such as mast cell degranulation and cell migration, are mediated via GPR34. GPR34 deficiency is compatible with life, development, fertility, and gross physiological functions under sterile specific pathogen-free conditions. However, GPR34 function appears to be required for an adequate response of the immune system to antigen and pathogen contact.
Supplementary Material
Acknowledgments
We are very grateful to C. Deng and J. Wess for their initial help in generating the transgenic mouse. We especially thank Susann Lautenschläger for excellent technical assistance and help in different methods. We thank Rainer Strotmann and Evi Kostenis for functional testing of GPR34 in Fura-2 calcium measurements and the Epic system (Corning Glass), respectively. We thank K. Krohn (core unit “DNA Technologies,” IZKF Leipzig) for performing the microarray measurements.
This work was supported by the Deutsche Forschungsgemeinschaft Grant Scho 624/7-1, FOR 748.

The on-line version of this article (available at http://www.jbc.org) contains supplemental Tables S1–S15 and Figs. S1–S5.
- GPCR
- G protein-coupled receptor
- DTH
- delayed type hypersensitivity
- hiCap
- heat-inactivated acapsular C. neoformans serotype D strain CAP67
- lyso-PS
- lyso-phosphatidylserine
- P-lyso-PS
- 1-palmitoyl-lyso-phosphatidylserine
- qPCR
- quantitative real time PCR analysis
- S-lyso-PS
- 1-stearyl-lyso-phosphatidylserine
- TM
- transmembrane region
- mBSA
- methylated BSA.
REFERENCES
- 1. Fredriksson R., Schiöth H. B. (2005) Mol. Pharmacol. 67, 1414–1425 [DOI] [PubMed] [Google Scholar]
- 2. Wigglesworth M. J., Wolfe L. A., Wise A. (2006) Ernst Schering Found. Symp. Proc. 105–143 [DOI] [PubMed] [Google Scholar]
- 3. Fredriksson R., Lagerström M. C., Lundin L. G., Schiöth H. B. (2003) Mol. Pharmacol. 63, 1256–1272 [DOI] [PubMed] [Google Scholar]
- 4. Schöneberg T., Hermsdorf T., Engemaier E., Engel K., Liebscher I., Thor D., Zierau K., Römpler H., Schulz A. (2007) Purinergic Signal. 3, 255–268 [DOI] [PMC free article] [PubMed] [Google Scholar]
- 5. Foster C. J., Prosser D. M., Agans J. M., Zhai Y., Smith M. D., Lachowicz J. E., Zhang F. L., Gustafson E., Monsma F. J., Jr., Wiekowski M. T., Abbondanzo S. J., Cook D. N., Bayne M. L., Lira S. A., Chintala M. S. (2001) J. Clin. Invest. 107, 1591–1598 [DOI] [PMC free article] [PubMed] [Google Scholar]
- 6. Hollopeter G., Jantzen H. M., Vincent D., Li G., England L., Ramakrishnan V., Yang R. B., Nurden P., Nurden A., Julius D., Conley P. B. (2001) Nature 409, 202–207 [DOI] [PubMed] [Google Scholar]
- 7. Marchese A., Sawzdargo M., Nguyen T., Cheng R., Heng H. H., Nowak T., Im D. S., Lynch K. R., George S. R., O'dowd B. F. (1999) Genomics 56, 12–21 [DOI] [PubMed] [Google Scholar]
- 8. Schöneberg T., Schulz A., Grosse R., Schade R., Henklein P., Schultz G., Gudermann T. (1999) Biochim. Biophys. Acta 1446, 57–70 [DOI] [PubMed] [Google Scholar]
- 9. Schulz A., Schöneberg T. (2003) J. Biol. Chem. 278, 35531–35541 [DOI] [PubMed] [Google Scholar]
- 10. Engemaier E., Römpler H., Schöneberg T., Schulz A. (2006) Genomics 87, 254–264 [DOI] [PubMed] [Google Scholar]
- 11. Boucher C. A., Sargent C. A., Ogata T., Affara N. A. (2001) J. Med. Genet. 38, 591–598 [DOI] [PMC free article] [PubMed] [Google Scholar]
- 12. Novak A., Akasaka T., Manske M., Gupta M., Witzig T., Dyer M. J. S., Dogan A., Remstein E., Ansell S. (2008) 50th Annual Meeting and Exposition, December 6–8, 2008, American Society of Hematology, Poster 2251, San Francisco [Google Scholar]
- 13. Wlodarska I., Tousseyn T., De Leval L., Ferreiro J., Urbankova H., Michaux L., Dierickx D., Wolter P., Vandenberghe P., Marynen P., De Wolf-Peeters C., Baens M. (2009) Haematologica 94, 271–272 [Google Scholar]
- 14. Tabata K., Baba K., Shiraishi A., Ito M., Fujita N. (2007) Biochem. Biophys. Res. Commun. 363, 861–866 [DOI] [PubMed] [Google Scholar]
- 15. Nonaka Y., Hiramoto T., Fujita N. (2005) Biochem. Biophys. Res. Commun. 337, 281–288 [DOI] [PubMed] [Google Scholar]
- 16. Sugo T., Tachimoto H., Chikatsu T., Murakami Y., Kikukawa Y., Sato S., Kikuchi K., Nagi T., Harada M., Ogi K., Ebisawa M., Mori M. (2006) Biochem. Biophys. Res. Commun. 341, 1078–1087 [DOI] [PubMed] [Google Scholar]
- 17. Aoki J., Nagai Y., Hosono H., Inoue K., Arai H. (2002) Biochim. Biophys. Acta 1582, 26–32 [DOI] [PubMed] [Google Scholar]
- 18. Park K. S., Lee H. Y., Kim M. K., Shin E. H., Jo S. H., Kim S. D., Im D. S., Bae Y. S. (2006) Mol. Pharmacol. 69, 1066–1073 [DOI] [PubMed] [Google Scholar]
- 19. Bellini F., Viola G., Menegus A. M., Toffano G., Bruni A. (1990) Biochim. Biophys. Acta 1052, 216–220 [DOI] [PubMed] [Google Scholar]
- 20. Park K. S., Lee H. Y., Kim M. K., Shin E. H., Bae Y. S. (2005) Biochem. Biophys. Res. Commun. 333, 353–358 [DOI] [PubMed] [Google Scholar]
- 21. Lee S. Y., Lee H. Y., Kim S. D., Jo S. H., Shim J. W., Lee H. J., Yun J., Bae Y. S. (2008) Biochem. Biophys. Res. Commun. 374, 147–151 [DOI] [PubMed] [Google Scholar]
- 22. Mumberg D., Müller R., Funk M. (1995) Gene 156, 119–122 [DOI] [PubMed] [Google Scholar]
- 23. Okayama H., Berg P. (1983) Mol. Cell. Biol. 3, 280–289 [DOI] [PMC free article] [PubMed] [Google Scholar]
- 24. Thor D., Schulz A., Hermsdorf T., Schöneberg T. (2008) Biochem. J. 412, 103–112 [DOI] [PubMed] [Google Scholar]
- 25. Römpler H., Stäubert C., Thor D., Schulz A., Hofreiter M., Schöneberg T. (2007) Mol. Interv. 7, 17–25 [DOI] [PubMed] [Google Scholar]
- 26. Berridge M. J. (1983) Biochem. J. 212, 849–858 [DOI] [PMC free article] [PubMed] [Google Scholar]
- 27. Böselt I., Römpler H., Hermsdorf T., Thor D., Busch W., Schulz A., Schöneberg T. (2009) PLoS ONE 4, e5573 [DOI] [PMC free article] [PubMed] [Google Scholar]
- 28. Sunahara R. K., Dessauer C. W., Whisnant R. E., Kleuss C., Gilman A. G. (1997) J. Biol. Chem. 272, 22265–22271 [DOI] [PubMed] [Google Scholar]
- 29. Müller P., Schulze A., Schindler I., Ethofer T., Buehrdel P., Ceglarek U. (2003) Clin. Chim. Acta 327, 47–57 [DOI] [PubMed] [Google Scholar]
- 30. Ceglarek U., Müller P., Stach B., Bührdel P., Thiery J., Kiess W. (2002) Clin. Chem. Lab. Med. 40, 693–697 [DOI] [PubMed] [Google Scholar]
- 31. Masuya H., Inoue M., Wada Y., Shimizu A., Nagano J., Kawai A., Inoue A., Kagami T., Hirayama T., Yamaga A., Kaneda H., Kobayashi K., Minowa O., Miura I., Gondo Y., Noda T., Wakana S., Shiroishi T. (2005) Mamm. Genome 16, 829–837 [DOI] [PubMed] [Google Scholar]
- 32. Rogers D. C., Fisher E. M., Brown S. D., Peters J., Hunter A. J., Martin J. E. (1997) Mamm. Genome 8, 711–713 [DOI] [PubMed] [Google Scholar]
- 33. Plyusnina I., Oskina I. (1997) Physiol. Behav. 61, 381–385 [DOI] [PubMed] [Google Scholar]
- 34. Crawley J., Goodwin F. K. (1980) Pharmacol. Biochem. Behav. 13, 167–170 [DOI] [PubMed] [Google Scholar]
- 35. Albert F. W., Shchepina O., Winter C., Römpler H., Teupser D., Palme R., Ceglarek U., Kratzsch J., Sohr R., Trut L. N., Thiery J., Morgenstern R., Plyusnina I. Z., Schöneberg T., Pääbo S. (2008) Horm. Behav. 53, 413–421 [DOI] [PubMed] [Google Scholar]
- 36. Schliebe N., Strotmann R., Busse K., Mitschke D., Biebermann H., Schomburg L., Köhrle J., Bär J., Römpler H., Wess J., Schöneberg T., Sangkuhl K. (2008) Am. J. Physiol. Renal Physiol 295, F1177–F1190 [DOI] [PubMed] [Google Scholar]
- 37. Rozen S., Skaletsky H. J. (2000) Primer3 on the WWW for General Users and for Biologist Programmers, Humana Press Inc., Totowa, NJ: [DOI] [PubMed] [Google Scholar]
- 38. Livak K. J., Schmittgen T. D. (2000) Methods Mol. Biol. 132, 365–386 10547847 [Google Scholar]
- 39. Bae Y. S., Yi H. J., Lee H. Y., Jo E. J., Kim J. I., Lee T. G., Ye R. D., Kwak J. Y., Ryu S. H. (2003) J. Immunol. 171, 6807–6813 [DOI] [PubMed] [Google Scholar]
- 40. Bédard A., Tremblay P., Chernomoretz A., Vallières L. (2007) Glia 55, 777–789 [DOI] [PubMed] [Google Scholar]
- 41. Uckermann O., Iandiev I., Francke M., Franze K., Grosche J., Wolf S., Kohen L., Wiedemann P., Reichenbach A., Bringmann A. (2004) Glia 45, 59–66 [DOI] [PubMed] [Google Scholar]
- 42. Nambu A., Nakae S., Iwakura Y. (2006) Int. Immunol. 18, 701–712 [DOI] [PubMed] [Google Scholar]
- 43. Kleinschek M. A., Muller U., Brodie S. J., Stenzel W., Kohler G., Blumenschein W. M., Straubinger R. K., McClanahan T., Kastelein R. A., Alber G. (2006) J. Immunol. 176, 1098–1106 [DOI] [PubMed] [Google Scholar]
- 44. Müller U., Stenzel W., Köhler G., Werner C., Polte T., Hansen G., Schütze N., Straubinger R. K., Blessing M., McKenzie A. N., Brombacher F., Alber G. (2007) J. Immunol. 179, 5367–5377 [DOI] [PubMed] [Google Scholar]
- 45. Jung S., Aliberti J., Graemmel P., Sunshine M. J., Kreutzberg G. W., Sher A., Littman D. R. (2000) Mol. Cell. Biol. 20, 4106–4114 [DOI] [PMC free article] [PubMed] [Google Scholar]
- 46. Schröder R., Merten N., Mathiesen J. M., Martini L., Kruljac-Letunic A., Krop F., Blaukat A., Fang Y., Tran E., Ulven T., Drewke C., Whistler J., Pardo L., Gomeza J., Kostenis E. (2009) J. Biol. Chem. 284, 1324–1336 [DOI] [PubMed] [Google Scholar]
- 47. Kostenis E., Waelbroeck M., Milligan G. (2005) Trends Pharmacol. Sci. 26, 595–602 [DOI] [PubMed] [Google Scholar]
- 48. Pausch M. H., Lai M., Tseng E., Paulsen J., Bates B., Kwak S. (2004) Biochem. Biophys. Res. Commun. 324, 171–177 [DOI] [PubMed] [Google Scholar]
- 49. Chambers J. K., Macdonald L. E., Sarau H. M., Ames R. S., Freeman K., Foley J. J., Zhu Y., McLaughlin M. M., Murdock P., McMillan L., Trill J., Swift A., Aiyar N., Taylor P., Vawter L., Naheed S., Szekeres P., Hervieu G., Scott C., Watson J. M., Murphy A. J., Duzic E., Klein C., Bergsma D. J., Wilson S., Livi G. P. (2000) J. Biol. Chem. 275, 10767–10771 [DOI] [PubMed] [Google Scholar]
- 50. Pausch M. H. (1997) Trends Biotechnol. 15, 487–494 [DOI] [PubMed] [Google Scholar]
- 51. Iwashita M., Makide K., Nonomura T., Misumi Y., Otani Y., Ishida M., Taguchi R., Tsujimoto M., Aoki J., Arai H., Ohwada T. (2009) J. Med. Chem. 52, 5837–5863 [DOI] [PubMed] [Google Scholar]
- 52. Yin H., Chu A., Li W., Wang B., Shelton F., Otero F., Nguyen D. G., Caldwell J. S., Chen Y. A. (2009) J. Biol. Chem. 284, 12328–12338 [DOI] [PMC free article] [PubMed] [Google Scholar]
- 53. Schöneberg T., Schulz A., Biebermann H., Hermsdorf T., Römpler H., Sangkuhl K. (2004) Pharmacol. Ther. 104, 173–206 [DOI] [PubMed] [Google Scholar]
- 54. Barbaric I., Miller G., Dear T. N. (2007) Brief Funct. Genomic Proteomic 6, 91–103 [DOI] [PubMed] [Google Scholar]
- 55. Housley G. D., Bringmann A., Reichenbach A. (2009) Trends Neurosci. 32, 128–141 [DOI] [PubMed] [Google Scholar]
- 56. Hirrlinger P. G., Wurm A., Hirrlinger J., Bringmann A., Reichenbach A. (2008) J. Neurochem. 105, 1405–1417 [DOI] [PubMed] [Google Scholar]
- 57. Wurm A., Lipp S., Pannicke T., Linnertz R., Krügel U., Schulz A., Farber K., Zahn D., Grosse J., Wiedemann P., Chen J., Schöneberg T., Illes P., Reichenbach A., Bringmann A. (2009) J. Neurochem. 112, 1261–1272 [DOI] [PubMed] [Google Scholar]
- 58. Black C. A. (1999) Dermatol. Online J. 5, 7 [PubMed] [Google Scholar]
- 59. Mody C. H., Lipscomb M. F., Street N. E., Toews G. B. (1990) J. Immunol. 144, 1472–1477 [PubMed] [Google Scholar]
- 60. Koguchi Y., Kawakami K. (2002) Int. Rev. Immunol. 21, 423–438 [DOI] [PubMed] [Google Scholar]
- 61. Kleinschek M. A., Müller U., Schütze N., Sabat R., Straubinger R. K., Blumenschein W. M., McClanahan T., Kastelein R. A., Alber G. (2010) Int. Immunol. 22, 81–90 [DOI] [PubMed] [Google Scholar]
- 62. Stenzel W., Müller U., Köhler G., Heppner F. L., Blessing M., McKenzie A. N., Brombacher F., Alber G. (2009) Am. J. Pathol. 174, 486–496 [DOI] [PMC free article] [PubMed] [Google Scholar]
Associated Data
This section collects any data citations, data availability statements, or supplementary materials included in this article.