

Abstract
CD36 is a transmembrane protein present in many tissues that is believed to facilitate inward fatty acid transport. Western blotting is the most widely used method to measure tissue CD36 protein content, but it is time consuming, technically demanding, and semiquantitative. To more precisely measure adipose tissue CD36 content we developed an enzyme linked immunosorbent assay (ELISA) after establishing that: 1) the anti-CD36 antibodies gave a single distinct band on traditional Western blots, and 2) the vast majority of adipocyte CD36 resides in the plasma membrane. By using serial dilutions of each sample and including a calibrator sample and quality control sample on each plate, we could achieve inter- and intra-assay variability of ∼ 10%. We found that CD36 content in omental and abdominal subcutaneous adipose tissue varied over a 2–5-fold range depending upon the means of data expression (per units of tissue protein, weight, or lipid). Omental CD36 content in women decreased markedly (P = 0.01) as a function of fat cell size. For the most part, tissue CD36 content was not correlated with CD36 mRNA. This ELISA method for tissue CD36 content should enhance research into the role of this protein on tissue fatty acid uptake.
Keywords: enzyme-linked immunosorbent assay, Western blotting, visceral fat, subcutaneous fat, fatty acid translocase
CD36, also referred to as fatty acid translocase, is a transmembrane protein present in many tissues that is believed to play a role in facilitating inward fatty acid transport (1). Indeed, humans with mutations in the CD36 gene are reported to have metabolic abnormalities (2–5) and the absence of CD36 in the spontaneously hypertensive rats is associated with resistance to the beneficial effects of pioglitazone (6). The expression of adipocyte CD36 in patients may differ with total body fat, fat cell size, and fatty acid metabolism (7–9).
We have been interested in the ability of adipocytes in different depots to store both dietary fatty acids (10–12) and circulating FFAs (13–15). One of the potential rate-limiting steps for adipocyte fatty acid storage may be the amount of CD36 on the plasma membrane (1). We wished to develop an assay for adipose tissue CD36 that can be applied to large numbers of samples and allow robust comparison between assays. Because of the somewhat tedious nature of Western blotting to accomplish these objectives, we developed an ELISA that we believe will enhance research on this important protein.
MATERIALS AND METHODS
Subjects
The study was approved by the Mayo Clinic Institutional Review Board and written informed consent was obtained from all study participants. Patients were included if: a) their body mass index was ≤ 35 kg/m2; b) they were taking no medications that could affect lipid metabolism or adiposity; c) liver and kidney function studies were normal; and d) there were no systemic inflammatory illnesses. All volunteers were healthy adults undergoing elective surgery (male n = 10, female n = 10). Under general anesthesia, adipose tissue samples were taken from the abdominal subcutaneous and omental depots.
Sample analysis
Fat cell sizing was performed on each sample as previously described (16). The remaining tissue was stored at −70°C while awaiting further analysis. To extract the sample, ∼200 mg of tissue was homogenized in 4 µL/mg tissue standard homogenization buffer with anti-proteases (SHB-P: 20 mM Tris-HCl, 1 mM EDTA, 255 mM sucrose, pH 7.4, anti-protease tablets from Roche) on ice using a rotor-stator for three 10 s cycles of homogenization interspersed with 10 s cycles of rest. The homogenates were centrifuged at 1,000 g for 10 min and the subnatant (whole tissue extract) below the lipid cake was aspirated and denatured by boiling for 10 min with a final concentration of 0.06% SDS. Total protein concentrations of the whole tissue extracts were measured using Pierce BCA Protein Quantitation kit and the samples were stored at −70°C until assayed. The tissue lipids were extracted using 15 ml CHCl3:methanol (2:1) at 4°C for at least 2 days. Then 3.75 ml of 0.88% KCl was added and the lipid layer was isolated by centrifugation, filtered, dried, and weighed. The lipid weight of each sample (mg lipid/mg sample) was used to report the amount of CD36 relative to lipid and cell number.
Plasma membrane isolation
Adipocytes were isolated from tissue by collagenase digestion and processed as described by Gargiulo et al. (17). Briefly, the isolated adipocytes were homogenized, centrifuged, and the lipid removed. The remaining total homogenate was ultracentrifuged and the supernatant, containing cytosolic proteins, was stored at −70°C until assayed. The pellet, containing total membrane proteins, was resuspended and layered on top of a sucrose cushion and ultracentrifuged. The pellet from this centrifugation, containing mitochondrial and peroxisomal membrane proteins, was resuspended and stored at −70°C until assayed. The interface, containing plasma membrane proteins, was further ultracentrifuged and then resuspended and stored at −70°C until assayed.
Western blotting
All gels were run on an Invitrogen MidiGel system with NuPAGE bis/tris gels according to manufacturer's directions. Transfer was performed on an Invitrogen semi-dry apparatus at 20 V for 1 h to polyvinylidene fluoride (PVDF) membrane. Blocking was for 2 h at 37°C in TBS Tween (TBST: 10 mM Tris, 150 mM NaCl, 0.1% Tween-20, pH7.4) with 3% BSA. The appropriate primary antibody [R&D Systems (AF1955) or Santa Cruz (sc9154)] was incubated in a 1:500 dilution in blocking buffer for 15 h at 4°C followed by three 10 min washes in TBST. The secondary antibody (Jackson Immunolabs rabbit anti-goat-HRP or goat anti-rabbit-HRP) was incubated in a 1:5000 dilution in blocking buffer for 1 h at room temperature followed by three 10 min washes in TBST. Detection was performed using Pierce Super Signal and the blot exposed to film.
RT-PCR for CD36 mRNA quantitation
RNA was extracted using Qiagen's RNeasy lipid tissue mini kit. A cDNA library was made using Applied Biosystem's High Capacity cDNA Archive kit. Quantitative RT-PCR was performed on an ABI 7900 using primer and probe sets from Applied Biosystems. Calculations of relative transcript amounts were normalized to a “housekeeping”/endogenous control gene (cyclophilin A) and then reported relative to a calibrator sample (surgical fat).
ELISA
Assays were performed on NUNC Maxisorp 96-well flat-bottomed plates. To each well, 100 µL of the first primary antibody (R&D Systems, AF1955) diluted to 2.5 ng/µL in PBS (10 mM phosphate, 137 mM NaCl, 2.7 mM KCl, pH 7.4) was added and incubated 24 h at 4°C. Following incubation, the plate was washed two times with PBST (PBS with 0.1% Tween-20). Then 200 µL PBST with 3% fatty acid free BSA was added to each well and incubated for a minimum of 2 h at 4°C followed by three washes with PBST. The whole tissue extracts were denatured by adding SDS to a final concentration of 0.06% and boiling for 10 min at 100°C. Each whole tissue extract was diluted to contain 20 µg total protein/100 µL with 0.012% SDS. A 2-fold dilution series with a total of six samples was prepared from this stock while maintaining a 0.012% SDS concentration. One hundred microliters of each of these samples was loaded in the 96-well plate and incubated at room temperature for 3 h. After incubation, the plate was washed three times with PBST following which 100 µL of the second primary (Santa Cruz, sc9154) diluted to 0.39 ng/µL in PBST with 1% BSA was added to each well and incubated for 1 h at room temperature. After incubation, the plate was washed three times with PBST following which 100 µL of the secondary antibody (Jackson Immunolabs, goat anti-rabbit-HRP) diluted 1:2000 in PBST with 1% BSA was added to each well and incubated at room temperature for 1 h. Then the plate was washed four times with PBST and detection carried out with Pierce TMB Solution kit per manufacturer's instructions. Color developed at room temperature for 30 min and was stopped with 100 µL 2 M sulphuric acid. The absorbance was measured using an Omni Max plate reader at 450 nm.
ELISA calculations
The total protein content of each well was plotted as a log transformed value in order to linearize the relationship between protein content and absorbance (Fig. 1). By using multiple dilutions, we defined the linear range for each sample, allowing us to include at least three points clearly inside the assay's linear working range. The slope and intercept for each of the whole tissue extract sample, including the calibrator sample, was determined using linear regression analysis. To assure that each patient sample was within the working range of the assay, we decided to exclude any patient samples with slopes >15% different from the calibrator sample. Because no purified native human CD36 was available as an absolute standard, we used a calibrator sample obtained from a whole tissue adipose extract (from pooled surgical waste material) to compare results between plates. This calibrator sample was included on each plate, allowing us to quantify relative amounts of CD36 in each patient sample. This was achieved by using the slope of the calibrator sample and the intercept of each whole tissue extract at a set absorbance (AT) to calculate the amount of total protein that it would take for each sample to obtain that absorbance. By subtracting the sample absorbance value from the calibrator sample and performing an inverse log transformation, we calculated the amount of CD36 (relative to the calibrator)/mg whole tissue extract total protein (see Fig. 1) for each sample. By relating this to the amount of tissue extracted, we are able to express the relative CD36 content/mg tissue. Furthermore, because we recorded the lipid weight/mg tissue, we have the option of expressing CD36 content/mg lipid, and thus per 1,000 adipocytes by using average adipocyte size (µg lipid/cell).
Fig. 1.

Sample ELISA calculations. The intersection of the trend line of the calibrator sample with the Y-axis at AT is 0.8. The intersection for Patient A is 1.1, making the difference between the calibrator 0.3. The negative difference is raised to the power of ten, indicating that the amount of CD36/mg total protein is 0.5 times that of the calibrator. The intersection for Patient B is 0.3, making the difference between the calibrator −0.5. When the negative difference is raised to the power of ten, the amount of CD36/mg total protein is three times that of the calibrator. Therefore, Patient B has six times as much CD36/mg total protein as Patient A.
RESULTS
Selection of antibodies
To achieve a successful sandwich ELISA, two anti-human CD36 antibodies, each from different species, were needed. Figure 2 shows a Western blot of the antibody used as the first primary (left panel) and the secondary primary antibody (right panel) selected for the ELISA assay. Each of the antibodies gave a single strong band.
Fig. 2.

Test of primary antibody specificity. The left panel shows a Western blot of the antibody used as the first primary in our ELISA and the right panel shows a Western blot of the antibody used as the second primary in our ELISA. The molecular weights were determined using nonfluorescent markers. Lane 1: 4.0 µg whole tissue extracts; Lane 2: 0.2 µg whole tissue extracts; Lane 3: 0.02 µg whole tissue extracts.
Subcellular localization of CD36
To determine the subcellular localization of adipocyte CD36, we used the Santa Cruz sc-9154 antibody to perform Western blotting on isolated adipocytes, the cytosolic and membrane fractions of adipocytes, as well as the mitochondrial/peroxisomal and purified plasma membranes from isolated adipocytes from the same samples. Figure 3 shows a representative Western blot. To visualize the relative amounts of CD36 in different locations within adipocytes, we loaded 0.01% of the total volume of each cell fraction onto the gel. Examining the CD36 bands from the total homogenate (lane 1), cytosolic proteins (lane 2), total membrane proteins, which is a relatively complete recovery of membranes (lane 3), the purified mitochondrial/peroxisomal membrane proteins (lane 4), and purified plasma membrane proteins (lane 5) we consistently found that virtually all the CD36 present in membrane fractions was in the plasma membrane (lane 5 vs. lane 4). The approach to collect total membrane proteins allows a relatively complete recovery of membranes, whereas the fractionation of membranes into purified mitochondrial/peroxisomal and plasma membranes is not quantitative. Thus, the CD36 band from whole membrane fraction is slightly more intense than the plasma membrane fraction. Note that the vast majority (>80%) of total homogenate CD36 is present in membrane fractions, not in the cytosol fraction (lane 3 vs. lane 2).
Fig. 3.
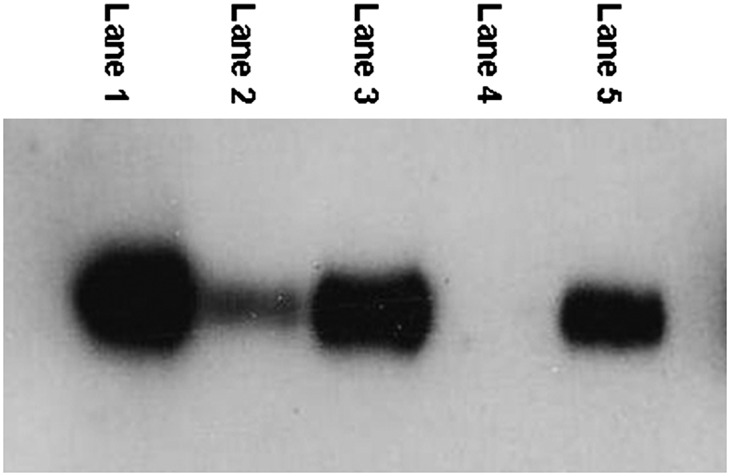
Subcellular localization of CD36 in human adipocytes. 0.01% of total volume of each fraction was loaded on the gel. Lane 1: Total homogenate. Lane 2: Cytosolic proteins. Lane 3: Total membrane proteins. Lane 4: Mitochondrial membrane proteins. Lane 5: Plasma membrane proteins.
Because there appears to be very little CD36 in the cytosolic fraction of adipocytes, and because the vast majority of membrane CD36 is in the plasma membrane, we processed the remaining patient samples as whole tissue extracts. This approach is faster and requires less tissue than plasma membrane preparation.
Comparison of Western blot and ELISA results
We analyzed adipose samples from six different patients using both ELISA and Western blot to test for agreement between the results. Figure 4 shows the scan of the Western with the ELISA results listed above. The intensity of the bands on the Western corresponds well with the ELISA values.
Fig. 4.
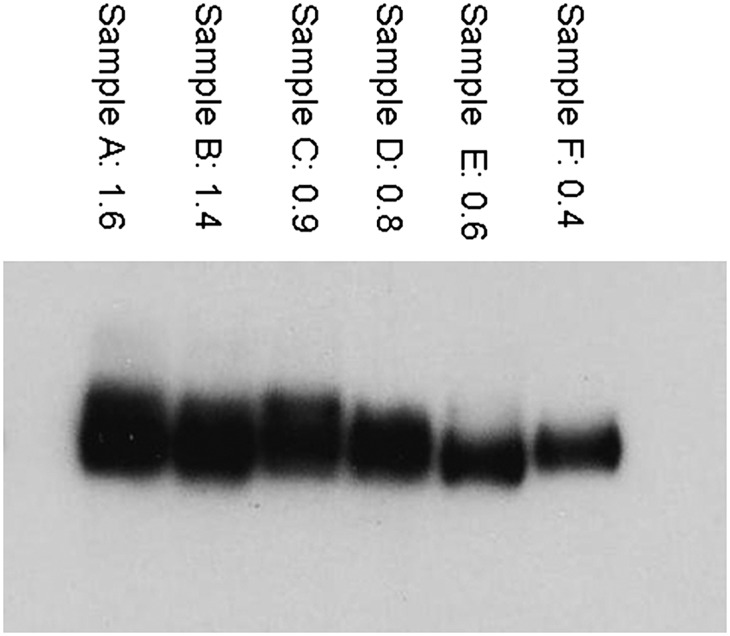
Comparison of Western blot and ELISA measurements of CD36s. The numbers above each lane are the ELISA results (relative amount of CD36/mg total protein), which appear to correspond well to the relative intensity of the corresponding bands on the Western blot.
Assay performance
We found the intra-assay variability of CD36 was 11%, as measured by running one sample 10 times on a single plate. Using the calibrator sample and the quality control (QC) on 49 plates over >6 months, we found a 10% inter-assay variability.
CD36 content of different adipose tissue depots
We obtained abdominal subcutaneous and omental adipose tissue from 20 healthy patients undergoing elective surgery. The subject characteristics are provided in Table 1.
TABLE 1.
Subject characteristics
| Men (n = 10) | Women (n = 10) | |
|---|---|---|
| Age (yr) | 41 ± 10 | 37 ± 4 |
| BMI (kg/m ) | 27 ± 4 | 26 ± 3 |
| Adipocyte size (µg lipid/cell) | ||
| Subcutaneous | 0.34 ± 0.14 | 0.49 ± 0.26 |
| Omental | 0.31 ± 0.17 | 0.29 ± 0.23 |
The values are given as mean ± SD. Age, body mass index (BMI), and adipocyte size for volunteers participating in the studies are provided.
Table 2 provides the mean and range of whole adipose tissue extract CD36 content for the males and females participating in this study. CD36 content per mg tissue and per mg lipid was greater (P = 0.04) in omental than subcutaneous adipose tissue in men, whereas the difference did not reach statistical significance in women (P = 0.07).
TABLE 2.
Range of observed CD36 values
| CD36/mg protein |
CD36/mg tissue |
CD36/mg lipid |
||
|---|---|---|---|---|
| mean (range) | mean (range) | mean (range) | ||
| F | omental | 0.8 (0.6–1.4) | 7.2 (2.8–11.1) | 11.6 (3.7–20.1) |
| M | omental | 0.8 (0.3–1.6) | 7.1a (4.0–12.2) | 13.0a (5.6–25.1) |
| F | abdominal subcutaneous | 1.2 (0.4–2.1) | 5.6 (2.5–9.8) | 8.7 (4.3–14.5) |
| M | abdominal subcutaneous | 0.7 (0.3–1.2) | 4.1 (2.3–9.1) | 7.1 (4.0–19.5) |
The mean and range of whole adipose tissue CD36 values from females (F) and males (M) are provided.
P = 0.04 versus abdominal subcutaneous same sex.
We examined the relationship between adipocyte size and CD36 content per mg protein, per mg tissue, and per mg lipid. For omental adipose tissue there was no relationship between fat cell size and CD36/mg protein for either men or women (Fig. 5A). In contrast, CD36 content/mg tissue and per mg lipid decreased significantly (P = 0.01) as a function of increasing cell size in women (Fig. 5B, C), whereas in men this relationship was not significant (P = 0.12). Irrespective of the means of data expression there was no relationship between tissue CD36 content and adipocyte size in abdominal subcutaneous fat (Fig. 6).
Fig. 5.

Relationship between mean adipocyte size and omental whole tissue extract CD36 content relative to the calibrator sample expressed as (A) per mg tissue protein, (B) per mg tissue, and (C) per mg tissue lipid. CD36 content/mg tissue and per mg lipid decreased significantly (P = 0.01) as a function of increasing cell size in women (B and C), whereas in men this relationship was not as strong (P = 0.12).
Fig. 6.

Relationship between mean adipocyte size and abdominal whole tissue extract CD36 content relative to the calibrator sample expressed as (A) per mg tissue protein, (B) per mg tissue, and (C) per mg tissue lipid. There were no statistically significant relationships between tissue CD36 content and adipocyte size in abdominal subcutaneous fat.
We also examined the relationship between the relative amount of CD36 mRNA and CD36 tissue content (per mg protein, tissue, and lipid) in omental (Fig. 7) and subcutaneous abdominal fat (Fig. 8). The only statistically significant relationship between CD36 mRNA and CD36 tissue content was for men in omental fat with CD36 expressed per mg protein (r = 0.93, P = 0.0002, Fig. 7A). This relationship remained significant after Bonferonni correction for multiple comparison testing.
Fig. 7.

Relationship between CD36 mRNA and omental whole tissue extract CD36 content relative to the calibrator sample expressed as (A) per mg tissue protein, (B) per mg tissue, and (C) per mg tissue lipid. There was a significant correlation (r = 0.93, P = 0.0002) between CD36 mRNA and CD36/mg protein for men.
Fig. 8.

Relationship between CD36 mRNA and abdominal subcutaneous whole tissue extract CD36 content relative to the calibrator sample expressed as (A) per mg tissue protein, (B) per mg tissue, and (C) per mg tissue lipid. None of the relationships were statistically significant.
DISCUSSION
The goal of these experiments was to develop a quick, reliable, and more quantitative method for measuring CD36 tissue content that would be applicable to large numbers of samples. Although Western blotting is commonly used to measure CD36 (8, 9, 18, 19), it is time consuming, only a limited number of samples can be run per gel, it is difficult to normalize between gels, and determining band size can be subjective. We found that this ELISA method requires less hands-on time, allows more samples to be run simultaneously, and allows for both a calibrator sample and a QC sample to ensure normalization between plates. The color change of the ELISA is objectively read on a plate reader.
Commercially available CD36 does not have the same molecular weight by Western blotting as native CD36 (data not shown), likely because native CD36 is glycosylated. Because of this, we did not have the option of using an “absolute” human CD36 standard to quantitate the protein. Instead, on each plate, we included a calibration sample that had been obtained from a large volume of surgical waste adipose tissue. The whole tissue extracts from this calibrator sample are stored in separate aliquots at −80°C in order to minimize protein degradation that might occur due to freeze/thaw cycles. By using this approach and by including a QC sample with each plate, it is possible to keep the between and within assay variability to a satisfactory level. When the supply of calibrator or QC runs low, we perform at least 10 assays that cross-over new and old calibrator or new and old QC samples in order to correct back to our original standards.
We initially attempted using the approach that Handberg et al. (20) described to measure CD36 in plasma. This procedure involves biotinylation of the detection antibody and incubation with peroxidase (POD)-avidin linked to a peroxidase detection system. We encountered very high background signal, however, most likely due to the presence of biotin in adipose tissue. This prompted us to change to the sandwich ELISA approach, which is somewhat similar to the assay using phage antibodies that Pelsers et al. (21) used to detect muscle CD36. The approach we describe here is optimized for adipose tissue and, by performing serial dilutions of each sample, we avoid the need to load exactly the same amount of protein per well or to perform corrections for variations in the amount of protein in the sample.
The subcellular localization of CD36 in heart and skeletal muscle is variable. There is an “active” CD36 present on the plasma membrane involved in the transmembrane transport of fatty acids and the “inactive” CD36 within intracellular vesicles that can be brought to the cell surface as needed (18). Our preliminary studies suggest that in adipocytes, <20% of CD36 is present in the cytosol fraction and, of the membrane associated CD36, >95% is in the plasma membrane fraction. Thus, information regarding functional (plasma membrane) adipose tissue CD36 content is readily determined by the amount of CD36 in whole tissue extracts.
We found that the ∼6-fold variation in the amount of CD36/mg protein in omental adipose tissue was unrelated to adipocyte size. In contrast, the between sample variability in omental CD36 relative to tissue weight or tissue lipid weight was inversely correlated with adipocyte size, suggesting that the amount of CD36 on the omental adipocyte surface does not increase as a linear function of surface area. Of equal interest is that the dramatic decline in omental CD36 content as a function of adipocyte size in women would tend to reduce fatty acid uptake as fat cell size/visceral fat mass increases. This is consistent with our observations regarding meal fatty acid (12) and direct plasma FFA storage (13) in omental adipose tissue in women.
For the most part, adipose tissue CD36 content was not well correlated with CD36 mRNA. This is perhaps not surprising given that glucose has been shown to regulate CD36 at the translational level (19). It also indicates that CD36 mRNA may be a poor predictor of CD36 tissue content.
The limitations of this method arise from the extraction of protein from whole adipose tissue. Some adipose tissue samples contain more blood or connective tissue, which will result in variable protein concentrations. This can be somewhat corrected for by reporting the CD36 per mg tissue or lipid. In addition, depending on the tissue sample (surgical vs. aspiration biopsy) there may be variable numbers of adipocytes relative to tissue weight. For this reason, and because some lipid can be lost during extraction before it can be weighed, it is preferable to use as much tissue as possible to extract, preferably at least 100 mg. This minimizes the percent error in the weights of the tissue and lipid. For most tissue samples, a multi-point curve that covers the complete range of values will be sigmoid shaped, the high and low ends being the saturation of the color reaction and below the limit of detection, respectively. Selecting the linear portion in the middle to be able to find a slope equal to the calibrator sample can sometimes require reanalyzing a sample with different dilutions. For a few samples, we could not achieve conditions to be able to determine tissue CD36 content (typically <1% of samples). Another limitation of this assay that it shares in common with Western blotting is that the CD36 content is relative to a calibrator sample, not an absolute amount (ng/gm tissue) such as would be possible if a purified native human CD36 standard were available.
In summary, we describe a sandwich ELISA assay for adipose tissue CD36 that is relatively quick, quantitative, and reproducible. This approach should allow investigators to better understand the variations in adipose CD36 content and how this relates to fatty acid uptake.
Footnotes
Supported by grants DK45343, DK40484, and DK50456 from the US Public Health Service, 7-07-DCS-03 from the American Diabetes Association, and by the Mayo Foundation.
REFERENCES
- 1.Ibrahimi A., Abumrad N. A. 2000. Role of CD36 in membrane transport of long-chain fatty acids. Curr. Opin. Clin. Nutr. Metab. Care. 5: 139–145. [DOI] [PubMed] [Google Scholar]
- 2.Kajihara S., Hisatomi A., Ogawa Y., Yasutake T., Yoshimura T., Hara T., Mizuta T., Ozaki I., Iwamoto N., Yamamoto K. 2001. Association of the Pro90Ser CD36 mutation with elevated free fatty acid concentrations but not with insulin resistance syndrome in Japanese. Clin. Chim. Acta. 314: 125–130. [DOI] [PubMed] [Google Scholar]
- 3.Pravenec M., Kurtz T. W. 2002. Genetics of Cd36 and the hypertension metabolic syndrome. Semin. Nephrol. 22: 148–153. [DOI] [PubMed] [Google Scholar]
- 4.Miyaoka K., Kuwasako T., Hirano K., Nozaki S., Yamashita S., Matsuzawa Y. 2001. CD36 deficiency associated with insulin resistance. Lancet. 357: 686–687. [DOI] [PubMed] [Google Scholar]
- 5.Ma X., Bacci S., Mlynarski W., Gottardo L., Loccio T., Menzaghi C., Iori E., Lager R. A., Shroff A. R., Gervino E. V., et al. 2004. A common haplotype at the CD36 locus is associated with high free fatty acid levels and increased cardiovascular risk in Caucasians. Hum. Mol. Genet. 13: 2197–2205. [DOI] [PubMed] [Google Scholar]
- 6.Qi N., Kazdova L., Zidek V., Landa V., Kren V., Pershadsingh H. A., St.Lezin E., Abumrad N. A., Pravence M., Kurtz T. W. 2002. Pharmacogenetic evidence that Cd36 is a key determinant of the metabolic effects of pioglitazone. J. Biol. Chem. 277: 48501–48507. [DOI] [PubMed] [Google Scholar]
- 7.Gertow K., Pietiläinen K. H., Yki-Jarvinen H., Kaprio J., Rissanen A., Eriksson P., Hamsten A., Fisher R. M. 2004. Expression of fatty-acid-handling proteins in human adipose tissue in relation to obesity and insulin resistance. Diabetologia. 47: 1118–1125. [DOI] [PubMed] [Google Scholar]
- 8.Fisher R. M., Hoffstedt J., Hotamisligil G. S., Thörne A., Rydén M. 2002. Effects of obesity and weight loss on the expression of proteins involved in fatty acid metabolism in human adipose tissue. Int. J. Obes. 26: 1379–1385. [DOI] [PubMed] [Google Scholar]
- 9.Bonen A., Tandon N. N., Glatz J. F. C., Luiken J. J. F. P., Heigenhauser G. J. F. 2006. The fatty acid transporter FAT/CD36 is upregulated in subcutaneous and visceral adipose tissues in human obesity and type 2 diabetes. Int. J. Obes. 30: 877–883. [DOI] [PubMed] [Google Scholar]
- 10.Romanski S. A., Nelson R., Jensen M. D. 2000. Meal fatty acid uptake in adipose tissue: gender effects in non-obese humans. Am. J. Physiol. 279: E455–E462. [DOI] [PubMed] [Google Scholar]
- 11.Jensen M. D., Sarr M. G., Dumesic D. A., Southorn P. A., Levine J. A. 2003. Regional uptake of meal fatty acids in humans. Am. J. Physiol. 285: E1282–E1288. [DOI] [PubMed] [Google Scholar]
- 12.Votruba S. B., Mattison R. S., Dumesic D. A., Koutsari C., Jensen M. D. 2007. Meal fatty acid uptake in visceral fat in women. Diabetes. 56: 2589–2597. [DOI] [PubMed] [Google Scholar]
- 13.Koutsari C., Dumesic D. A., Patterson B. W., Votruba S. B., Jensen M. D. 2008. Plasma free fatty acid storage in subcutaneous and visceral adipose tissue in postabsorptive women. Diabetes. 57: 1186–1194. [DOI] [PubMed] [Google Scholar]
- 14.Koutsari C., Snozek C. L., Jensen M. D. 2008. Plasma NEFA storage in adipose tissue in the postprandial state: sex-related and regional differences. Diabetologia. 51: 2041–2048. [DOI] [PMC free article] [PubMed] [Google Scholar]
- 15.Shadid S., Koutsari C., Jensen M. D. 2007. Direct free fatty acid uptake into human adipocytes in vivo: relation to body fat distribution. Diabetes. 56: 1369–1375. [DOI] [PubMed] [Google Scholar]
- 16.Tchoukalova Y. D., Harteneck D. A., Karwoski R. A., Tarara J., Jensen M. D. 2003. A quick, reliable, and automated method for fat cell sizing. J. Lipid Res. 44: 1795–1801. [DOI] [PubMed] [Google Scholar]
- 17.Gargiulo C. E., Stuhlsatz-Krouper S. M., Schaffer J. E. 1999. Localization of adipocyte long-chain fatty acyl-CoA synthetase at the plasma membrane. J. Lipid Res. 40: 881–892. [PubMed] [Google Scholar]
- 18.Bonen A., Luiken J. J. F. P., Arumugam Y., Glatz J. F. C., Tandon N. N. 2000. Acute regulation of fatty acid uptake involves the cellular redistribution of fatty acid translocase. J. Biol. Chem. 275: 14501–14508. [DOI] [PubMed] [Google Scholar]
- 19.Griffin E., Re A., Hamel N., Fu C., Bush H., McCaffrey T., Asch A. S. 2001. A link between diabetes and atherosclerosis: glucose regulates expression of CD36 at the level of translation. Nat. Med. 7: 840–845. [DOI] [PubMed] [Google Scholar]
- 20.Handberg A., Levin K., Hojlund K., Beck-Nielsen H. 2006. Identification of the oxidized low-density lipoprotein scavenger receptor CD36 in plasma: a novel marker of insulin resistance. Circulation. 114: 1169–1176. [DOI] [PubMed] [Google Scholar]
- 21.Pelsers M. M., Lutgerink J. T., Nieuwenhoven F. A., Tandon N. N., van der Vusse G. J., Arends J. W., Hoogenboom H. R., Glatz J. F. 1999. A sensitive immunoassay for rat fatty acid translocase (CD36) using phage antibodies selected on cell transfectants: abundant presence of fatty acid translocase/CD36 in cardiac and red skeletal muscle and up-regulation in diabetes. Biochem. J. 337: 407–414. [PMC free article] [PubMed] [Google Scholar]