

SUMMARY
Tolerogenic dendritic cells (DC) and suppressive Foxp3+ Treg play important roles in preventing autoimmunity and allograft rejection. We report that (adenovirus-mediated) ectopic expression of Foxp3 in human DC (i.e. DC.Foxp3) yields an antigen presenting cell (APC) that severe limits T cell proliferation and Type 1 immune responses from the naïve, but not memory, pool of responder T cells in vitro. In marked contrast, the frequencies of Type-2 and regulatory T cell responses were dramatically increased after stimulation of naïve T cells with DC.Foxp3 vs. control DC. DC.Foxp3-induced CD4+CD25+ Treg (XiTreg) cells potently suppressed the proliferation of, and IFN-γ production from, CD4+ and CD8+ responder T cells. Notably, the immunosuppressive biology of DC.Foxp3 was effectively normalized by addition of 1-MT or neutralizing anti-TGF-β1 Ab during the period of T cell priming. These data suggest the potential utility of regulatory DC.Foxp3 and/or DC.Foxp3-induced XiTreg as translational agents for the amelioration or prevention of pathology in the setting of allograft transplantation and/or autoimmunity.
Keywords: Foxp3, DC, Treg, SEB, Allogeneic
INTRODUCTION
The development of effective therapies that are Ag-specific and capable of ameliorating immune pathology in the setting of autoimmunity and allograft rejection remains of intense interest [1,2]. As professional APC, DC of various lineages and stages of maturation determine the fate and functionality of Ag-specific T cell responses [3-5]. In this regard, regulatory DC are potent immune suppressors, capable of limiting T effector cell expansion and/or promoting the development of T regulatory (Treg) cells [6-8].
Forkhead box (FOX) proteins are a family of transcription factors that play pleiotropic roles in regulating cell growth, differentiation, and immune responses [9,10]. Expression of the transactivator protein Foxp3 in Treg is important for their differentiation, maintenance and suppressor functions [11-13]. The impact of Foxp3 on immune regulation has recently been extended to cancer cells, where Foxp3+ carcinoma cells were shown to be more competent to suppress immunity [14]. No reports have yet investigated Foxp3 expression in myeloid cell lineages, although another member of the FOX family, Foxo3, has been identified as an intrinsic regulator of DC that effectively constrains proinflammatory T cell proliferation and effector functions [15,16]. Using a recombinant adenovirus, we overexpressed human Foxp3 in human monocyte-derived DC and observed that DC.Foxp3 cells were regulatory APC as they differentially expanded CD4+Foxp3+ Treg and Type-2 T cells, while inhibiting Type-1 (CD4+ Th1 and CD8+ Tc1), and to a lesser extent, Th17 T cell responses in vitro.
RESULTS
Generation of DC.Foxp3
Day 7 cultured human monocyte-derived DC were left untreated or transduced with control adenovirus (Ad.ψ5) or a recombinant adenoviral vector encoding full-length human Foxp3 (Ad.hFox) for 48h and the resulting cells analyzed for intracellular expression of Foxp3 protein by flow cytometry (Fig. 1A) and confocal fluorescence microscopy (Fig. 1B). Overall, strong nuclear staining was observed for Foxp3 in DC.Foxp3, but not control DC populations, with an average of 54 % +/− 8 % of CD11c+ DC co-expressing Foxp3 protein in the DC.Foxp3 cohort (n = 26 independent experiments; data not shown). DC.Foxp3 expressed intracellular Foxp3 protein for at least 5 days post-infection (Supplemental Fig. 1).
Figure 1. Foxp3 transgene expression in DC.

Immature DC were left untransduced (DC.null) or infected with an empty adenoviral vector (DC.ψ5) or an adenoviral vector encoding human Foxp3 (DC.Foxp3) at an MOI of 300 for 48h, then evaluated by flow cytometry (for expression of CD11c and Foxp3; panel A) or immunofluorescence microscopy (panel B; nuclear staining using DAPI (blue), phalloidin (green) and Foxp3 (red). *p < 0.05 vs DC.ψ5 or uninfected DC (DC.null). For each panel, similar data were obtained in 4 independent experiments. Transduction efficiency for DC.Foxp3: 37% and 34% in panels A and B, respectively.
Impairment of early T cell responses
To address the impact of Foxp3 expression in DC on the ability of these APC to drive Ag-specific responses from “naïve” CD45ROneg vs. “memory” CD45RAneg T cells in vitro, we initially established 2 experimental systems; i.) a model in which the SEB superantigen was presented to autologous T cells and ii.) a model in which allogeneic T cells were used as responder cells. DC.Foxp3 and control DC were generated as outlined in Fig. 1, then left untreated or pulsed with SEB (in the autologous model), before being co-cultured with the autologous or allogeneic T cells for up to 14 days. As depicted in Fig. 2A, the yield of CD4+ and CD8+ responder T cells from CD45ROneg precursors was substantially lower when DC.Foxp3 vs. control DC were used as stimulator cells (p < 0.05 vs. DC.null or DC.ψ5) in both model systems. In contrast, analysis of analogous cultures established using CD45RAneg T cell responders indicated no significant differences in yields of responder T cells developed using DC.Foxp3 vs. DC.ψ5 as stimulators (Supplemental Fig. 2A), Among the CD45ROneg, bulk (CD4+ and CD8+) T cell responders, this difference in absolute cell yield appeared to reflect the suppressive influence of DC.Foxp3 cells on T cell proliferation at each division cycle (Fig. 2B). In addition, we observed an elevation in the frequency of CD4+ T cells (and to a lesser extent CD8+ T cells, data not shown) undergoing apoptosis after stimulation with SEB-pulsed DC.Foxp3 vs. control DC (Fig. 2C).
Figure 2. DC.Foxp3 impairs early CD45ROneg T cell responses, in part, via AICD.

(A) DC.Foxp3 or control DC were pulsed with SEB and used as stimulator cells for CD45ROneg (CD4+ or CD8+) T cells. After 14 days, T cell yields (mean +/− SD) were determined microscopically using a hemocytometer. (B) Autologous or allogeneic, bulk CD45ROneg T cells were pre-stained with 0.5 μM of CFSE prior to co-culture with SEB-pulsed DC.Foxp3 or control DC. Proliferation (on day 3 of culture for autologous groups) is depicted as CFSE dilution monitored by flow cytometry. (C) CD4+ T cells isolated from day 6 cocultures of DC with CD45ROneg T responder cells were analyzed for necrotic (PI+) vs. apoptotic (Annexin-V+) events by flow cytometry. For each panel, similar data were obtained in 3 independent experiments. Transduction efficiency for DC.Foxp3: 53%, 62% and 56% in panels A-C, respectively.
DC.Foxp3 cells skew naïve T cell responses toward Th2 and Treg functionality in vitro
To investigate the impact of DC.Foxp3 stimulation on the functional polarization of T cell responses, CD45ROneg vs. CD45RAneg CD4+ T cells stimulated with control DC or DC.Foxp3 cells were analyzed for differential expression of T cell transactivator gene products (Tbet (Type-1), GATA-3 (Type-2), RORγt (Th17) and FoxP3 (Treg)) vs. β-actin by RT-PCR. As shown in Fig. 3, CD4+ T cells isolated from DC.Foxp3 co-cultures established with CD45ROneg precursor T cells displayed a profile dominated by GATA-3 and Foxp3 transcripts, when compared to T cells primed with control DC. In contrast, levels of T-bet mRNA were reduced in cultures of CD45ROneg T cells primed with DC.Foxp3 vs. control DC. We were unable to detect significant differences in the transactivator transcript profile of CD4+ T cells harvested from cultures established using CD45RAneg T cells based on the type of DC used to stimulate cultures (Fig. 3).
Figure 3. DC.Foxp3 stimulation of naive T cells results in skewed Th2/Treg-type functional polarization in vitro.

CD45ROneg (naïve) or CD45RAneg (memory) T cells were stimulated with DC.Foxp3 vs. control DC as described in Materials and Methods. CD4+ T cells were MACS isolated on day 3 of cultures and analyzed for levels of T-bet, GATA-3, ROR-γt and Foxp3 mRNA using RT-PCR. Data are reported as the normalized ratio of the T-bet, GATA-3, ROR-γt and Foxp3 transcipt levels to β-actin transcript level, respectively. Similar data were obtained in 3 independent experiments. Transduction efficiency for DC.Foxp3: 44%.
The functional polarization of CD45ROneg T cells by DC.Foxp3 was confirmed by flow cytometry-based analyses of intracellular or secreted T cell cytokine production. Responder CD4+ and/or CD8+ T cells displayed increased frequencies of Type-2 cytokine (i.e. IL-4 or IL-5) producers and reduced frequencies of Type-1 (i.e. IFN-γ or IL-2) producers (Fig. 4A and Supplemental Fig. 3). Analyses of IL-17A, IL-17F and IL-21 (indices for Th17 functionality) in responder CD4+ and/or CD8+ T cells suggested minimal changes or slight reductions in production when compared to T cells primed using DC.Foxp3 vs. control DC (Fig. 4B, Supplemental Fig. 3A/3B and Supplemental Fig. 4). We also observed that responder CD8+ T cells developed from cocultures of DC.Foxp3 (vs. control DC) stimulator cells and CD45ROneg T responder cells expressed reduced intracellular levels of IFN-γ (Fig. 4A) and granzyme B (Fig. 4C), hallmarks of Tc1 effector cells [17].
Figure 4. DC.Foxp3 stimulation of naive T cells results in the skewed expression of polarized T cell effector molecules in vitro.

CD45ROneg (naïve) or CD45RAneg (memory) T cells were stimulated with DC.Foxp3 as described in Materials and Methods. Responder T cells from DC-T cell cultures were re-stimulated (using the identical form of DC used in the primary stimulation) on day 5. On day 14, CD4+ and CD8+ T cells were analyzed for intracellular IL-4 and IFN-γ (A) or IL-17A (B) by flow cytometry. In panel C, CD8+ T cells harvested from day 14 cultures were analyzed for expression of intracellular granzyme B by flow cytometry. For each panel, similar data were obtained in 3 independent experiments. Transduction efficiency in DC.Foxp3: 67%, 43% and 67% in panels A-C, respectively.
Given the pronounced enrichment of Foxp3 mRNA in CD45ROneg T cells activated by DC.Foxp3 (vs. control DC) stimulation (Fig. 3) and IL-10 produced by these T cell populations (Supplemental Fig. 3A, 3C), we analyzed CD4+ T responder cells for the enhanced presence of Treg cells. We initially assessed responder CD4+ T cells for co-expression of intracellular Foxp3 protein and cell-surface CD25 (i.e. the CD4+CD25hi+ phenotype is associated with Treg function, refs. 8, 10-12). As shown in Fig. 5A, DC.Foxp3 (vs. control DC)-activated CD4+ T cell populations were differentially enriched in Foxp3+CD25+ T cells if CD45ROneg, but not CD45RAneg, CD4+ T cell precursors were used to establish DC-T cell cocultures. DC.Foxp3-induced CD4+Foxp3+ T cells also coexpressed elevated levels of alternate Treg-associated markers, including GITR, CTLA-4 and neuropilin-1 (NRP-1; Fig. 5B). Notably, CD8+ T cells developed from the coculture of CD45ROneg T cells and DC.Foxp3 were deficient IFN-γ production (Fig. 4A), however, these cells did not develop a CD25+GITR+CTLA-4+CD28negFoxp3+ T suppressor cell phenotype (Supplemental Fig. 5).
Figure 5. DC.Foxp3 induce CD4+CD25+Foxp3+ Treg (XiTreg) cells in vitro.

(A) DC.Foxp3- or control DC-induced autologous or allogeneic naïve (CD45ROneg) or memory (CD45RAneg) CD4+ T cells were analyzed for Foxp3 and CD25 co-expression by flow cytometry on day 21 of culture. (B) Day 21 expanded CD4+ T cells, gated on the CD25+ sub-population of CD4+ T cells, were analyzed for expression of the markers Foxp3, GITR, CTLA-4 and neuropilin-1 (NRP-1) by flow cytometry. CD4+CD25+ T cells were MACS-isolated from day 21 DC-T cell cultures and added to naïve autologous or allogeneic CD8+ T cells in the presence of anti-CD3/CD28 Dynabeads™ (Invitrogen) and rhIL-2 (for CFSE proliferation assays-only). Four days after the initiation of these cultures, we assessed DC-T cell cluster size (based on visual inspection using light microscopy; panel C) and T cell proliferation (based on CFSE dilution; panel D). On day 8 of culture, T cells were analyzed for intracellular IFN-γ by flow cytometry (E). For each panel, similar data were obtained in 3 independent experiments. Transduction efficiency for DC.Foxp3: 67% in panel A, 46% in panel B, 63% in panels C-E.
In contrast to our results obtained from CD45ROneg precursor T cells, the stimulation of CD45RAneg T cells with DC.Foxp3 (vs. control DC) yielded CD4+ and CD8+ responder T cell populations exhibiting comparable levels of expansion and similar functional polarization profiles based on cytokine/granzyme production (Supplemental Fig. 2, Supplemental Fig. 6).
DC.Foxp3-induced Treg (XiTreg) are functionally suppressive in vitro
To assess whether DC.Foxp3-induced Treg (XiTreg) cells were suppressive, we MACS-isolated CD4+CD25+ T cells from day 21 cultures (at a time when Foxp3 expression is selectively retained in Treg but not activated, non-Treg T cells [18, 19]) established using CD45ROneg T cells as responders and DC.Foxp3 vs. control DC as stimulator cells. These XiTreg were then cocultured with autologous or allogeneic (CFSE-labeled) CD8+CD45ROneg T cells in the presence of anti-CD3/anti-CD28-coated microbeads. As shown in Fig. 5C, CD8+ T cell cocultured with DC.Foxp3-induced XiTreg contained far smaller APC-T cell clusters than cocultures established with control DC-induced XiTreg. CSFE-based dilutional analysis supported the differentially poor proliferation of responder CD8+ T cells under the influence of DC.Foxp3-induced XiTreg (Fig. 5D) and the inability of these CD8+ T cells to produce normal levels of IFN-γ (Fig. 5E). To assess XiTreg suppression of CD4+ T cell responses, CD4+CD25negCD45ROneg responder T cells (labeled with CFSE) were cocultured with CD4+CD25+ XiTreg (labeled with Cell Vue Claret) to allow for discrimination of these CD4+ T cell populations by flow cytometry (Fig. 6A). We observed that DC.Foxp3-induced XiTreg were potent suppressors of autologous and allogeneic responder CD4+ T cell proliferation (Fig. 6B). In this regard DC.Foxp3-induced XiTreg were comparable to freshly-isolated, CD4+CD25+ nTreg in their suppressive capacity (Supplemental Fig. 7) and superior to XiTreg developed from CD4+CD45ROneg responder T cells using control DC as stimulator cells (Fig. 6B). DC.Foxp3 (but not control DC)-induced XiTreg also efficiently inhibited the production of IL-2 and IFN-γ from anti-CD3 + anti-CD28-activated, naïve CD4+CD25neg T cells (Fig. 6C). In stark contrast, DC.Foxp3 (and control DC)-induced XiTreg developed from CD45RAneg T cell precursors were poorly suppressive in vitro (Supplemental Fig. 8).
Figure 6. DC.Foxp3 (but not control DC)-induced XiTreg suppress the proliferation of, and Type-1 cytokine (IFN-γ and IL-2) production by, CD4+ T cells in vitro.

A, XiTreg were generated in 21 day cultures as described in the legend of Fig. 5 and labeled with Cell Vue Claret stain per the manufacturer’s protocol. Cell Vue Claret stained-XiTreg and CFSE-labeled CD4+CD45ROnegCD25neg T cells were then added to wells at a 10:1 responder-to-XiTreg ratio (A), along with anti-CD3/CD28 microbeads. After 72h of coculture, the Cell Vue-excluded population of CD4+ T cells was analyzed for proliferation (i.e. CFSE dilution; panel B) and for intracellular levels of IL-2 and IFN-γ (panel C) by flow cytometry. For each panel, similar data were obtained in 3 independent experiments. Transduction efficiency for DC.Foxp3 used to generate XiTreg: 51% .
DC.Foxp3: Mechanism of action?
Given the observed gain of regulatory capacity by DC after transduction with Foxp3 cDNA, we sought to discriminate molecular alterations associated with the ability of these cells to predominantly promote Treg and Type-2 responses from naïve, CD45ROneg T cells in vitro. We were unable to detect significant changes in DC.Foxp3 (vs. control DC) expression of costimulatory/coinhibitory molecules (including CD80, CD83, CD86, B7-H1) or MHC Class I and II molecules (Supplemental Fig. 9), however, cytokine transcript profiles were altered, with discernibly impaired transcript expression for IL-12p35, IL-12p40, IL-27p28 and TNF-α (Fig. 7A). We noted little impact of Foxp3 transgene expression on DC mRNA transcript levels for IL-1β, IL-6, EBI-3 and TGF-β transcript, while the level of IL-10 transcripts may be slightly augmented (Fig. 7A). A corollary analysis of cytokine secretion revealed that DC.Foxp3 were profoundly deficient (vs. control DC) in their ability to produce any of the cytokines evaluated (i.e. IL-1β, IL-6, IL-10, IL-12p70, IL-23, TGF-β or TNF-α) upon activation via CD40 ligation or TLR ligands (Fig.7B and data not shown). Lack of cytokine production was not due to the premature demise of DC.Foxp3 (vs. control DC) based on an assessment of Annexin-V staining using flow cytometry (Fig. 7C).
Figure 7. Foxp3 associated changes in DC.

DC.Foxp3 and control DC were analyzed for expression of the indicated gene products by RT-PCR (A). In B, DC.Foxp3 or control DC were stimulated with CD40L-J558 fibroblasts at a DC:fibroblast ratio of 2:1 for 24h. Cell-free supernatants were then analyzed for the indicated cytokines by ELISA. Results represent the mean +/− SD of triplicate assay determinations. * p < 0.05 vs. DC. ψ5 or uninfected DC (DC.null). In C, the indicated DC populations were stained with FITC-Annexin-V and analyzed by flow cytometry. For each panel, similar data were obtained in 3 independent experiments. Transduction efficiency for DC.Foxp3: 36%, 46% and 42% in panels A-C, respectively.
Given the presence of a broad range of known inhibitory molecules [7, 10-12, 20, 21] on DC.Foxp3 (i.e. IL-10, TGF-β, CD95 (Fas), B7-H1 (PDL1), GITR, and IDO; Fig. 7A, Supplemental Fig. 9 and data not shown), we next evaluated the impact of adding blocking/neutralizing antibodies or inhibitors (i.e. 1-MT in the case of IDO) to DC.Foxp3 + CD4+CD45ROneg T cell co-cultures. As shown in Fig. 8, we observed that anti-TGF-β1 pAb or 1-MT were unique in their capacities to normalize responder T cell yields (Fig. 8A), T cell apoptotic frequencies (Fig. 8B), T cell production of IFN-γ production (Fig. 8C) and XiTreg frequencies (Fig. 8D) in cocultures initiated using CD4+CD45ROneg T cells and DC.Foxp3 (vs. control DC) as APC.
Figure 8. DC.Foxp3 negatively impact T cell proliferation, survival and Type-1/Treg polarization via a mechanism that involves IDO and TGF-β.

Allogeneic CD45ROneg CD4+ T cells were cultured with DC.Foxp3 or control DC in the presence of blocking/neutralizing antibodies against TGF-β, IL-10, CD95 (Fas), B7-H1 (PDL1) or GITR, or the IDO antagonist 1-methyl-tryptophan (1-MT). On day 7 of cultures, total CD4+ T cells were enumerated (A) and assessed for expression of Annexin-V using flow cytometry (B)..*p < 0.05 vs. IgG control. For panels C and D, allogeneic CD45ROneg T cells were co-cultured with DC.Foxp3 cells at a 10:1 ratio in the absence or presence of neutralizing anti-TGF-β Ab (0.3-10 μg/ml) or 1-MT 125-1000 nM). Responder T cells were then restimulated on day 5 with control allogeneic DC, with maintenance of anti-TGF-β1 Ab or 1-MT in cultures. On day 14, T cells were analyzed for intracellular levels of IFN-γ (panel C). Alternatively, day 21 T cells were analyzed for CD25 expression by flow cytometry (panel D). For each panel, similar data were obtained in 3 independent experiments. Transduction efficiency for DC.Foxp3: 39% in panels A and B, 46% in panels C and D.
CD45ROneg T cells primed in vitro with allogeneic or antigen-loaded DC.Foxp3 expand poorly and are deficient in Type-1 function
We applied 2 models in which to evaluate the impact of DC.Foxp3-based priming on antigen-specific responses in vitro, In the first protocol, DC.Foxp3 or control DC (generated from normal donor #1) were cultured with bulk naïve T cells (CD45ROneg; generated from normal donor #2) for 7 days in a MLR. The resulting T cells were then isolated and MACS-sorted into CD4+ or CD8+ T cell subsets, prior to their restimulation with control DC generated from donor #1, or a third-party, normal donor #3 (unrelated to either donors #1 or #2). After 7 days of in vitro restimulation, we observed that the total yield of responder CD4+ or CD8+ T cells was approximately 5 fold less if the cultures were primed using DC.Foxp3 vs. control DC (Fig. 9A). Furthermore, when analyzed in a second-set stimulation, DC.Foxp3-primed CD4+ and CD8+ (i.e. CD4neg; Fig. 9B) T cells were profoundly suppressed in their ability to produce IFN-γin response to either donor #1 (i.e. recall response) or third-party (unrelated donor #3) allo-Ag (Fig. 9C).
Figure 9. Alloreactive CD4+ and CD8+ T cells primed by DC.Foxp3 expand poorly and fail to exhibit Type-1 responses against recall or third-party alloantigens.

DC.Foxp3 or control DC were generated from normal donor #1 and cultured with total CD45ROneg T cells isolated from unrelated, normal donor #2 at a DC:T cell ratio of 1:10. In panel A, day 7 cultures were analyzed for T cell yields. Purified CD4+ or CD8+ T cells harvested from these cultures (panel B) were (re)stimulated with DC.null generated either from normal donor #1 or a third-party, normal donor #3 in the presence of rhIL-2 and rhIL-7. After 7 additional days of culture, CD4+ and CD8+ (i.e. depicted as CD4neg) T cells were analyzed for intracellular levels of IFN-γ by flow cytometry (panel C). For each panel, similar data were obtained in 3 independent experiments. Transduction efficiency for DC.Foxp3: 53% in panels A-C.
In a second protocol, we developed DC.Foxp3 and control DC from HLA-DR4+ normal donors, and pulsed these APC with the influenza FluM160-73 Th peptide epitope [22], before using them to stimulate autologous CD4+CD45ROneg T cells. As shown in Fig. 10A, DC.Foxp3 (vs. control DC)-primed CD4+ T cell responders displayed Type-2 (over Type-1)-dominated cytokine production when restimulated with FluM160-73 peptide-pulsed T2.DR4 cells in cytokine-specific ELISPOT assays. Using a specific HLA-DR4/FluM160-73 tetramer, we also observed that DC.Foxp3 (vs. control DC)-activated cultures contained a minimally expanded population of tetramer+ cells (when compared with unstimulated T cells; Fig. 10B). This modest cohort of tetramer+ cells appeared to be enriched in T cells bearing the Treg phenotype (i.e. CD4+CD25+Foxp3+; Fig. 10C), whereas non-antigen specific (tetramerneg) T cells did not express elevated levels of CD25+ and\or Foxp3+ events when compared to control DC cultured with CD45ROneg T cells (i.e. no bystander induction of Treg; data not shown).
Figure 10. DC.Foxp3 pulsed with an influenza virus Th epitope preferentially induce non-Type-1 specific CD4+ T cell responses in vitro.
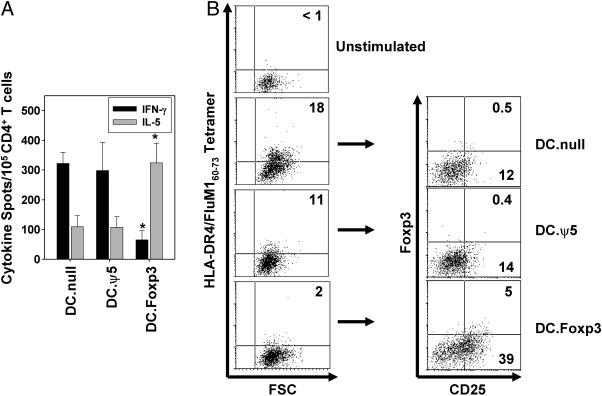
CD4+CD45ROneg T cells, DC.Foxp3 and control DC were generated as described in the Materials and Methods from the PBMC of normal, healthy HLA-DR4+ donors. DC were pulsed with 10 μM of influenza matrix (FluM1)60-73 Th epitope and used to stimulate autologous CD4+ T cells. After 7 days of culture, responder CD4+ T cells were evaluated for response against the FluM160-73 peptide in IL-5 and IFN-γ ELISPOT assays, using T2.DR4 cells as APC (A). Data are reported as the mean ± SD of triplicate determinations. *p < 0.05 vs. either DC control cohort. In B (left column), unstimulated vs. responder T cells were assessed for the frequency of antigen-specific CD4+ T cells using a PE-conjugated HLA-DR4/FluM160-73 tetramer by flow cytometry. In panel C, tetramer+ events were then isolated via fluorescent-activated cell sorter, immediately stained using mAbs against CD25 and (intracellular) Foxp3, and re-analyzed by flow cytometry. For each panel, similar data were obtained in 3 independent experiments. In panels A and B, transduction efficiency for DC.Foxp3 used in primary stimulations was 57% and for secondary stimulations, 41%.
DISCUSSION
Given the clinical relevance of selectively suppressing immunity in the settings of autoimmunity and transplant rejection, major interest has been focused on the development of tolerogenic DC that directly or indirectly (via the activation of Treg) limit T cell-mediated pathology against target tissues [6-8, 20]. Interestingly, one member of the FOX family of transcription factors, Foxo3, has been recently shown to serve as an important intrinsic regulator of DC function that limits DC-induced inflammatory T cell responsiveness [16]. Based on these results, and despite the fact that Foxp3 does not appear to be intrinsic to human monocyte-derived DC (nor could we induce its expression by in vitro treatment with rhIL-10 or rhTGF-β; Supplemental Fig. 10), we hypothesized that ectopic expression of Foxp3 (via adenoviral-mediated gene delivery) in DC might yield a regulatory APC.
Using both SEB-based (designed to recapitulate a polyclonal self-restricted response to Ag) and allogeneic in vitro models, we observed that human DC.Foxp3 cells were potent regulators of CD45ROneg (naïve), but not CD45RAneg (memory), T cell responses. In response to DC.Foxp3 stimulation, CD4+CD45ROneg and CD8+CD45ROneg T cells were prone to proliferate poorly and to undergo activation-induced cell death (AICD) more readily than T cells primed using control DC. DC.Foxp3-induce T cells were typically deficient in Type-1 (and to a lesser extent Th17) function and reinforced in their Type-2 and Treg nature. CD4+CD25+Foxp3+ XiTreg developed using DC.Foxp3 (vs. control DC) were more potent inhibitors of CD4+CD25neg and CD8+ T cell proliferation (in response to mitogenic stimulation using anti-CD3/anti-CD28 microbeads), and in this regard, they were comparable to freshly-isolated CD4+CD25+ nTreg cells. The modest numbers of effector T cells developed in the presence of DC.Foxp3-induced XiTreg appeared polarized towards Type-2 and Treg, and away from Type-1/Th17-type functionality. With regard to Foxp3-induced changes in DC that may be causally linked with their potential regulatory function(s), we observed that ectopic expression of Foxp3 did not alter DC expression of Foxo3 (Fig. 7A), a gene product previously associated with regulatory-type DC [16]. In contrast, the most compelling change we observed in DC.Foxp3 (vs. control DC) characteristics that might be linked to the prevalence of non-Type-1 T cell responses was the inability of these APC (developed from either immature or mature DC; Fig. 7B and Supplemental Fig. 11) to secrete cytokines. In this regard, the ability of ectopic Foxp3 protein to interrupt monocyte-derived DC secretion of cytokines (such as IL-12p70) and to serve as promoters of non-Type-1 dominated CD4+ T cell responses from CD45ROneg T cell precursors appears to be Foxp3 gene product dose-dependent (data not shown). In some cases, cytokine mRNA and protein levels were coordinately lost in DC.Foxp3, while in other cases, cytokines transcript levels appeared to remain stable while the quantity of secreted protein dropped precipitously. We currently have no mechanistic data to suggest a rationale for the disconnection between the RT-PCR and ELISA data in the latter scenario, but there is precedent for disparities in these indices based on mRNA stability and post-transcriptional effects mediated by miRNA [23]. It is also formally possible that the cytokine is produced as a protein, yet not secreted. A recent report by Smith et al. [24] describes a functional defect in macrophages isolated from patients with Crohn’s disease. Such APC express normal levels and stability of cytokine mRNA, but their intracellular and secreted levels of cytokines are profoundly reduced based on the redirection of secretory vesicles into the lysosomal degradation pathway. This does not suggest the same process necessarily underlies the action of DC.Foxp3, but it provides a potential mechanism by which cytokine mRNA and protein indices may be uncoupled. We will be actively investigating such possibilities prospectively.
With regard to the capacity to preferentially prime non-Type-1 T cell responses in vitro, it is also possible that early naïve T cell production of IL-10 in response to DC.Foxp3 (vs. control DC) plays a role in suppressing evolving Type-1 T cell responses [25]. It is also possible that Type-1 and Th17 responses are actually being promoted, but that these cells are subsequently being selectively induced to undergo AICD by DC.Foxp3. It is well-established that Type-1 T cells are differentially susceptible (vs. Th2) to AICD/apoptosis (mediated by Fas, nitric oxide, and kynurenines, among others), in part, based on their low level expression of anti-apoptotic proteins, such as Bcl-2, FAP-1 or γ-glutamyltranspeptidase [26-28]. Recent reports also suggest that Th1 and Th17 cells exhibit heightened sensitivity to galectin-1-induced apoptotic death when compared to Th2 cells, based on their differential glycophenotype [29].
While speculative, it is formally possible that the Foxp3 transgene could be directly transferred into newly-activated T cells by DC.Foxp3, thereby altering the functional balance of transactivator expression in T cells and potentially biasing towards the observed Treg (and to a lesser extent Th2) polarization. We consider this possibility unlikely since: i.) we employed a replication incompetent adenovirus to deliver Foxp3 cDNA into DC and ii.) T cells fail to express the coxsackie\adenovirus receptor necessary for adenovirus cellular-mediated entry [30]. However, based on recent reports for the establishment of nanotube structures between DC and T cells that allow for the intercellular transmission of soluble signals [31], it remains conceivable that the Foxp3 transgene or its translated protein could be conveyed from DC.Foxp3 into T cells. Arguing against this possibility are our findings that CD45RAneg T cells do not differentially augment Foxp3 transcript or protein expression in response to DC.Foxp3 stimulation (Figs. 3 and 5A).
Notably, DC.Foxp3 were unable to induce CD8+ T suppressor cells [32] from either the CD45ROneg or CD45RAneg sub-populations of responder T cells. Indeed, we observed that DC.Foxp3 repressed expression of CD25 (IL-2Rα) and GITR in responder CD8+ T cells when compared to CD8+ T cells stimulated with control DC. This may suggest that DC.Foxp3-mediated suppression of CD8+ T cell responses, at least in part, involves antagonism of T cell responsiveness to IL-2 and/or agonistic signals delivered via GITR-L.
Recently, early activated and proliferating human T cells have been shown to express Foxp3 concomitantly with CD25 chain [18, 19]. Given this consideration, we waited until day 21 of DC-T cell cocultures (i.e. 15 days after the last antigenic stimulation when “resting” CD4+Foxp3+ T cells are most likely to represent bona fide Treg cells [19]) to assess XiTreg phenotype/function. Our data suggests that DC.Foxp3-induced XiTreg co-express T regulatory-associated membrane-bound molecules CTLA-4, GITR and NRP-1 [33]. In contrast, control DC expanded a cohort of T cells that co-expressed Foxp3 and CD25, but these cells failed to co-express CTLA-4, GITR or NRP-1. This may suggest that DC.Foxp3 (vs. control DC) differentially activate the functionally-distinct, regulatory isoforms of Foxp3 in Treg cells [34]. Finally, we confirmed that DC.Foxp3-expanded CD4+CD25+Foxp3+ T cells functionally suppressed responder CD4+ and CD8+ T cell proliferation and Type-1 effector functions in vitro.
Investigation into the regulatory mechanisms exerted by DC.Foxp3 on responder CD45ROneg T cells revealed significant roles for IDO and TGF-β (based on specific inhibitor studies) in altering early day 3 T cell proliferation, apoptotic frequencies and functional polarization status. Of these 2 suppressive molecules, the role for IDO appeared more dominant, and at present, we cannot completely exclude the indirect impact of newly-activated Treg or naïve T cells poised to secrete elevated levels of TGF-β1 in our study results. Furthermore, given the modest upregulation in IDO mRNA in DC.Foxp3 vs. control DC depicted in Fig. 7A and Supplemental Fig. 10 (in the absence of T cells), it is very possible that the major augmentation in IDO functional activity associated with DC.Foxp3 cells occurs only after being “licensed” by T cells. More specifically, “early” DC.Foxp3-induced XiTreg may activate DC.Foxp3 to augment IDO levels/function via a CTLA-4-dependent mechanism [35], thereby reinforcing the non-Type-1 programming of DC.Foxp3-activated T cells in vitro. Prospective studies in which IDO and TGF-β1 expression is modulated in DC.Foxp3 by i.) siRNA knock-down of CTLA-4 in naïve T cells prior to coculture with DC.Foxp3 cells or ii.) CTLA-4-Ig treatment of DC.Foxp3 cells may allow us to determine the direct contribution of these regulatory molecules in our model system.
Overall, our data support the potential utility of DC.Foxp3 in vaccines/therapies designed to prevent or limit the extent of pathologic Type-1 immunity, as occurs in the setting of autoimmunity and allograft rejection. In this same therapeutic context one must also consider the adoptive transfer of purified nTreg or ex vivo activated and expanded XiTreg as an alternative or adjunct means to limit Type-1 immune responses [36, 37]. While such approaches are conceptually hampered by concerns for the unplanned transfer of effector T cell subpopulations, they are currently being evaluated in early phase I clinical trials [46]. In this light, DC.Foxp3-conditioned XiTreg vs. other forms of Treg may be particularly amenable for such clinical applications. In the end, however, such approaches will need to be carefully compared for their efficacy in randomized study designs in order to determine a preferred modality for clinical implementation.
MATERIALS AND METHODS
Plasmids and viruses
Human Foxp3 (hFox) was PCR cloned from human peripheral blood lymphocytes using the following primers: hFox: Fwd 5′-GGATCCTTGGACAAGGACCCGATG-3′, Rev 5′-GAATTCCATCCTCCTTTCCTTGATCTTG-3′. Recombinant Ad.Foxp3 was then generated as previously described [38]. The mock (empty) adenoviral vector Ad.ψ5 was used as control. DC were infected with Ad.ψ5 or Ad.hFox as previously described [38] at a multiplicity of infection (MOI) of 300 for 48h.
DC and T cell preparation
Immature and mature (LPS-activated and αDC1) human monocyte-derived DC were generated from the PBMC of normal, healthy donors as previously described [39]. Immature DC were > 95% CD11c+CD14neg as assessed by flow cytometry. Naïve or memory T cells were isolated by depletion (i.e. negative selection) of CD45RO or CD45RA cells, respectively, from non-adherent cells using MACS™ microbeads (Miltenyi, Gladbach, Germany). Positive-selection for CD4+ or CD8+ T cells was performed on the depleted naïve (CD45ROneg) or memory (CD45RAneg) T cells, using CD4 or CD8 microbeads (Miltenyi), respectively. Flow cytometric analysis for purity of MACS™ isolated-naïve or memory CD4+ or CD8+ T cells was: >98% CD4+CD45RA+ (naïve CD4+ T cells), >98% CD8+CD45RA+ (naïve CD8+ T cells), > 97%+ CD4+CD45RO+ (memory CD4+ T cells) and > 98% CD8+CD45RO+ (memory CD8+ T cells).
Antibodies (Abs), Flow cytometry analysis
DC and T cell staining for surface and/or intracellular molecules was performed using fluorochrome-conjugated antibodies directed against: hCD3, hCD4, hCD8, hCTLA-4, hCD25 (BD Biosciences, San Jose, CA); hGITR, hCD11c (Bio Legend, San Diego, CA); hNeuropilin-1 (NRP-1; Santa Cruz Biotech, Santa Cruz, CA); hIFN-γ, hIL-10 (Miltenyi), hIL-4, hIL-17A, hGranzyme-B, hFoxp3 (clone PCH101), propidium iodide (PI), Annexin-V (eBioscience, San Diego, CA); and HLA-DR, hCD80, hCD86 (R&D Systems, Minneapolis, MN). For intracellular staining analyses, cells were fixed and permeabilized overnight using the fixation-permeabilization kit (eBioscience). After washing in permeabilization buffer, cells were stained with appropriate Abs for 45 minutes at 4°C, washed twice in FACS buffer and analyzed by flow cytometry.
Reverse transcriptase-PCR
RNA was isolated with Trizol (Sigma-Aldrich, St Louis, MO). Reverse transcription was performed using MuLV reverse transcriptase and Random Hexamers (Applied Biosystems, Foster City, CA); 25mM MgCl2 (BSR). Semi-quantitative PCR was used to amplify cDNA for expression of T-bet: Fwd 5′-CCACCAGCCACTACAGGATG-3′ and Rev 5′-GGACGCCCCCTTGTTGTTT-3′; GATA-3: Fwd 5′-GTGCTTTTTAACATCGACGGTC-3′ and Rev 5′-AGGGGCTGAGATTCCAGGG-3′; Foxp3: Fwd 5′-GCACCTTCCCAAATCCCAGT-3′ and Rev 5′-TAGGGTTGGAACACCTGCTG-3′; and RORγt: Fwd 5′-AAATCTGTGGGGACAAGTCG-3′ and Rev 5′-TGAGGGTATCTGCTCCTTGG-3′. Additional RT-PCR for cDNAs encoding IL-23p19, IL-12p35, IL-12\IL-23p40 subunits, the IL-27 subunits EBI3 and p28 subunits, as well as IL-6, TGF-β and IL-10, were performed using previously described primers [39]. β-actin served as an internal control gene product. All primers were purchased from Invitrogen (Grand Island, NY).
ELISA/ELISPOT
Commercial ELISAs for IL-6, IL-10, IL-12p70, IL-23, IFN-γ (BD Biosciences) and IL-23 (eBioscience) were used to quantitate cytokine levels in supernatants per the manufacturer’s protocols. For assays involving DC alone, DC were co-cultured with J558 CD40L+ fibroblasts at a DC:fibroblast ratio of 2:1, or with 10 ng/ml of soluble CD40L-trimer (the kind gift of Dr. Andrea Gambotto, University of Pittsburgh) or 1 μg/ml of LPS (Sigma-Aldrich) + 103 units/ml of rhIFN-γ (R&D Systems) as indicated for 24-48h, prior to the harvest of culture supernatant for cytokine quantitation via ELISA. ELISPOT assays for human IL-5 and IFN-γ (Mabtech, Mariemont, OH) were performed as previously described [39].
CFSE proliferation assays
For autologous studies, DC.Foxp3 or control DC were pulsed with staphylococcus enterotoxin B (SEB; Sigma-Aldrich) at 1 ng/ml in AIM-V media (Invitrogen) for 3h at 37°C prior to culturing with CD45ROneg or CD45RAneg T cells at a DC:T cell ratio of 1:10. For allogeneic studies, donor DC were cultured with allogeneic CD45ROneg or CD45RAneg T cells at a DC:T cell ratio of 1:10. Where indicated, T cells (1 × 10⁵) were pre-labeled with 0.5 μM of CFSE (Sigma-Aldrich) before being cultured with DC for 3 days in AIM-V medium containing rhIL-2 (Peprotech, Rocky Hill, NJ) at a final concentration of 100 U/ml. Responder T cells were collected and stained with APC-conjugated anti-hCD4 mAb prior to flow cytometry analysis.
Apoptosis Assays
Autologous or allogeneic T cells were plated with DC.Foxp3 or control DC at a ratio of 10:1, respectively. On days 3-6, cells were washed once in PBS and stained with APC-conjugated anti-hCD4 or APC-conjugated anti-hCD8 mAbs for 15 minutes at 4°C. Cells were then resuspended and washed twice before staining with PI and Annexin-V-FITC prior to analysis by flow cytometry.
T cell stimulation assays
Autologous or allogeneic T cells were plated with DC.Foxp3 or control DC at a ratio of 10:1. T cells were restimulated with DC (as indicated) on day 5 and supplemented with 20 U/ml of rhIL-2 (Peprotech) and 5 ng/ml of rhIL-7 (Sigma-Aldrich) through day 12-14 (for cytokine analyses) or day 21 (for Foxp3, CTLA-4, GITR, Neuropilin-1 and CD25 expression analyses by flow cytometry). To evaluate intracellular levels of cytokine expression, T cells were stimulated with PMA (1 μg/ml; Sigma-Aldrich) and Ionomycin (10 ng/ml; Sigma-Aldrich) for 4h at 37°C, with 2 μM of monensin (Sigma-Aldrich) added over the final 2h of culture.
T regulatory cell suppression of responder T cells
CD4+CD45ROnegCD4+ T cells were stimulated with control DC vs. DC.Foxp3 cells, then restimulated on day 5 (using identically-prepared DC as applied in the primary stimulation) and supplemented with rhIL-2 and rhIL-7 every other day. On day 21 CD4+CD25+ XiTreg were isolated by MACS™ (Miltenyi). To analyze Treg-mediated suppression of CD8+ T cell responses, XiTreg were cocultured with CFSE-labeled CD8+ T cells at a 1:10 ratio, in presence of 100 U/ml of rhIL-2 and anti-CD3/anti-CD28 Dynabeads™ (Invitrogen). After 72-96h (as indicated), cells were assessed for morphology and for CFSE dilution by flow cytometry. To analyze XiTreg suppression of CD4+ T cell responses, CD4+CD25neg (MACS™, Miltenyi) responder T cells were freshly-isolated from PBMC and labeled with CSFE . XiTreg were labeled with the far-red fluorescent dye CellVue Claret (Molecular Targeting Technologies, Inc., West Chester, PA) per the manufacturer’s suggested protocol and then cocultured with responder CSFE-labeled CD4+ T cells (at a 1:10 ratio) in the presence of anti-CD3/anti-CD28 Dynabeads™ (Invitrogen) for 4 days. Responder CD4+ T cells were identified as CellVueneg events and analyzed for proliferation (i.e. CSFE dilution) and for intracellular IL-2 and IFN-γ content by flow cytometry. In some assays, comparisons were made between XiTreg and nTreg for their ability to suppress CD4+CD45ROnegCD25neg T cell responses. In these instances, nTreg represent freshly-isolated CD8−CD4+CD25+ (MACS™, Miltenyi) cells from the autologous (to the responder T cells) donor source.
Neutralization/Antagonist Assays
DC.Foxp3 or control DC (1 × 10⁵) were plated with 1 × 10⁶ allogeneic T cells in the presence of 500 nM of 1-methyl-tryptophan (1-MT) or 10 μg/ml of neutralizing anti-TGF-β pAb (R&D Systems), anti-hCD95 mAb (Raybiotech), anti-hPDL1 mAb (B7H1; eBioscience), anti-hIL-10 pAb (R&D Systems) or anti-GITR pAb (Bio Legend). On day 3 of culture, total T cells were enumerated and co-stained with PI and Annexin-V for assessment in flow cytometric analyses. Additionally, supernatants were collected to determine levels of secreted IFN-γ using a specific ELISA (BD-Biosciences). In some cases, as indicated, T-DC cultures were extended for 14-21 days, with responder T cells restimulated with DC.Foxp3 vs. control DC in the presence of 20 U/ml rhIL-2 (Peprotech) and 5 ng/ml rhIL-7 (Sigma-Aldrich) +/− addition of neutralizing agents. Day 14 responder T cells were assessed for intracellular IFN-γ by flow cytometry, with CD25 expression evaluated on day 21 of culture.
MLR Restimulation Assays
DC.Foxp3 or control DC (generated from normal donor #1) were cultured with allogeneic bulk naïve T cells (isolated from normal, unrelated donor #2; containing both CD8+ and CD4+ T cells) at a 10:1 ratio, respectively, for 7 days. Responder bulk or positively-isolated (MACS™; Miltenyi) CD4+ or CD8+ T cells were then aliquoted into new 96-flat bottom culture well plates and restimulated with control DC generated from original donor #1 or a third-party, normal donor #3 (unrelated to either donor #1 or #2). Three-to-seven days later, the resulting T cells were counted and the cell-free culture supernatant analyzed for IFN-γ content using a specific ELISA (BD Biosciences). Additionally, T cells were assessed for intracellular IFN-γ using flow cytometry as described above.
Antigen-specific Studies
DC.Foxp3 or control DC were generated from HLA-DR4+ healthy, normal donors. DC were pulsed with 10 μM FluM60-73 peptide (>96% pure; synthesized and validated for identity by the UPCI Peptide Synthesis Facility) for 3h prior to coculturing these APC with autologous CD4+CD45ROneg T cells. Responder T cells were restimulated on day 5 with identically-prepared, peptide-pulsed DC (as used in the primary cultures), with cultures supplemented with rhIL-2 and rhIL-7. On day 14, IL-5 and IFN-γ ELISPOT assays were performed using FluM60-73-pulsed T2.DR4 [40] cells as APC to evaluate antigen-specific cytokine production. On day 18, a specific PE-conjugated HLA-DR4+/FluM60-73 tetramer was used to assess frequencies of Ag-specific CD4+ T cells and to flow sort these cells for analysis of CD25 and Foxp3 co-expression.
Statistical Analyses
Two-tailed Student’s t test was used for data analysis. Null hypothesis was rejected and differences were assumed to be significant at a value of p < 0.05.
Supplementary Material
ACKNOWLEGEMENTS
The authors wish to thank Drs. Adrian Morelli and John Piganelli for their helpful comments provided during the performance of this work and the preparation of this manuscript. We also wish to thank Mr. Dwayne Falkner for outstanding technical assistance. This work was supported by National Institutes of Health P01 grant CA100327 (to W.J.S.) and training grant 5T32CA082084-08 (to M.W.L.);
Abbreviations Used
- 1-MT
1-D/L-methyltryptophan
- Ad
Adenovirus
- AICD
activation-induced cell death
- bcl-2
B-cell lymphoma-2
- FAP-1
Fas-associated phosphatase 1
- GATA-3
GATA binding protein-3
- GITR
glucocorticoid-induced tumor necrosis factor receptor
- NRP-1
neuropilin-1; PDL1, programmed death 1 ligand 1
- RORγt
retinoic acid-related orphan receptor γt
- SEB
staphylococcus enterotoxin B
- T-bet
T-box expressed in T cells
- Tc1
Type-1 CD8+ T cells
- XiTreg
DC-induced CD4+CD25+ Treg.
Footnotes
CONFLICT OF INTEREST The authors declare no financial or commercial conflict of interest.
REFERENCES CITED
- [1.].Miller SD, Turley DM, Podojil JR. Antigen-specific tolerance strategies for the prevention and treatment of autoimmune disease. Nat. Rev. Immunol. 2007;7:665–677. doi: 10.1038/nri2153. [DOI] [PubMed] [Google Scholar]
- [2.].Felix NJ, Allen PM. Specificity of T cell alloreactivity. Nat. Rev. Immunol. 2007;7:942–953. doi: 10.1038/nri2200. [DOI] [PubMed] [Google Scholar]
- [3.].Kapsenberg ML. Dendritic-cell control of pathogen-driven T cell polarization. Nat. Rev. Immunol. 2003;3:984–993. doi: 10.1038/nri1246. [DOI] [PubMed] [Google Scholar]
- [4.].Rossi M, Young JW. Human dendritic cells: potent antigen-presenting cells at the crossroads of innate and adaptive immunity. J. Immunol. 2005;175:1373–1381. doi: 10.4049/jimmunol.175.3.1373. [DOI] [PubMed] [Google Scholar]
- [5.].Heath WR, Belz GT, Behrens GMN, Smith CM, Forehan SP, Parish IA, Davey GM, et al. Cross-presentation, dendritic cell subsets, and the generation of immunity to cellular antigens. Immunol. Rev. 2004;199:9–26. doi: 10.1111/j.0105-2896.2004.00142.x. [DOI] [PubMed] [Google Scholar]
- [6.].Sato K, Yamashita N, Yamashita N, Baba M, Matsuyama T. Regulatory dendritic cells protect mice from murine acute graft-versus-host disease and leukemia relapse. Immunity. 2003;18:367–379. doi: 10.1016/s1074-7613(03)00055-4. [DOI] [PubMed] [Google Scholar]
- [7.].Morelli AE, Thomson AW. Tolerogenic dendritic cells and the quest for transplant tolerance. Nat. Rev. Immunol. 2007;7:610–621. doi: 10.1038/nri2132. [DOI] [PubMed] [Google Scholar]
- [8.].Sato K, Yamashita N, Baba M, Matsuyama T. Modified myeloid dendritic cells act as regulatory dendritic cells to induce anergic and regulatory T cells. Blood. 2003;101:3581–3589. doi: 10.1182/blood-2002-09-2712. [DOI] [PubMed] [Google Scholar]
- [9.].Hannenhalli S, Kaestner KH. The evolution of fox genes and their role in development and disease. Nat. Rev. Genet. 2009;10:233–240. doi: 10.1038/nrg2523. [DOI] [PMC free article] [PubMed] [Google Scholar]
- [10.].Myatt SS, Lam EW. The emerging roles of forkhead box (Fox) proteins in cancer. Nat. Rev. Cancer. 2007;7:847–859. doi: 10.1038/nrc2223. [DOI] [PubMed] [Google Scholar]
- [11.].Wan YY, Flavell RA. Regulatory T cell functions are subverted and converted owing to attenuated Foxp3 expression. Nature. 2007;445:766–770. doi: 10.1038/nature05479. [DOI] [PubMed] [Google Scholar]
- [12.].Zheng Y, Rudensky AY. Foxp3 in control of the regulatory T cell lineage. Nat. Immunol. 2007;8:457–462. doi: 10.1038/ni1455. [DOI] [PubMed] [Google Scholar]
- [13.].Zheng Y, Josefowicz SZ, Kas A, Chu T, Gavin MA, Rudensky AY. Genome-wide analysis of Foxp3 target genes in developing and mature regulatory T cells. Nature. 2007;445:936–940. doi: 10.1038/nature05563. [DOI] [PubMed] [Google Scholar]
- [14.].Hinz S, Pagerols-Raluy L, Oberg H, Ammerpohl O, Grüssel S, Sipos B, Grützmann R, et al. Foxp3 expression in pancreatic carcinoma cells as a novel mechanism of immune evasion in cancer. Cancer Res. 2007;67:8344–8350. doi: 10.1158/0008-5472.CAN-06-3304. [DOI] [PubMed] [Google Scholar]
- [15.].Fallarino F, Bianchi R, Orabona C, Vacca C, Belladonna ML, Fioretti MC, Serreze DV, et al. CTLA-4-Ig activates forkhead transcription factors and protects dendritic cells from oxidative stress in nonobese diabetic mice. J. Exp. Med. 2004;200:1051–1062. doi: 10.1084/jem.20040942. [DOI] [PMC free article] [PubMed] [Google Scholar]
- [16.].Dejean AS, Beisner DR, Chen IL, Kerdiles YM, Babour A, Arden KC, Castrillon DH, et al. Transcription factor foxo3 controls the magnitude of T cell immune responses by modulating the function of dendritic cells. Nat. Immunol. 2009;10:504–513. doi: 10.1038/ni.1729. [DOI] [PMC free article] [PubMed] [Google Scholar]
- [17.].Woodland DL, Dutton RW. Heterogeneity of CD4+ and CD8+ T cells. Curr. Opin. Immunol. 2003;15:336–342. doi: 10.1016/s0952-7915(03)00037-2. [DOI] [PubMed] [Google Scholar]
- [18.].Allan SE, Crome SQ, Crellin NK, Passerini L, Steiner TS, Bacchetta R, Roncarolo MG, Levings MK. Activation-induced Foxp3 in human T effector cells does not suppress proliferation or cytokine production. Int. Immunol. 2007;19:345–354. doi: 10.1093/intimm/dxm014. [DOI] [PubMed] [Google Scholar]
- [19.].Pillai V, Ortega SB, Wang CK, Karandikar NJ. Transient regulatory T-cells: a state attained by all activated human T cells. Clin. Immunol. 2007;123:18–29. doi: 10.1016/j.clim.2006.10.014. [DOI] [PMC free article] [PubMed] [Google Scholar]
- [20.].Munn DH, Mellor AL. Indoleamine 2,3-dioxygenase and tumor-induced tolerance. J. Clin. Invest. 2007;117:1147–1154. doi: 10.1172/JCI31178. [DOI] [PMC free article] [PubMed] [Google Scholar]
- [21.].Wrzesinski SH, Wan YY, Flavell RA. Transforming growth factor-β and the immune response: implications for anticancer therapy. Clin. Cancer Res. 2007;13:5262–5270. doi: 10.1158/1078-0432.CCR-07-1157. [DOI] [PubMed] [Google Scholar]
- [22.].Danke NA, Kwok WW. HLA class II-restricted CD4+ T cell responses directed against influenza viral antigens postinfluenza vaccination. J. Immunol. 2003;171:3163–3169. doi: 10.4049/jimmunol.171.6.3163. [DOI] [PubMed] [Google Scholar]
- [23.].Asirvatham AJ, Magner WJ, Tomasi TB. miRNA regulation of cytokine genes. Cytokine. 2009;45:58–69. doi: 10.1016/j.cyto.2008.11.010. [DOI] [PMC free article] [PubMed] [Google Scholar]
- [24.].Smith AM, Rahman FZ, Hayee B, Graham SJ, Marks DJ, Sewell GW, Palmer CD, et al. Disordered macrophage cytokine secretion underlies impaired acute inflammation and bacterial clearance in Crohn’s disease. J. Exp. Med. 2009;206:1883–1897. doi: 10.1084/jem.20091233. [DOI] [PMC free article] [PubMed] [Google Scholar]
- [25.].Couper KN, Blount DG, Riley EM. IL-10: the master regulator of immunity to infection. J. Immunol. 2008;180:5771–5777. doi: 10.4049/jimmunol.180.9.5771. [DOI] [PubMed] [Google Scholar]
- [26.].Ledru E, Lecoeur H, Garcia S, Debord T, Gougeon ML. Differential susceptibility to activation-induced apoptosis among peripheral Th1 subsets: correlation with Bcl-2 expression and consequences for AIDS pathogenesis. J. Immunol. 1998;160:3194–3206. [PubMed] [Google Scholar]
- [27.].Roozendaal R, Vellenga E, de Jong MA, Traanberg KF, Postma DS, de Monchy JG, Kauffman HF. Resistance of activated human Th2 cells to NO-induced apoptosis is mediated by gamma-glutamyltranspeptidase. Int. Immunol. 2001;13:519–528. doi: 10.1093/intimm/13.4.519. [DOI] [PubMed] [Google Scholar]
- [28.].Fallarino F, Grohmann U, Vacca C, Orabona C, Spreca A, Fioretti MC, Puccetti P. T cell apoptosis by kynurenines. Adv. Exp. Med. Biol. 2003;527:183–190. doi: 10.1007/978-1-4615-0135-0_21. [DOI] [PubMed] [Google Scholar]
- [29.].Toscano MA, Bianco GA, Ilarregui JM, Croci DO, Correale J, Hernandez JD, Zwirner NW, et al. Differential glycosylation of Th1, Th2 and Th17 effector cells selectively regulates susceptibility to cell death. Nat. Immunol. 2007;8:825–834. doi: 10.1038/ni1482. [DOI] [PubMed] [Google Scholar]
- [30.].Wan YY, Leon RP, Marks R, Cham CM, Schaack J, Gajewski TF, DeGregori J. Transgenic expression of the coxsackie/adenovirus receptor enables adenoviral-mediated gene delivery in naive T cells. Proc. Natl. Acad. Sci. U.S.A. 2000;97:13784–13789. doi: 10.1073/pnas.250356297. [DOI] [PMC free article] [PubMed] [Google Scholar]
- [31.].Watkins SC, Salter RD. Functional connectivity between immune cells mediated by tunneling nanotubules. Immunity. 2005;23:309–318. doi: 10.1016/j.immuni.2005.08.009. [DOI] [PubMed] [Google Scholar]
- [32.].Filaci G, Suciu-Foca N. CD8+ T suppressor cells are back to the game: are they players in autoimmunity? Autoimmun. Rev. 2002;1:279–283. doi: 10.1016/s1568-9972(02)00065-4. [DOI] [PubMed] [Google Scholar]
- [33.].Ndhlovu LC, Takeda I, Sugamura K, Ishii N. Expanding role of T-cell costimulators in regulatory T-cell function: recent advances in accessory molecules expressed on both regulatory and nonregulatory T cells. Crit. Rev. Immunol. 2004;24:251–266. doi: 10.1615/critrevimmunol.v24.i4.30. [DOI] [PubMed] [Google Scholar]
- [34.].Allan SE, Passerini L, Bacchetta R, Crellin N, Dai M, Orban PC, Ziegler SF, et al. The role of two Foxp3 isoforms in the generation of human CD4+ Tregs. J. Clin. Invest. 2005;115:3276–3284. doi: 10.1172/JCI24685. [DOI] [PMC free article] [PubMed] [Google Scholar]
- [35.].Mellor AL, Baban B, Chandler P, Marshall B, Jhaver K, Hansen A, Koni PA, et al. Cutting edge: induced indoleamine 2,3 dioxygenase expression in dendritic cell subsets suppresses T cell clonal expansion. J Immunol. 2003;171:1652–1655. doi: 10.4049/jimmunol.171.4.1652. [DOI] [PubMed] [Google Scholar]
- [36.].Sakaguchi S. Regulatory T cells in the past and for the future. Eur. J. Immunol. 2008;38:901–937. doi: 10.1002/eji.200890012. [DOI] [PubMed] [Google Scholar]
- [37.].Riley JL, June CH, Blazar BR. Human T regulatory cell therapy: Take a billion or so and call me in the morning. Immunity. 2009;30:656–665. doi: 10.1016/j.immuni.2009.04.006. [DOI] [PMC free article] [PubMed] [Google Scholar]
- [38.].Ranieri E, Herr W, Gambotto A, Olson W, Rowe D, Robbins PD, Kierstead LS, et al. Dendritic cells transduced with an adenovirus vector encoding Epstein-Barr virus latent membrane protein 2B: a new modality for vaccination. J Virol. 1999;73:10416–10425. doi: 10.1128/jvi.73.12.10416-10425.1999. [DOI] [PMC free article] [PubMed] [Google Scholar]
- [39.].Wesa A, Kalinski P, Kirkwood JM, Tatsumi T, Storkus WJ. Polarized Type-1 dendritic cells (DC1) producing high levels of IL-12 family members rescue patient Th1-type anti-melanoma CD4+ T cell responses in vitro. J. Immunother. 2007;30:75–82. doi: 10.1097/01.cji.0000211316.15278.6e. [DOI] [PubMed] [Google Scholar]
- [40.].Kierstead LS, Ranieri E, Olson W, Brusic V, Sidney J, Sette A, Kasamon YL, et al. gp100/pmel17 and tyrosinase encode multiple epitopes recognized by Th1-type CD4+ T cells. Br. J. Cancer. 2001;85:1738–1745. doi: 10.1054/bjoc.2001.2160. [DOI] [PMC free article] [PubMed] [Google Scholar]
Associated Data
This section collects any data citations, data availability statements, or supplementary materials included in this article.