Abstract
Two methods for purifying hemoglobin (Hb) from red blood cells (RBCs) are examined and compared. In the first method, red blood cell lysate is clarified with a 50 nm tangential flow filter and hemoglobin is purified using immobilized metal ion affinity chromatography (IMAC). In the second method, RBC lysate is processed with 50 nm, 500 kDa, and 50-100 kDa tangential flow filters, then hemoglobin is purified with IMAC. Our results show that the hemoglobins from both processes produce identical Hb products that are ultrapure and retain their biophysical properties (except for chicken hemoglobin, which shows erratic oxygen binding behavior after purification). Therefore, the most efficient method for Hb purification appears to be clarification with a 50 nm tangential flow filter, followed by purification with IMAC, and sample concentration/polishing on a 10-50 kDa tangential flow filter.
Keywords: hemoglobin, protein purification, immobilized metal ion affinity chromatography, zinc
1. Introduction
Approximately 1 in every 4 people will need a blood transfusion at some point during their lifetime. However, due to seasonal shortages and low supplies of rare blood types, donated blood is not always available. Blood shortages are even more severe in developing countries due to decreased donation, poor screening techniques, and a lack of proper blood storage facilities. Therefore, there is a significant need to develop an alternative to donated blood that is safe, stable, easy to store, and easy to manufacture.
Substantial progress has been made in developing hemoglobin-based oxygen carriers (HBOCs) that may be used as alternatives to donated blood. However, large scale production of these HBOCs requires a sufficient supply of highly pure hemoglobin (Hb). Hb may be easily obtained by lysing red blood cells (RBCs). However, RBCs also contain hundreds of soluble protein impurities [1,2] that must be removed from the stock Hb solution before HBOC synthesis. Several methods exist for purifying Hb from RBCs, including heat treatment [3],aqueous phase extraction [4], and anion exchange chromatography [5-7].
Tangential flow filtration (TFF) has also been used to effectively purify Hb from RBCs [8,9]. In the TFF process, Hb is filtered through 50 nm and 500 kDa TFF membranes (which remove viruses and cellular debris) and concentrated with a 50-100 kDa TFF membrane which also removes some small impurities. Despite the attractive features of TFF (low cost, simple and quick operation), recent results have shown that trace impurities (such as catalase) are present in the final TFF Hb product [10]. Therefore, we decided to add an affinity separation step to the TFF process to remove these unwanted impurities.
It has been previously shown that Hbs from many different species (human, bovine, chicken, etc) have a very high affinity for zinc (Ka = 1.3×10⁷ M-1) [11,12]. The zinc ion tightly binds to β143His and β139Asp in the 2,3-diphosphoglycerate (2,3-DPG) binding pocket of human Hb (HbA), while potentially interacting with β 93Cys as well [11,13]. There are also several histidines on the surface of HbA (6 on the α subunit and 7 on the β subunit) [14] which may also bind zinc. At low concentrations, Hb binds zinc and remains soluble, but with a significant increase in oxygen affinity [11]. At high zinc concentrations (>10:1 molar ratio of Zn:Hb), Lehman et al. have shown that Hb may be selectively precipitated from RBC lysate and resuspended upon addition of EDTA, thereby partially purifying Hb [15-17].
Plomer et al. expanded on the zinc precipitation method by using immobilized metal ion (Zn2+) affinity chromatography (IMAC)[18] to purify recombinant HbA (rHbA) from bacterial lysates.[19] In this technique, a chelating resin is used to sequester the Zn2+ ion which in turn binds Hb. The resin may then be washed to remove weakly bound impurities and purify the Hb. The final Hb product may then be removed from the column with EDTA or imidazole, species which have a higher affinity for zinc ions. This technique is commonly used to purify rHbA from bacterial lysates [20-22], however, purification of Hbs from RBC lysate has not yet been fully examined.
In this study, we seek to determine the effectiveness of using IMAC in line with TFF to produce ultrapure human (HbA), bovine (bHb), and chicken Hb (cHb) from their respective RBC lysates. We have examined two types of processes (Scheme 1) in which (1) a single 50 nm TFF filter is used to prepare the lysate for IMAC and (2) a three-stage TFF process (filtration on 50 nm, 500 kDa, and 50/100 kDa) is used to filter and concentrate the Hb samples prior to IMAC. The relative purities and equilibrium oxygen binding characteristics of the Hb products obtained with these processes are also compared to determine the necessity of the 500 kDa and 50/100 kDa TFF stages.
Scheme 1.
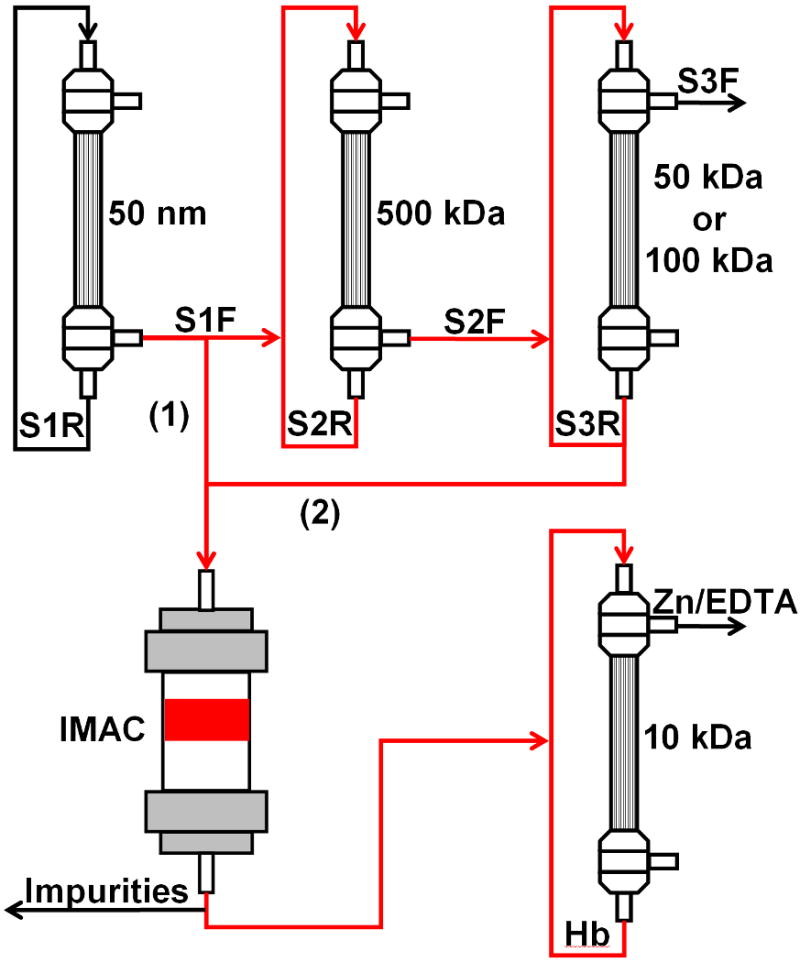
Schematic of the various purification processes. In (1), the RBC lysate is filtered through the 50 nm TFF filter and immediately loaded onto the IMAC column. In (2), the lysate is filtered through both 50 nm and 500 kDa filters, concentrated on a 50-100 kDa filter and then loaded onto the IMAC column. The purified Hb from both processes is finally diafiltered on a 10 kDa filter to remove excess zinc and EDTA.
2. Materials and Methods
2.1 Red Blood Cell Lysis
Blood from bovine (Quad 5, Ryegate, MT), human (American Red Cross, Columbus, OH), and chicken (King & Sons, Bradford, OH) sources were used as the starting material for this study. The blood was initially centrifuged at 3716g for 30 minutes (4°C) to sediment the RBCs. The plasma supernatant was discarded and the RBC pellet was then washed three times by resuspending the RBCs in isotonic 0.9% saline solution and centrifuging at 3716g for 30 minutes at 4°C. After the final saline wash and centrifugation step, the RBC pellet was resuspended in 3.75 mM phosphate buffer (PB, pH = 7.2) and allowed to lyse at 4°C overnight.
2.2 TFF of Hb
The RBC lysate was first clarified by passing it through a column packed with glass wool in order to remove large cellular debris. The clarified lysate was then passed through a three-stage TFF process (Spectrum Labs, Rancho Dominguez, CA) (Scheme 1). The first two TFF stages (50 nm and 500 kDa MWCO) removed viruses, large particles, and cell debris while Hb passed through in the filtrate. In the final TFF stage (25 kDa MWCO for cHb, 50 kDa MWCO for HbA and bHb), Hb was retained and concentrated, while impurities with smaller molecular weights (some proteins, 2,3-DPG, etc) were removed in the filtrate. Samples for IMAC purification were taken from the filtrate at the end of Stage 1 (S1F) and from the retentate at the end of Stage 3 (S3R). Aliquots of each sample were then separated and frozen at -80°C until ready for IMAC purification.
2.3 IMAC of Hb
A XK 50/30 column was packed with 200 mL of Chelating Sepharose Fast Flow resin (GE Healthcare, Piscataway, NJ). The resin was initially washed with ultrapure H2O until the conductivity of the effluent decreased below < 0.5 mS/cm. The resin was then charged with 300 mL of 15 mM zinc acetate (ZnOAc) or until the conductivity of the effluent was stable at ∼2.5 mS/cm. Excess ZnOAc was removed from the column by flushing it with 0.2 M NaCl until the conductivity leveled off at 20.4 mS/cm. At this point, the column was cooled with cold water to maintain a resin temperature of ∼2°C. Hb samples were diluted 10× with Wash Buffer 1 (20 mM Tris, 500 mM NaCl, pH = 8.3) and approximately 1.5 grams of Hb was loaded onto the column. During sample loading, the effluent was collected as soon as the absorbance at 280 nm (A280) began to spike to collect the first impurity fraction. After all of the sample was loaded onto the column, the column was washed further with Wash Buffer 1 until the A280 off the column effluent returned to zero. The column was then washed with Wash Buffer 2 (200 mM Tris for HbA and bHb, 500 mM Tris + 500 mM NaCl for cHb, pH = 8.3) and Wash Buffer 3 (20 mM Tris, pH = 8.3). During both washes, the column effluent was collected and concentrated with 10 kDa centrifugal filters (Millipore, Billerica, MA). Finally, the column was flushed with 15 mM ethylenediamine tetraacetic acid (EDTA) in 20 mM Tris (pH = 8.3) and the effluent was collected as soon as the absorbance at 540 nm (A540) began to increase. When all the Hb had been collected (effluent A540 ≤ 1 mAU), the column was washed with 0.2 M NaOH and stored at room temperature. The Hb product was subsequently concentrated on a 10 kDa TFF cartridge (Spectrum Labs) until the sample volume was reduced to 20 mL, then it was diluted 10× with 20 mM Tris (pH 8.3) and concentrated again. This process was repeated once more to remove any remaining EDTA-Zn complex from the sample. The final Hb product was then stored at -80°C until it could be analyzed.
2.4 SDS-Polyacrylamide Gel Electrophoresis (SDS-PAGE)
SDS-PAGE was performed according to the method of Laemmli [23] using 15% polyacrylamide gels. Samples were prepared by diluting them 1:1 with Laemmli sample buffer (+ 5% β-mercaptoethanol) and incubating at 95°C for 5 minutes. In all lanes containing Hb, the gel was overloaded with ∼ 150 μg of Hb to detect any impurities. Precision Plus Protein Standards (7.5 μL, BioRad, Hercules, CA) were loaded on the sides of the gel for MW estimation. All gels were run at 115 V for 75 min, then stained overnight in Coomasie Blue R250 stain buffer (BioRad). The gels were finally destained with destaining buffer (20% ethanol, 10% acetic acid) and visualized with a Gel Doc XR system (BioRad).
2.5 Matrix-Assisted Laser Desorption/Ionization (MALDI) Spectroscopy
Hb samples were diluted to 1 mg/mL, then 1 μL of the diluted Hb was mixed with 1 μL HCl (1 M) and 1 μL 50% acetonitrile saturated with sinapic acid. A calibration sample containing cytochrome C (12,360.97 Da) and apomyoglobin (16,952.31 Da) was prepared in a similar fashion. The samples were then analyzed using a Bruker Daltonics FLEX instrument (Billerica, MA). The data from the Hb samples was adjusted using a linear model based on the observed and predicted molecular weights in the calibration sample.
2.6 Methemoglobin (MetHb) Determination
UV-Vis spectroscopy was used to determine the Hb and metHb concentrations of the purified Hbs using the cyanmethemoglobin method [24,25]. The absorbance of the sample was first measured at 630 nm (L1). The samples were diluted (by a factor of D1) to yield absorbance readings of L1 between 0.1-1.0. Three drops of 1:1 KCN solution (10% KCN: 10 mM PB) were added to 3 mL of sample and the absorbance was measured again at 630 nm (L2). The metHb concentration was calculated using Eq. 1:
| (1) |
Where E1 = 3.7 (cm-mM)-1 is the extinction coefficient of metHb at 630 nm [24] and λ is the path length. To measure Hb concentration, 2 drops of K3Fe(CN)6 were added to diluted (D2) 1 mL of sample. After 2 minutes of incubation at room temperature, 2 drops of 10% KCN were added to the sample. The final absorbance at 540 nm was then measured to obtain the value of L3. The total Hb concentration was calculated using Eq. 2:
| (2) |
Where E2 = 11.0 (cm-mM)-1 is the extinction coefficient of Hb at 540 nm [24] and λ is the path length. Finally, the metHb level was calculated using Eq. 3:
| (3) |
2.7 Oxygen Equilibrium Measurements
Oxygen equilibrium curves for all Hbs were obtained with a Hemox Analyzer (TCS Scientific, New Hope, PA). Approximately 20-400 μL of Hb sample was diluted with 4.6-5.0 mL of Hemox Buffer (pH 7.4), 20 μL of Additive A (containing bovine serum albumin), 10 μL of Additive B, and 10 μL of anti-foaming agent (TCS Scientific). The sample was saturated with oxygen by flushing it with compressed air (pO2 = 148 mm Hg) and brought to a constant temperature of 37.0 + 0.5°C. The samples were then flushed with pure nitrogen and the respective absorbances of oxy- and deoxy-Hb were recorded as a function of the solution pO2 until the pO2 decreased to < 2.0 mm Hg. The oxygen equilibrium data was then fit to the Hill Model (Eq. 4) to obtain values for P50 and n:
| (4) |
Where Y is the fractional saturation of Hb, Ao is the absorbance at 0 mm Hg O2 and A∞ is the absorbance at full saturation. P50 is the partial pressure of oxygen (pO2) at which the heme binding sites in the Hb sample are 50% saturated with oxygen, while n is the Hill coefficient, a measurement of cooperativity in oxygen binding.
3. Results and Discussion
3.1 SDS-PAGE
As expected, IMAC was able to effectively purify Hb from RBC lysate and remove many impurities. Samples obtained from TFF and during IMAC are shown on the SDS-PAGE gels in Figure 1. The second lane in each gel shows that all Hb samples from TFF, both from the Stage 1 filtrate (S1F) and the Stage 3 retentate (S3R), contain Hb and several other impurities. Once Hb is bound to the IMAC column, lanes 3-5 in each gel show the impurities that are removed with each subsequent wash. Most of the impurities never bind to the column and are removed in the first wash, which also removes impurities which are electrostatically bound to Zn2+ with 500 mM Cl- (lane 3). The second wash utilizes a high concentration of Tris (which has a low affinity for Zn2+) to remove impurities with a low affinity for the resin (lane 4). Finally, even more impurities are removed with the 20 mM Tris wash (lane 5). When Hb is eluted from the column with EDTA, only 5 bands are present (Lane 6). The bottom band (∼15 kDa) represents the individual subunits of the Hbs.
Figure 1.
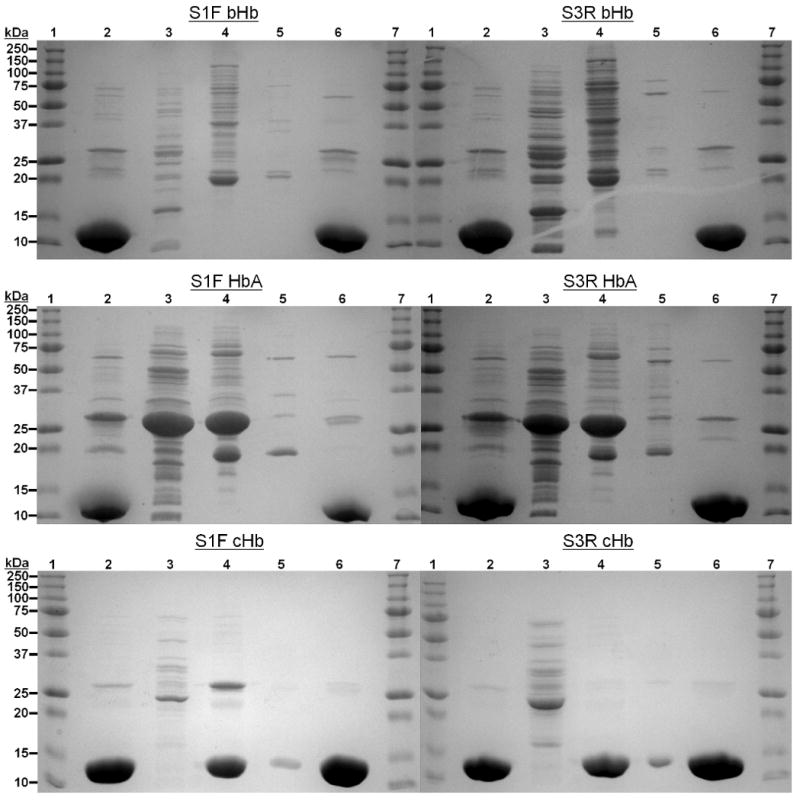
SDS-Polyacrylamide Gel Electrophoresis (PAGE) of IMAC samples. (1 & 7) = Protein Molecular Weight Ladder (2) = Starting material from TFF, either S1F or S3R, (3) = Impurities removed with Wash 1, (4) = Impurities removed with Wash 2, (5) = Impurities removed with Wash 3, (6) = Final EDTA elution of Hbs. 150 μg of Hb was loaded in lanes 2 & 6.
Two other bands, located at 32 and 64 kDa, represent fused αβ dimers and tetramers, respectively. These dimers and tetramers are likely formed during the heat treatment step in PAGE sample preparation. The other two bands, located at approximately 21 and 25 kDa, are present in all of the purified Hb products. We attempted to separate these unidentified bands from the final sample by eluting the Hb off of the column with a pH gradient (Hb eluted at around pH = 4.0) and an imidazole gradient instead of using EDTA. However, these two bands were still present in those final products (data not shown). Therefore, these bands may simply be an aggregation/degradation product of SDS-PAGE sample preparation.
Interestingly, during chicken Hb (cHb) purification, a defined red band is eluted during the second IMAC wash step, while the majority of the red color remained on the resin. This weakly bound Hb species mostly eluted during the second wash, but a trace amount was also collected during the third wash as well. It has been previously shown that chickens contain two types of Hb, an A-type (with αA and β subunits) and a D-type (with αD and β subunits). The D-type has fewer histidines (αD = 6, β = 5) than the A-type (αA = 9, β = 5) and it lacks the β143His residue implicated in zinc binding. Therefore, the Hb that eluted during the second wash of IMAC is most likely the D-type of cHb, since it should have a much lower affinity for zinc than the A type.
3.2 MALDI
MALDI was used to estimate the molecular weight of the purified Hb subunits and detect any major impurities which may have been present (Figures 2-5). The observed molecular weights of HbA shown in Figure 2, α = 15127.2 g/mol & β = 15867.8 g/mol, closely agree with their theoretical molecular weights (α = 15126.4 g/mol, β = 15867.2 g/mol). The observed MWs of bHb shown in Figure 3, α = 15053.9 g/mol & β = 15954.6 g/mol, also correlate with their expected molecular weights (α = 15053.2 g/mol, β = 15954.4 g/mol).
Figure 2.
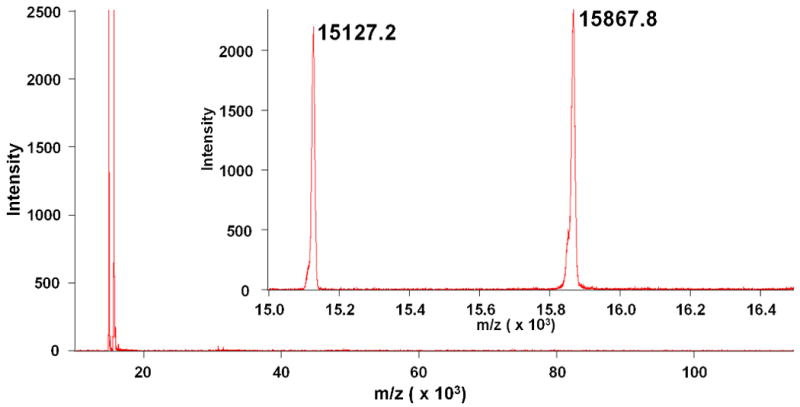
Long range (10-120 kDa) and short range (15-16.5 kDa, inset) MALDI scan of IMAC purified HbA. Two peaks are observed near the expected molecular weights for the α (15,126.4 g/mol) and β (15,867.2 g/mol) subunits of HbA.
Figure 5.
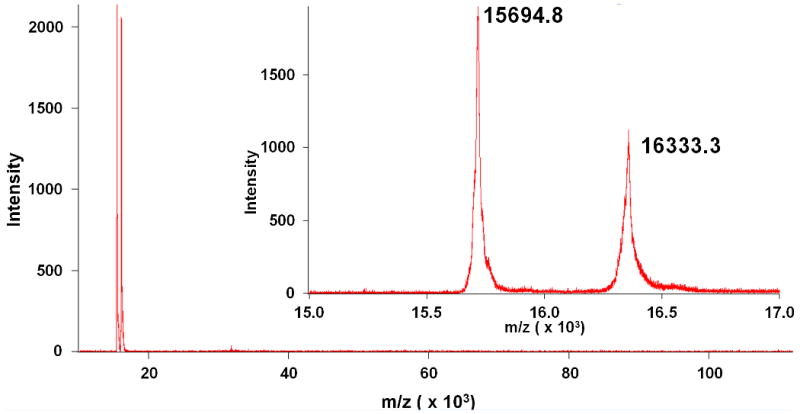
Long range (10-120 kDa) and short range (15-17 kDa, inset) MALDI scans of IMAC purified cHb-D. Two peaks are observed near the expected molecular weights for the αD (15,694.9 g/mol) and β (16,334.9 g/mol) subunits of cHb-D.
Figure 3.
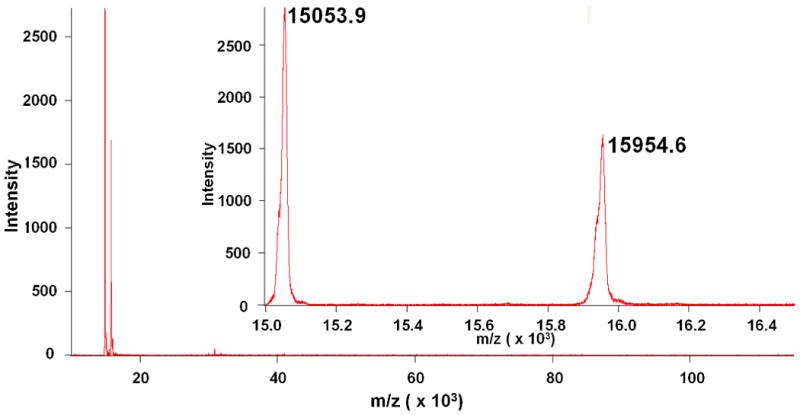
Long range (10-120 kDa) and short range (15-16.5 kDa, inset) MALDI scans of IMAC purified bHb. Two peaks are observed near the expected molecular weights for the α (15,053.2 g/mol) and β (15,954.4 g/mol) subunits of bHb.
Analysis of the two Hb fractions obtained during IMAC purification of cHb confirms that the Hb removed during the second wash step is the D-type of cHb. The MWs observed in this fraction (Figure 5), 15694.8 g/mol & 16333.3 g/mol, are almost identical to the MWs expected for the αD subunit (15694.9 g/mol) and the β subunit (16334.9 g/mol) of cHb. Meanwhile, the final cHb IMAC product obtained after EDTA elution (Figure 4) has three peaks at 15297.5, 15694.2, and 16333.3 g/mol. The first peak corresponds to the αA subunit (15297.7 g/mol), while the latter two peaks match the αD and β subunits, respectively. It is important to note that while the D-type sample in Figure 4 appears to contain no A-type whatsoever, a small amount of D-type remains in the A-type fraction. The column was extensively washed with high concentrations of Tris and NaCl, however, we were unable to completely remove the trace amount of D-type from the A-type fraction.
Figure 4.
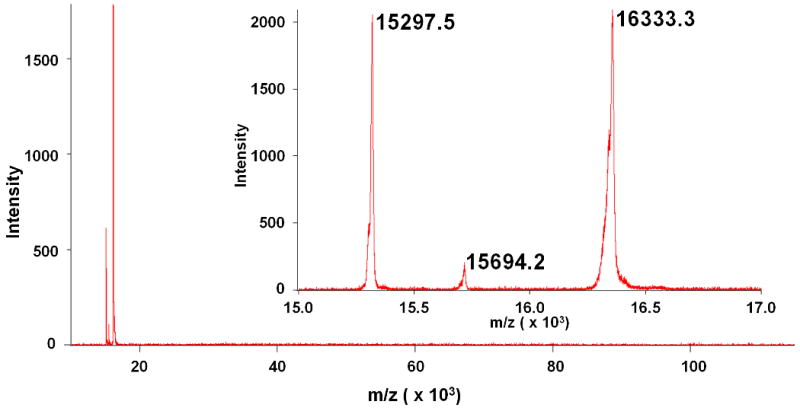
Long range (10-120 kDa) and short range (15-17 kDa, inset) MALDI scans of IMAC purified cHb-A. Three peaks are observed near the expected molecular weights for the αA (15,297.7 g/mol), αD (15,694.9 g/mol), and β (16,334.9 g/mol) subunits of cHb.
Long range scans of each Hb sample (10-120 kDa) show no major impurities. This is in contrast to the SDS-PAGE gels, which showed bands at 21, 25, 32, and 64 kDa. Close range scans from 20-30 kDa also fail to detect any impurities at 21 or 25 kDa (data not shown).
3.3 MetHb Analysis
Table 1 shows the levels of metHb (oxidized hemoglobin) in the final Hb samples. The “control” sample in each case refers to the metHb level of the sample taken directly from TFF (either S1F or S3R). In all cases, metHb levels are below acceptable levels (≤ 5.0%). Interestingly, in most cases the metHb level remains constant throughout the IMAC process, showing that the IMAC purification does not oxidize the Hb samples.
Table 1. MetHb level of purified Hb products. The starting material used for each purification is indicated by “Control” and the final product is indicated by “Purified Hb”.
| S1F HbA | S3R HbA | S1F bHb | S3R bHb | S1F cHbA | S3R cHbA | |
|---|---|---|---|---|---|---|
| Control | 3.3% | 0.9% | 1.3% | 0.9% | 2.9% | 5.0% |
| Purified Hb | 2.8 ± 0.6% | 1.4 ± 0.5% | 0.8 ± 0.4% | 1.1 ± 0.1% | 2.1 ± 2.0% | 3.4 ± 1.6% |
3.4 Oxygen Equilibrium Binding
Characteristic oxygen equilibrium curves (OECs) for HbA and bHb are shown in Figure 6, while values for P50 and n are given in Table 2. The data for HbA and bHb fit the Hill model extremely well. The IMAC purified bHb and HbA OECs overlapped the control OECs, which were taken from Stage 1 and Stage 3 of the TFF process. The oxygen affinity at half saturation (P50) and cooperativity coefficient (n) show no significant difference between the starting Hb material used for IMAC and the final purified Hb samples. These values also agree with the expected values for HbA (P50 = 12-14 mm Hg, n = 2.5-2.9) and bHb (P50 = 24-28 mm Hg, n = 2.5 − 3.0).
Figure 6.
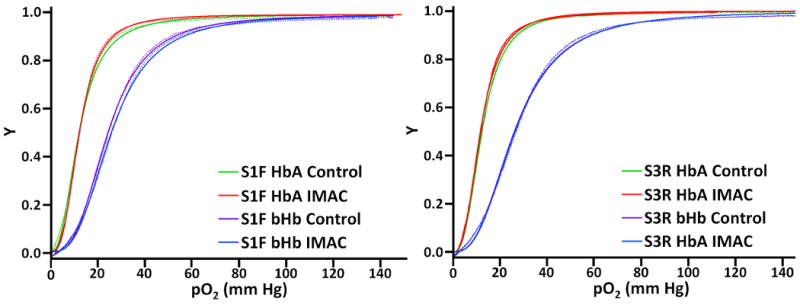
Oxygen equilibrium curves for IMAC purified HbA and bHb, showing the fraction of Hb bound to oxygen (Y, y-axis) at various oxygen partial pressures (pO2, x-axis). The experimental data are represented by dotted lines, while curve fits are represented by solid lines for each sample.
Table 2. Oxygen affinity (P50) and cooperativity (n) of purified Hbs. The starting material used for each purification is indicated by the suffix “Control” and the final product is indicated by the suffix “IMAC”.
| Sample | P50 (mm Hg) | n |
|---|---|---|
| S1F HbA Control | 12.3 | 2.5 |
| S1F HbA-IMAC | 12.2 ± 0.2 | 2.7 ± 0.2 |
| S3R HbA Control | 12.6 | 2.8 |
| S3R HbA-IMAC | 13.0 ± 0.9 | 2.7 ± 0.4 |
| S1F bHb Control | 24.8 | 3.0 |
| S1F bHb-IMAC | 25.5 ± 0.7 | 2.8 ± 0.1 |
| S3R bHb Control | 26.4 | 2.7 |
| S3R bHb IMAC | 26.1 ± 0.5 | 2.7 ± 0.1 |
| S1F cHb Control | 28.8 | 2.2 |
| S1F cHb-D IMAC | 13.2 ± 8.5 | 2.6 ± 0.4 |
| S1F cHb-A IMAC | 17.0 ± 2.3 | 1.1 ± 0.1 |
| S3R cHb Control | 30.2 | 2.4 |
| S3R cHb-D IMAC | 19.8 ± 8.85 | 2.5 ± 0.3 |
| S3R cHb-A IMAC | 25.1 ± 5.73 | 1.6 ± 0.4 |
Hemox analysis of the IMAC purified A-type and D-type cHb samples was somewhat unpredictable (Figure 7). While the control cHb samples (from both S1F and S3R of TFF) displayed consistent OECs and values for P50 (28-30 mm Hg) and n (2.2-2.4), the A-type and D-type samples were quite inconsistent. The irregular shape of the A-type OECs made them impossible to fit to the Hill model, giving them extremely low cooperativities (n ≤ 1.5). Their P50 values were also quite varied and much lower than the control samples. On the other hand, the D-type samples produced sigmoidal curves with good cooperativity (n = 2.5-2.6). However, their P50 values were as random as the A-type samples, ranging from 8-25 mm Hg. Measurements of the cHb samples were repeated several times and consistently produced the same results.
Figure 7.
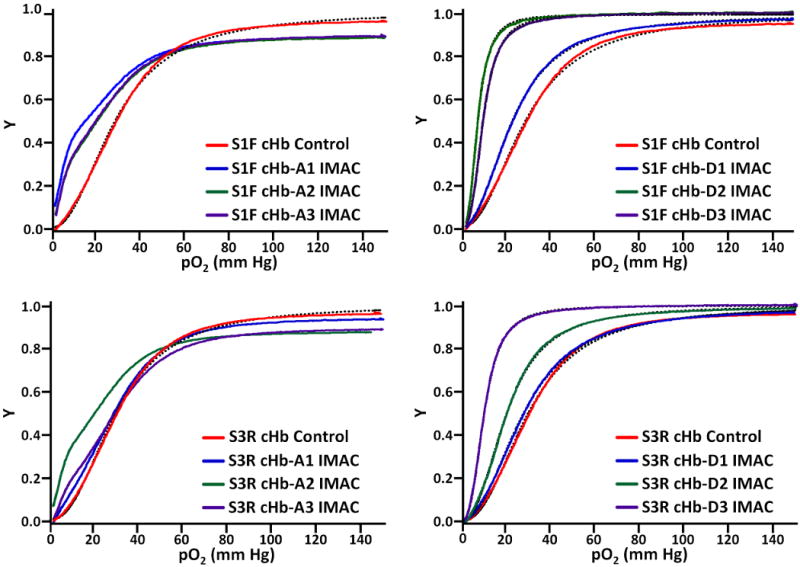
Oxygen equilibrium curves for IMAC purified cHb, showing the fraction of Hb bound to oxygen (Y, y-axis) at various oxygen partial pressures (pO2, x-axis). The experimental data is represented by solid lines, while curve fits are represented by dotted lines for the control and D-type samples.
3.5 Hb Purity
The SDS-PAGE gels in Figure 1 show that a substantial amount of impurities are removed during IMAC purification of Hb. Therefore, while TFF is a highly efficient process, it cannot effectively separate RBC proteins. It is important to mention, however, that the impurities shown in the PAGE gels are extremely concentrated, so TFF purified Hb may still be suitable for applications which do not require extremely high purity.
The IMAC purified Hb samples all seem to be ultrapure, showing expected bands for Hb at 15, 32, and 64 kDa (monomers, dimers, and tetramers, respectively). The other two unidentified bands seen on the PAGE gels at 21 & 25 kDa are most likely artifacts of PAGE sample preparation, since they are undetectable with MALDI. It is also important to note that the impurities were observed to elute with the Hbs even when pH and imidazole gradients were used for elution. Therefore, the IMAC-purified Hbs appear to be 100% pure. Finally, MALDI analysis shows that the molecular weights of the purified Hbs are within 1-2 gm/mol of the theoretical MW, indicating that IMAC does not have any structural or chemical effects on the Hbs.
3.6 Hb Function
The equilibrium oxygen binding characteristics of HbA and bHb seem to be unaffected by IMAC purification. However, the cHb samples purified with IMAC seem to be vastly affected in some way. It appears that IMAC purification of cHb A-type and D-type tends to consistently increase their oxygen affinities, much in the same way zinc has been shown to increase the oxygen affinity of Hb. However, the cHb samples were extensively diafiltered (similarly to the HbA and bHb samples) to remove any trace amounts of zinc. It may be possible that the A-type of cHb requires a metal ion cofactor for proper oxygen binding which is stripped away by EDTA during the elution step. However, this does not explain the erratic behavior of the D-type sample. Perhaps the two types of cHb act synergistically to give the behavior shown in the control samples, but other studies on the A-type and D-type of cHb and the control samples do not show such a phenomenon. To add to the complexity of this situation, preliminary light scattering results show that large soluble aggregates are present in both the A-type (∼1,000,000 Da) and D-type (∼750,000 Da). Further work will have to be done to elucidate the cause of this erratic behavior.
3.7 Necessity of the 500 kDa and 50-100 kDa TFF Filtration Stages
All the Hbs show similar results during IMAC purification, regardless of whether the starting material came from TFF Stage 1 filtrate or Stage 3 retentate. The SDS-PAGE gels show that equal amounts of impurities are removed from all the samples and the end products are of equivalent purity. There is also little to no change in the metHb levels of the samples. The oxygen binding of all Hbs are also consistent, whether the starting material for IMAC is Stage 1 filtrate or Stage 3 retentate. Therefore, it seems that Stage 1 filtrate should be used for IMAC and the additional TFF stages (500 kDa and 50 kDa) are unnecessary.
3.8 Economic Considerations
The main alternative to IMAC purification of Hb is anion exchange chromatography [6,7]. Both processes are able to produce essentially pure Hb, but there are some differences in the costs associated with each process. For instance, the Chelating Sepharose resin costs ∼3× more than Q-Sepharose (AEX resin). However, we have observed that Q-Sepharose becomes damaged during Hb purification and must be replaced periodically, whereas Chelating Sepharose may be used virtually indefinitely. Therefore, the initial costs of IMAC are higher, but the maintenance costs are lower than AEX. We have also observed that Hb is also susceptible to oxidation on Q-Sepharose but not on Chelating Sepharose. Oxidation may be avoided by equilibrating the Hbs with carbon monoxide (CO) before AEX purification, however, the CO must then be removed with an additional process step. In fact, besides small losses in sample loading and during TFF concentration, almost 90-100% of the initial protein is recovered after IMAC purification. The downside to IMAC purification is that zinc acetate and EDTA must be used during each purification, adding to the operating costs of the column. While the zinc and EDTA are effectively removed from the final product by diafiltration, the filtrate must be dealt with as hazardous waste since zinc is an environmental hazard. A favorable alternative would be eluting the Hb from the column without using EDTA, thus eliminating the need to replace the zinc during every purification. However, we were unable to find an alternative to EDTA elution that did not significantly damage the Hb.
4. Conclusion
The results presented here prove that IMAC and TFF are able to completely purify a variety of Hbs (human, bovine, and chicken) in a single affinity purification step. It is important to note, however, that TFF is still an important part of the purification scheme. The optimum technique would consist of 3 steps – (1) RBC lysate clarification and virus removal by a 500 kDa TFF filter, then (2) affinity purification by IMAC, and (3) sample concentration and removal of Zn/EDTA with a 10-100 kDa TFF filter. This process is able to produce large amounts of ultrapure Hb with desirable oxygen binding characteristics for HBOC synthesis. In addition, since zinc binding seems to be evolutionarily conserved in diverse types of Hbs, this technique would likely work for Hb purification from almost any other species.
Acknowledgments
This work was supported by National Institutes of Health grants R01HL078840 and R01DK070862 to AFP. Special thanks to Dr. John S. Olson and his students, who first introduced us to the IMAC techniques used in this paper.
Abbreviations
- Hb
hemoglobin (any species)
- HbA
human adult hemoglobin
- bHb
bovine hemoglobin
- cHb
chicken hemoglobin
- TFF
tangential flow filtration
Footnotes
Publisher's Disclaimer: This is a PDF file of an unedited manuscript that has been accepted for publication. As a service to our customers we are providing this early version of the manuscript. The manuscript will undergo copyediting, typesetting, and review of the resulting proof before it is published in its final citable form. Please note that during the production process errors may be discovered which could affect the content, and all legal disclaimers that apply to the journal pertain.
Citations
- 1.Pasini EM, Kirkegaard M, Mortensen P, Lutz HU, Thomas AW, Mann M. Blood. 2006;108:791. doi: 10.1182/blood-2005-11-007799. [DOI] [PubMed] [Google Scholar]
- 2.Kakhniashvil DG, Bulla LAJ, Goodman SR. Proteomics. 2004:501. doi: 10.1074/mcp.M300132-MCP200. [DOI] [PubMed] [Google Scholar]
- 3.Sakai H, Takeoka S, Nishide H, Tsuchida E. Artif Cells Blood Substit Immobil Biotechnol. 1994;22:651. doi: 10.3109/10731199409117895. [DOI] [PubMed] [Google Scholar]
- 4.Lee CJ, Kan P. US Pat 5,407,579. 1993
- 5.Sun G, Palmer AF. J Chromatogr B Analyt Technol Biomed Life Sci. 2008;867:1. doi: 10.1016/j.jchromb.2008.02.014. [DOI] [PMC free article] [PubMed] [Google Scholar]
- 6.Houtchens RA, Rausch CW. US Pat 6,150,507. 2000
- 7.Pliura DH, Wiffen DE, Ashraf S, Magnin AA. US Pat 5,545,328. 1996
- 8.Palmer AF, Sun G, Harris DR. Biotechnol Prog. 2009;25:189. doi: 10.1002/btpr.119. [DOI] [PMC free article] [PubMed] [Google Scholar]
- 9.Elmer J, Harris DR, Sun G, Palmer AF. Biotechnol Prog. 2009;25:1402. doi: 10.1002/btpr.217. [DOI] [PMC free article] [PubMed] [Google Scholar]
- 10.Elmer J, Buehler PW, Jia Y, Wood F, Harris DR, Alayash AI, Palmer AF. Biotechnol Bioeng. 2010;106:76. doi: 10.1002/bit.22659. [DOI] [PubMed] [Google Scholar]
- 11.Rifkind JM, Heim JM. Biochemistry. 1977;16:4438. doi: 10.1021/bi00639a017. [DOI] [PubMed] [Google Scholar]
- 12.J.G. Gilman, F.J. Oelshlegel, Jr., G.J. Brewer, Brewer, G.J. ed. Alan Liss, New York (1975) 85.
- 13.Gilman JG, Brewer GJ. Biochem J. 1978;169:625. doi: 10.1042/bj1690625. [DOI] [PMC free article] [PubMed] [Google Scholar]
- 14.Xu Y, Zheng Y, Fan JS, Yang D. Nat Methods. 2006;3:931. doi: 10.1038/nmeth938. [DOI] [PubMed] [Google Scholar]
- 15.Carrell RW, Lehmann H. J Clin Pathol. 1981;34:796. doi: 10.1136/jcp.34.7.796. [DOI] [PMC free article] [PubMed] [Google Scholar]
- 16.Lehmann H, Williamson D, Carrell RW, Lucas JE. Hemoglobin. 1982;6:183. doi: 10.3109/03630268209002293. [DOI] [PubMed] [Google Scholar]
- 17.Tye RW. US Pat 4,473,494. 1984
- 18.Porath J, Carlsson J, Olsson I, Belfrage G. Nature. 1975;18:598. doi: 10.1038/258598a0. [DOI] [PubMed] [Google Scholar]
- 19.Plomer JJ, Ryland JR, Matthews MAH, Traylor DW, Milne EE, Durfee SL, Mathews AJ, Neway JO. US Pat 5,840,851. 1998
- 20.Hartman JC, Argoudelis G, Doherty D, Lemon D, Gorczynski R. Eur J Pharmacol. 1998;363:175. doi: 10.1016/s0014-2999(98)00830-9. [DOI] [PubMed] [Google Scholar]
- 21.Asmundson AL, Taber AM, van der Walde A, Lin DH, Olson JS, Anthony-Cahill SJ. Biochemistry. 2009;48:5456. doi: 10.1021/bi900216p. [DOI] [PMC free article] [PubMed] [Google Scholar]
- 22.Villarreal DM, Phillips CL, Kelley AM, Villarreal S, Villaloboz A, Hernandez P, Olson JS, Henderson DP. Appl Environ Microbiol. 2008;74:5854. doi: 10.1128/AEM.01291-08. [DOI] [PMC free article] [PubMed] [Google Scholar]
- 23.Laemmli UK. Nature. 1970;227:680. doi: 10.1038/227680a0. [DOI] [PubMed] [Google Scholar]
- 24.Crosby WH, Munn JI, Furth FW. U S Armed Forces Med J. 1954;5:693. [PubMed] [Google Scholar]
- 25.Zijlstra WG, van KE. Clin Chim Acta. 1960;5:719. doi: 10.1016/0009-8981(60)90014-0. [DOI] [PubMed] [Google Scholar]


