Abstract
Artifacts due to enhancement, reverberation, and multi-path reflection are commonly encountered in medical ultrasound imaging. These artifacts can adversely affect an automated image quantification algorithm or interfere with a physician’s assessment of a radiological image. This paper proposes a soft wavelet thresholding method to replace regions adversely affected by these artifacts with the texture due to the underlying tissue(s), which were originally obscured. Our proposed method soft thresholds the wavelet coefficients of affected regions to estimate the reflectivity values caused by these artifacts. By subtracting the estimated reflectivity values of the artifacts from the original reflectivity values, estimates of artifact reduced reflectivity values are attained. The improvements of our proposed method are substantiated by an evaluation of Field II simulated, in vivo mouse and human heart B mode images.
Index Terms: Ultrasound imaging, artifact reduction, wavelet thresholding
I. Introduction
Medical ultrasound imaging artifacts can obscure important features such as evidence of atherosclerotic vessel disease, heart wall abnormalities, and other anatomic irregularities. Removing the various artifacts that could arise in an ultrasound image may improve the usefulness of this modality in providing a more reliable aid to medical diagnosis. This task is challenging in that artifacts and objects of interest are not easily separated, the artifact free objects of interest should remain intact, and the artifact reduction process should not introduce other imaging artifacts. Although the ultrasound image can be affected by various artifacts, the three types of ultrasound artifacts specifically addressed in this paper are caused by enhancement, reverberation, and multi-path reflection of the ultrasonic sound wave as it travels across or around highly reflective objects or interfaces. The description of these types of artifacts given in [1] are paraphrased in the following:
Enhancement artifacts are due to hyperintensive signal that occurs when very low attentuation occurs distal (such as with fluid filled cavities and cysts) to the transducer.
Reverberation artifacts occur when reflected ultrasound energy is reflected back and forth between two spaced interfaces during signal acquisition and prior to the next transmitted pulse.
Artifacts due to multi-path reflection occur when the ultrasound beam is nonperpendicularly reflected or refracted off a highly reflective surface and subsequently detected at the transducer.
Enhancement artifacts appear as a brighter than realistic image region. It is not enough simply to reduce the brightness of the artifact plagued region. Rather, a method to uncover reflectivity values due to the underlying tissue(s) is needed. Since the range distance from the transducer to a sound reflecting object is directly related to time in ultrasound imaging, the occurrence of reverberation artifacts appear as multiple equal spaced objects with amplitudes decreasing as depth increases. The paths of nonperpendicularly reflected beams take longer to reach the transducer than the paths of perpendicularly reflected beams. This causes parts of highly reflective objects to reappear further away from the transducer. These multipath reflection artifacts are seen as misplaced objects in the ultrasound image. When imaging organs, muscles, or tissues that are in close proximity of highly reflective structures such as bones or tissue/gas interfaces, the undesirable occurrences of enhancement, reverberation, and multi-path reflection artifacts are common when using this imaging modality.
The reduction of these artifacts is necessary in improving the ultrasound imaging system so that the motions and borders of cardiac muscles and tissues can be accurately observed or tracked. In our examples, by removing/reducing enhancement, reverberation, and multi-path reflection artifacts caused by the highly ultrasound reflecting nature of the ribs or other objects in close proximity to the distal blood filled cavities of the heart, we offer improvements to the B mode ultrasound images so that the motions and borders of the left ventricle myocardium1 or other parts of the heart can be more precisely evaluated by an automated algorithm, a physician, or a combination of both.
An appropriately placed short axis sonograph of the left ventricle shows the movement of the myocardium, contracting and expanding as the heart repeats the systolic cycle. In acquiring a short axis sonograph of the heart, the ultrasonic sound wave must traverse between the ribs. The highly reflective nature of the ribs in close proximity to the low level backscatter from distal blood can cause enhancement, reverberation and/or multi-path artifacts to appear within the region of interest that is over or near the myocardium. The presence of these artifacts can obscure parts of the myocardium and makes determining its motions and borders problematic. These problems are illustrated in Fig. 1 where three typical in vivo short axis B mode ultrasound images of a human heart are shown at various stages during the systolic cycle. The dynamics of the heart chambers and valves, enhancement, reverberation, and multi-path artifacts are greatly more obvious when viewing this data as a B mode movie where the artifacts are easily recognized as objects that do not move or only move very slightly and it is evident that the reverberation and multi-path artifacts are misplaced objects. Since showing every frame of even a short movie would be an inefficient use of space, only three frames of the human heart at various times during the systolic cycle are shown in Fig. 1 with some reverberation and multi-path artifacts highlighted with red “A”s. The approximate location of the ribs are marked by a red “Ribs”. The transducer is located on the top of the image and the blood filled heart cavities are located below the ribs (distal to the ribs with reference to the transducer). Some of the bright objects scattered through out each image in Fig. 1 are enhancement artifacts due to muscle/tissue-blood interface and are not specifically labeled.
Fig. 1.

An in vivo human heart at various times during the systolic cycle. Artifacts are labeled with red “A”s and are stationary or only move slightly.
It is necessary to remove or at least reduce these artifacts. Removal or reduction of artifacts would reveal the underlying muscle(s)/tissue(s), which are obscured by these artifacts, to attain better images in which to assess the health of the myocardium, valves, or other cardiac muscle(s)/tissue(s). This would potentially enable a physician to better assess its health. The necessity of a robust method to reduce artifacts is emphasized by various techniques that have been proposed. Bylund et al. in [3] proposes removal of user specified reverberation artifacts by applying a conjointly well localized least squares optimized Wiener filter to the 3D (2D plus time) IQ data. Kling et al. in [4] proposes reverberation reduction by using a dual frequency subtraction technique. Artifact reduction via spatial compounding [5], [6], that is averaging independent images acquired from scans at different positions or angles, is used by the commercially available Philips SonoCT advance technology ultrasound system. These three approaches suffer the following problems. Although Wiener filtering is easily implement in software, it can amplify noise and introduce imaging artifacts like ringing. Dual frequency ultrasound require specialized hardware, which is beyond the capability of most ultrasound systems. Spatial compounding can degrade images by blurring and decrease resolution. Our propose method can be implemented in software, does not degrade the ultrasound image, and does not introduce imaging artifacts.
This paper is organized in the following fashion. In section II the motivation for the use of a specialize discrete wavelet transform to perform the required subband decomposition is provided along with an overview of soft and hard wavelet thresholding and the preference of soft thresholding using Donoho’s threshold [7] to achieve minimum mean squared error and minimum of maximum error optimality. In section III the signal model offered by Bjaerum and Torp [8] is adopted and a novel artifact reduction method is proposed. In section IV, quantitative and qualitative results using Field II [9] simulated images are provided. Also, a qualitative evaluation is given for in vivo ultrasound images of a human and a mouse heart. In section V our conclusion is stated.
II. Background and Motivation for the Use of Various Methods
A. The Discrete Wavelet Transform
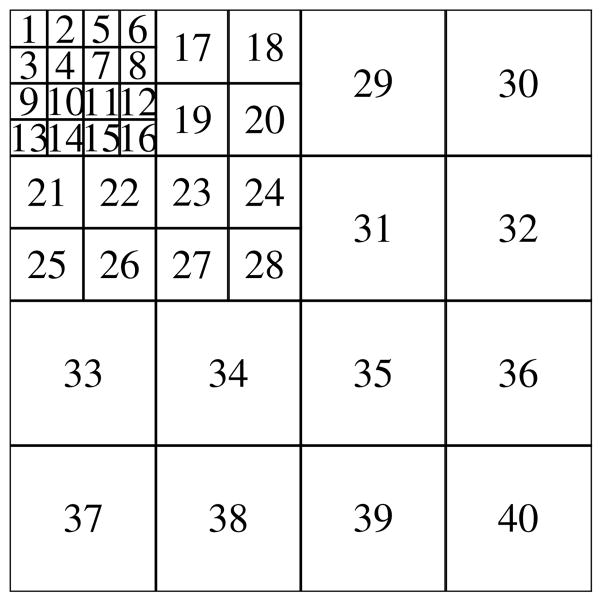
Mallat’s multiresolution wavelet transform [10] is a separable two dimensional (2D) subband decomposition of an image that allows perfect reconstruction. Although our proposed artifact reduction method strives to remove certain components of the original image, perfect reconstruction is still preferred since no visual information loss due to the transform is guaranteed. Our filter bank construction is motivated by the work of Havlicek and Bovik in [11]. The physio-psychological experimental evidence referenced in [11] suggests that biological vision systems are well represented by conjointly well spatial and frequency localized bank of Gabor filters where the number of channels is in the forties. Another key characterization of their Gabor filter bank construction is that the magnitude response of the filters becomes wider and their magnitudes decrease as the center horizontal and/or vertical frequencies increase. With these characterizations in mind we emulate the filter bank of Havlicek and Bovik used in [11] with a 2D forty channel well conjointly localized perfect reconstruction discrete wavelet transform (DWT) filter bank. The forty channel 2D DWT decomposition is shown in Fig. 2. The evidence provided by Tay in [12] shows that the multi-level DWT filter bank is conjointly well localized when the Coifman quadrature mirror filter bank (Coiflet), which maximizes the number vanishing moment for a given support width [13], is used.
Fig. 2.
Channels of the four level DWT filterbank used in the proposed algorithm.
B. Hard and Soft Thresholding Methods
For signals corrupted by additive white Gaussian noise such as in equation (1), a typical denoising method to recover the noise free signal x(n) is to apply a hard or soft thresholding operator to the DWT coefficients. These methods are commonly referred to as wavelet shrinkage. The hard and soft thresholding operation are given in equations (2) and (3), resp. where w = DWT{y} and for some λhard, λsoft > 0
| (1) |
The noise free signal is reconstructed from the threshold wavelet coefficients ŷ = IDWT{w̃} ≈ x where IDWT{·} means inverse DWT (IDWT).
| (2) |
| (3) |
The robustness of the wavelet shrinkage method is dependent on the choice of threshold(s). Some various methods and criteria to consider in choosing a global or level dependent hard or soft threshold(s) based on a priori known or estimated noise statistics, signal length, mean squared error, and smoothness are described in [7]. In [7], [14], and [15], the wavelet shrinkage denoising of the signal y(n) using hard or soft thresholding of the DWT coefficient with a global soft threshold value
| (4) |
or some variant of this threshold where σ is the standard deviation of the noise and N is length of the signal, is shown to be optimal or near optimal in the sense that the mean squared error is minimized (MMSE) or the maximum of the mean squared error is minimized (minimax). Additionally Donoho [14] claims that the reconstructed signal of the soft threshold wavelet shrinkage method is nearly as smooth as the original signal where the smoothness of the reconstructed signal was determined from a “wide range” of smoothness metric.
As a stringent motivation in our ultrasound artifact removal algorithm, we desire mean squared error optimality or at least near optimality in the sense of MMSE or minimax. To prevent processing artifacts such as unwarranted oscillations (ringing) or discontinuities, we adhere to the constraint that the reconstructed signal/image should be equivalently as smoothness as the original signal/image. We will take advantage of the work accomplished in [7], [14], and [15] by using the soft threshold wavelet shrinkage method with the threshold value similarly defined as in equation (4) in our proposed algorithm.
III. The Artifact Reduction Method
Bjaerum and Torp [8] relied on an additive model to remove clutter from the complex demodulated Doppler signal. Clutter in the context of their paper are objects that do not move or move slowly. The clutter would skew the velocity estimate of the blood. An accurate estimation of blood velocities necessitated the removal of these stationary or slow moving objects. In our application of artifact removal or reduction, we require the artifact reflectivity values to be replaced with the reflectivity values of the obscured tissue or muscle. In modeling the acquired real valued digital RF data, we adopted a similar additive model. The model of the RF reflectivity data that is acquired at the transducer, we model as the sum of three components
| (5) |
where A(n, m) is the real value reflectivity due to the artifacts, T(n, m) is the reflectivity value due to the underlying muscle(s)/tissue(s) obscured by A(n, m). The real valued noise component η(n, m) is assumed to be white, zero mean and Gaussian distributed. It is safe to assume that the reflectivity values due to the artifacts and the reflectivity values due to the underlying muscle(s)/tissue(s) are independent in the statistical sense.
The images displayed on the monitors of most ultrasound systems are known as B (brightness) mode images. The data flow of the Siemens Sequoia ultrasound system we use to acquire data is shown in Fig. 3. The RF data is the digitized return echoes captured by the receiver. The IQ data is the analytic representation of the RF data. After logarithmically compressing the envelop, i.e. magnitude of the IQ data, to some user defined dynamic range (dB), the data is contrast stretched to eight bits per pixel and display as the B mode image.
Fig. 3.
RF data to B mode image.
The process to convert RF data to IQ data, which include the beamforming process and other processes applied to the RF data post analog to digital conversion, is generally proprietary and indicated by the “Prop.” box in Fig. 3. The conversion process from RF to B mode varies with different ultrasound manufacturers. Some systems such as some Philips systems bypass the computation of the intermediate IQ data. In gist, the process begins with the real-valued RF data, which is the digitized filtered signal(s) acquired at the transducer. Subsequently, some beamforming algorithm is usually applied to the digitized real-valued RF data. The data is demodulated and axially downsampled to produce a base band complex-valued analytic signal, which is referred to as IQ data. From the viewpoint of communication theory and in an ideal situation, the information content of the IQ data is as robust as the RF data. The B mode data is the logarithmically compressed norm (envelop) of the interpolated, smoothed, and normalized IQ data within some dynamic range. The in vivo images shown in this paper uses a 50 dB dynamic range of the envelop.
Although the B mode data is used to produce a visually meaningful image for medical diagnosis, processing the RF data is better suited for our current application of removing various types artifacts. It is more advantageous to process the RF reflectivity data instead of the B mode data for the following reasons:
The reflectivity values of the RF data encompass a greater dynamic range than the B mode data. Thus, samples that are affected by artifacts are greater in absolute value and more easily distinguishable.
The axial sampling rate of RF data is generally higher than the B mode sampling rate. Thus, the axial resolution of the RF data is much finer (better) than that of the B mode data.
The signal to noise ratio (SNR) of the RF data is greater than the SNR of the B mode data where SNR is meant as the ratio of the power due to the underlying muscle/tissue reflectivity values T(n, m) and the power due to white noise η(n, m). The reduction in SNR of the B mode data is due mostly the axial downsampling and to the log compression, which is necessary to render a image that is within the dynamic range of human vision.
The optimal or near optimal requirements of the soft wavelet thresholding are that the reflectivity of the muscle or tissue components T̃(n, m) are Gaussian distributed.
From the additive model we propose in equation (5), if a sample is adversely affected by the artifact component, then the absolute value of the RF data of the artifact component is substantially greater than the absolute value of the muscle/tissue component, that is |A(n, m)| ≫ |T(n, m)|. An estimate of samples where artifacts are prominent can be determined by thresholding the absolute value of the RF data
| (6) |
for some predetemined λ > 0. In the experimental results provided in section IV this value is empirically determined. The estimated artifact dominated reflectivity values R̃ contains the reflectivity values of the underlying muscle and/or tissue, which are obscured by the artifact(s). To provide an estimate of the reflectivity values of the underlying muscle and/or tissue, we consider the reflectivity values of the underlying muscle or tissue T̃(n, m) of the estimated artifact dominated data R̃(n, m) as additive noise, that is
| (7) |
Applying a wavelet shrinkage algorithm to R̃ and consequently removing T̃ and η̃, we attain an estimate of the reflectivity values due only to the artifact Ã. More precisely, let W = DWT{R̃}, we apply a soft threshold operator to W
| (8) |
with threshold
| (9) |
where σ is the estimated standard deviation of T̃(n, m) + η̃(n, m) and NR̃ is the number samples where R̃(n; m) ≠ 0. We empirically set σ to be one third the standard deviation of R̃. An estimate of the artifacts in equation (7) is determine as
| (10) |
An artifact free image R̂ is attained by subtracting the estimated artifact values of equation (10) from the original RF data, that is
| (11) |
If the component T̃(n, m) + η̃(n, m) in the additive model given in equation (7) can be shown to be Gaussian distributed and independent, then using the soft threshold of equation (4), which is estimated in equations (9), would yield a MMSE and minimax optimal estimate of the artifact values Ã(n, m). The justification of T̃(n, m) + η̃(n, m) as a Gaussian distributed random variable relies on T̃(n, m) being a Gaussian random variable. We impose on the argument made by J. W. Goodman [16], [17], which is outlined in the appendix, to establish this optimality condition. The samples of the underlying tissue and noise T̃(n, m) + η̃(n, m) can only be assume to be uncorrelated when the white noise power is much greater than power due to the samples of the tissue T. Otherwise, correlation is obviously a function of spatial distance. Therefore, MMSE and minimax optimally as describe by Donoho et al. in [7], [14], and [15] is not claimed by our method. Nevertheless, we will use the MMSE and minimax optimal threshold prescribed by Donoho et al. and given in equation (9) as a reference to assess the robustness of our proposed artifact reduction algorithm. Admittingly, our method could be improve by choosing a more rigously tested soft threshold, which is specific to the ultrasound system, object(s) being imaged, and application(s). Also, a short fall of our proposed artifact reduction method is that bright objects that are not artifacts will be diminished using this proposed method.
IV. Results
A. Field II Simulations
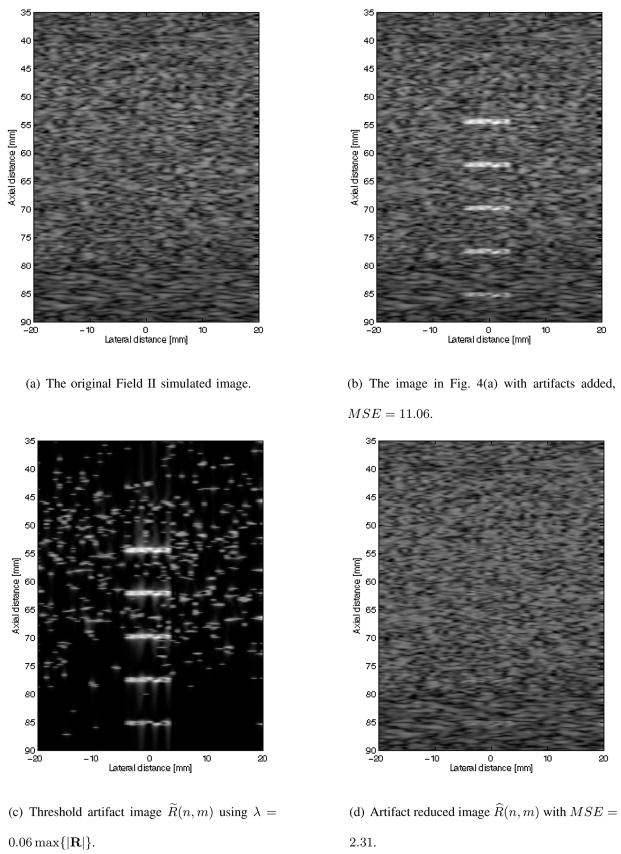
In Figs. 4 and 5 are B mode images of Field II simulated datasets and the results of the proposed artifact reducing algorithm on these two datasets. The data shown in Fig. 4(a) simulates artifact free homogeneous tissue. Fig. 4(b) show the B mode image of the data in Fig. 4(a) with five artifacts added. The mean squared error (MSE) defined in equation (12) of the B mode image in Fig. 4(a) with the artifact free B mode image in Fig. 4(a) is 11.06.
Fig. 4.
B mode of original Field II simulated image, simulated image with artifacts, isolated artifacts, and the artifact reduced images.
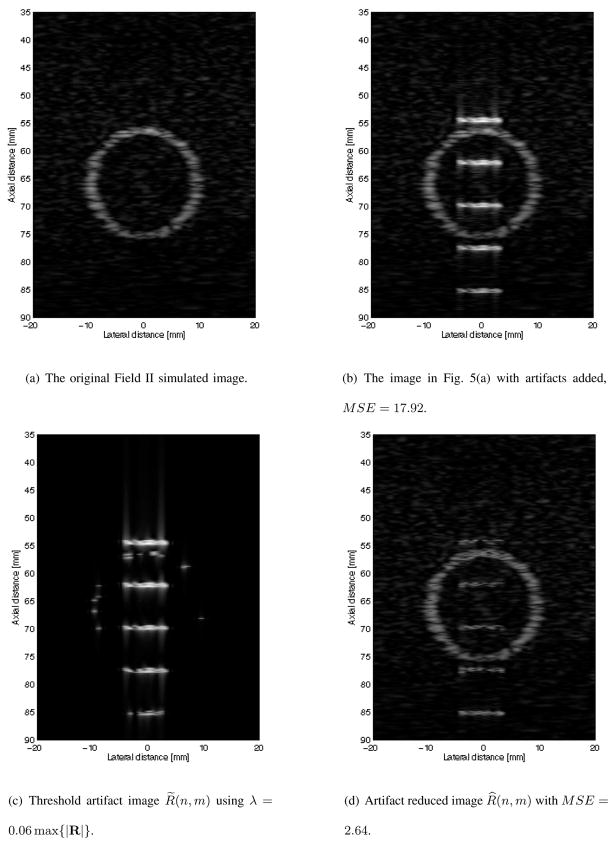
Fig. 5.
B mode of original Field II simulated image, simulated image with artifacts, isolated artifacts, and the artifact reduced images.
| (12) |
Empirically choosing λ in equation (6) to be equal to six percent of the maximum of the absolute value of the RF data, the artifacts are isolated to produce R̃. The B mode image of the isolated artifacts are shown in Fig. 4(c). The resulting B mode image of the proposed artifact reducing algorithm using a soft threshold set as defined in equation (9) is shown in Fig. 4(d). It is observed that the five artifacts are hardly noticeable in Fig. 4(d). The MSE of the resulting B mode image shown in Fig. 4(d) with the artifact free B mode image in Fig. 4(a) is 2.31. This is a substantial reduction in error when compared with the MSE of the B mode artifact image shown in Fig. 4(b).
This same experiment was conducted with a more complicated Field II simulated data. The artifact free B mode image of this data is shown in Fig. 5(a) and consist of a bright ring with a dark background. The B mode image with artifacts added is shown in Fig. 5(b). The MSE of the artifact added B mode image of Fig. 5(b) with the artifact free B mode image shown in Fig. 5(a) is 17.92. The artifacts are isolated as before by setting λ = 0.06 max {|R(n, m)|: ∀(n, m)}, which was determined by experimentations with a wide range of values, to get R̃ where the B mode image is shown in Fig. 5(c). The resulting B mode image of our proposed algorithm is shown in Fig. 5(d). The visual result of Fig. 5(d) are not as dramatic as in Fig. 4(d), in which remnants of all five artifacts are clearly visible. Nonetheless, the MSE is again significantly reduced to 2.64, providing strong evidence that our proposed algorithm is robust in reducing artifacts while preserving the artifact free data.
B. In Vivo Mouse and Human Hearts
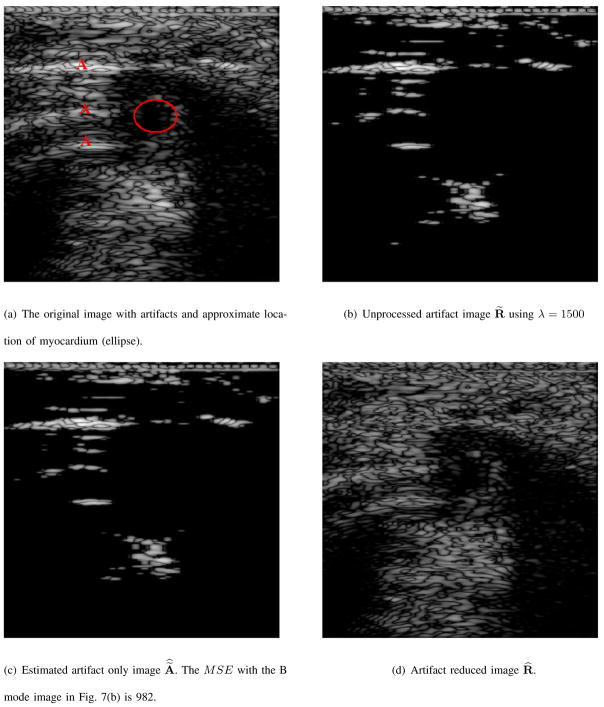
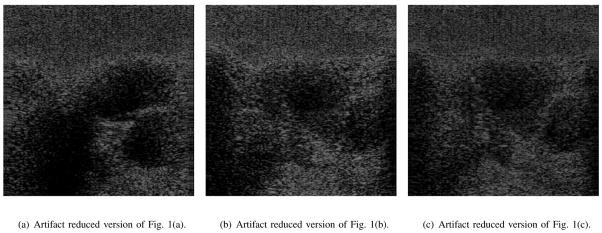
In Figs. 6, 7, and 8 the resulting B mode images due to the proposed artifact reduction algorithm are shown. The images shown in Fig. 6(d), 7(d), 8(a), 8(b), and 8(c) are displayed in the same 50 dB dynamic range as Figs. 6(a), 7(a), 1(a), 1(b) and 1(c), resp., so that an accurate representation of our results can be displayed. Although our processing is performed on the RF data, our end result is to improve the quality of the B mode image and we use this mode to display our results.
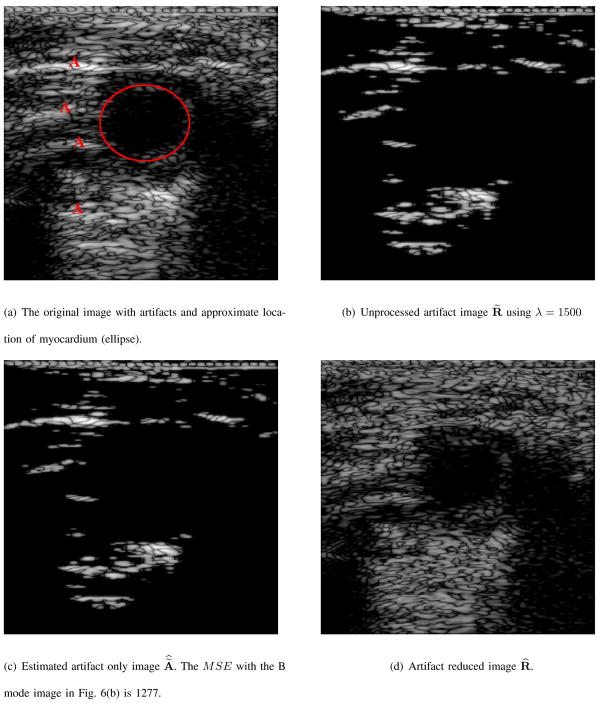
Fig. 6.
B mode version of actual ultrasound image, artifact, estimate of artifact only, and artifact reduced images.
Fig. 7.
B mode version of actual ultrasound image, artifact, estimate of artifact only, and artifact reduced images.
Fig. 8.
B mode images of artifact reduced images using λ = 2000. The artifact laden B mode original images are shown in Fig. 1.
The B mode image in Figs. 6(a), and 7(a) are images of short axis views of a mouse heart. The red capital “A” in these B mode images signifies the presence of an artifact and the red ellipse represents the approximate location of the muscle/tissue of interest. In Fig. 6(b), and 7(b) are the B mode images denoted as R̃(n, m) and defined in equation (6) using λ = 1500 in each of the two mouse heart examples. These images contain both prominent artifacts and obscured muscle(s)/tissue(s). The B mode images of the estimated artifact only reflectivity values of equation (10) are shown in Figs. 6(c), and 7(c). The images in Figs. 6(c), and 7(c) contain objects and features of Figs. 6(b) and 7(b), which are subtly and smoothly diminished, resp. Although shown in the same 50 dB dynamic range and same pixel scale values, the B mode images in Figs. 6(c) and 7(c) are visibly indistinguishable from the B mode images in Figs. 6(b) and 7(b), resp. The MSE as defined in equation (12) of the B mode image in Fig. 6(c) and the B mode image in Fig. 6(b) is 1277. The MSE of Fig. 7(c) and Fig. 7(b) is 982. Therefore, there is a substantial difference between the images of Figs. 6(c) and 6(b) and likewise with the images in Figs. 7(c) and 7(b).
The valves and chambers of the heart continuously undergo various state and shape changes to direct the flow of blood through the heart. The B mode images in Figs. 1(a), 1(b), and 1(c) show various human heart valves and chambers at different stages during the systolic cycle. Since blood reflects sound less than that of cardiac tissues, the appearance of blood is shown darker than that of the surrounding tissue(s). In Figs. 1(a), 1(b) and 1(c) the red “A”s indicate artifacts. These are reverberation and multi-path artifacts. They are more evident when viewing the data as B mode movies in which areas marked with red “A”s do not move or only move slightly. Consequently, these artifacts seem like misplaced objects. The bright enhancement artifacts are seen in the area marked with “Ribs”. The images in Figs. 8(a), 8(b), and 8(a) are the results of applying the proposed artifact reducing filter to Figs. 1(a), 1(b), and 1(c), resp. So that the results are not skewed, all the images in Figs. 1 and 8 are shown in the same 50 dB dynamic range and pixel value scale. It is observed that the artifacts identified in Figs. 1(a), 1(b), and 1(c) are diminished in Figs. 8(a), 8(b), and 8(c), resp.. Additionally, the specular pattern of artifact reduced regions strongly resembles the specular pattern of regions, which are in close proximity and are not affected by artifacts.
A quantitative assessment of the subjective improvements produced by our proposed artifact reduction method to actual ultrasound images is difficult and not offered in this paper. Rather, we point out the qualitative improvements due a meticulous evaluation of the results presented. A qualitative evaluation of Figs. 6(d), 7(d), 8(a), 8(b), and 8(c) yields the following improvements and observations:
Reverberation and multi-path artifacts are removed.
The artifact regions have been replace by textures that are homogeneous with textures from neighboring regions that were not adversely affected by these artifacts.
Artifact free regions are not diminished by our proposed algorithm.
No processing artifacts are visibly evident.
Objects of interest are not visually morphed, warped, skewed, or disfigured.
V. Conclusion
Enhancement, reverberation, and multi-path reflection artifacts are expected when ultrasonic sound waves are required to traverse through or around highly reflective objects such as bones or other various highly reflective interfaces. We present a soft wavelet thresholding method to replace these artifacts with a near MMSE and near minimax optimal estimate of the underlying tissue(s), which were obscured by these artifacts. We describe the compelling reasons that justify why our processing is performed to the RF data. Using the resulting B mode data produced by the artifact removed/reduced RF data, we show that the regions adversely affected by artifacts are replaced with textures that are homogeneous with textures from surrounding regions not adversely affected by these artifacts. The experimental results presented show the robustness of the proposed artifact reduction algorithm. From the experiments with Field II simulated images and actual ultrasound images of an in vivo mouse heart and human heart, it was observed that our proposed artifact reduction algorithm decreased the MSE, preserved the fidelity of the artifact free regions, and avoided major processing artifacts like ringing and unwarranted discontinuities.
Supplementary Material
Acknowledgments
This work was supported by NIH NIBIB grant EB001826, RR0022582, and US Army CDMRP grant W81XWH-04-1-0240.
Appendix
We outline J. W. Goodman’s argument from [16] and [17] to establish that the isolated reflectivity values due to the underlying tissue T̃(n, m) of equation (7) are Gaussian distributed. Goodman claims that the naturally and normally occuring phenomena of speckle is due to the “random roughness” of the object being imaged with respect to the wavelength of the transmitted sound, light, or electro-magnetic wave. The speckle in the reflectivity values produced by these imaging systems is characterized as a sum of complex random phasors
| (13) |
where αi(n, m) and ϕi(n, m) are independent with respect to the variable i ∈ ℤ and with each other. The assumption of independence is in the sense that for fixed n, m, i ∈ ℤ, the conditional probability of αi(n, m) given ϕi(n, m) is equal to the of the probability of ai(n, m) and likewise for the conditional probability of ϕi(n, m) given ai(n, m) is equal to the probability of ϕi(n, m). Since the reflectivity values detected at the transducer are modeled as an infinite sum of independent variables, the Central Limit Theorem implies that these values α(n, m)ejϕ(n;m) are Gaussian distributed. We adhere to this argument except that the real-valued underlying tissue RF values are modeled as
Footnotes
The middle and thickest layer of the heart wall, composed of cardiac muscles [2].
Publisher's Disclaimer: This is a PDF file of an unedited manuscript that has been accepted for publication. As a service to our customers we are providing this early version of the manuscript. The manuscript will undergo copyediting, typesetting, and review of the resulting proof before it is published in its final citable form. Please note that during the production process errors may be discovered which could affect the content, and all legal disclaimers that apply to the journal pertain.
Contributor Information
Peter C. Tay, Email: ptay@email.wcu.edu, Dept. of Electrical and Computer Engineering Technology, Western Carolina University, Cullowhee, NC 28723 USA
Scott T. Acton, Email: acton@virginia.edu, Dept. of Electrical and Computer Engineering and the Dept. of Biomedical Engineering, University of Virginia, Charlottesville, VA 22904 USA
John A. Hossack, Email: hossack@virginia.edu, Dept. of Electrical and Computer Engineering and the Dept. of Biomedical Engineering, University of Virginia, Charlottesville, VA 22904 USA
References
- 1.Bushberg JT, Seibert JA, Leidholdt JEM, Boone JM. The Essential Physics of Medical Imaging. Baltimore: Williams and Wilkins; 1994. [Google Scholar]
- 2.Agnew LRC, Aviado DM, Brody JI, Burrows W, Butler RF, Combs CM, Gambill CM, Glasser O, Hine MK, Shelley WB, Daly LW, editors. Dorland’s Illustrated Medical Dictionary. 24. Philadelphia: W. B. Saunders company; 1965. [Google Scholar]
- 3.Bylund NE, Andersson M, Knutsson H. Interactive 3D filter design for ultrasound artifact reduction. Proc. IEEE Int’l. Conf. Image Proc; Genova, Italy. Sept. 11–14 2005; pp. 728–731. [Google Scholar]
- 4.Kling T, Shung KK, Thieme GA. Reverberation reduction in ultrasonic B-mode images via dual frequency image subtraction. IEEE Trans Med Imag. 1993 Dec;12(4):792–802. doi: 10.1109/42.251131. [DOI] [PubMed] [Google Scholar]
- 5.Abbott JG, Thurstone FL. Acoustic speckle: theory and experimental analysis. Ultrasonic Imaging. 1979;(1):303–324. doi: 10.1177/016173467900100402. [DOI] [PubMed] [Google Scholar]
- 6.Dahl JJ, Guenther DA, Trahey GE. Adaptive imaging and spatial compounding in the presence of aberration. IEEE Trans Ultrason, Ferroelect, Freq Contr. 2005 July;52(7):1131–1144. doi: 10.1109/tuffc.2005.1503999. [DOI] [PubMed] [Google Scholar]
- 7.Donoho D, Johnstone I. Threshold selection for wavelet shringkage of noisy data. Proc. 16th Annnual IEEE Int’l. Conf. Engineering Advances: New Opportunities for Biomedical Engineers; Nov. 3–6 1994; pp. A.24–A.25. [Google Scholar]
- 8.Bjaerum S, Torp H. Optimal adaptive clutter filtering in color flow imaging. Proc. IEEE Int’l. Ultrasonics Symp; Ontario, Canada. Oct. 5–8 1997; pp. 1223–1226. [Google Scholar]
- 9.Jensen JA, Svendsen NB. Calculation of pressure fields from arbitrarily shaped apodized and excited ultrasound transducers. IEEE Trans Ultrason, Ferroelect, Freq Contr. 1992 Feb;39(2):262–267. doi: 10.1109/58.139123. [DOI] [PubMed] [Google Scholar]
- 10.Mallat S. A theory for multiresolution signal decomposition: the wavelet representation. IEEE Trans Pattern Anal Machine Intell. 1989 July;11(7):674–693. [Google Scholar]
- 11.Havlicek JP, Bovik AC. Image modulation models. In: Bovik A, editor. Handbook of Image and Video Processing. San Diego: Academic Press; 2000. pp. 313–324. [Google Scholar]
- 12.Tay PC. PhD dissertation. University of Oklahoma; 2003. An optimally well localized multi-channel parallel perfect reconstruction filter bank. [Google Scholar]
- 13.Meyer Y. Wavelets and Operators. New York, NY: Cambridge University Press; 1992. [Google Scholar]
- 14.Donoho D. De-noising by soft-thresholding. IEEE Trans Inform Theory. 1995 May;41(3):613–627. [Google Scholar]
- 15.Krim H, Tucker D, Mallat S, Donoho D. On denoising and best signal representation. IEEE Trans Inform Theory. 1999 Nov;45(7):2225–2238. [Google Scholar]
- 16.Goodman JW. Statistical properties of laser speckle patterns. In: Dainty JC, editor. Laser Speckle and Related Phenomena. Berlin: Springer-Verlag; 1984. pp. 9–75. [Google Scholar]
- 17.Goodman JW. Speckle phenomena in optics: Theory and applications version 5.0. 2005 Aug; http://www-ee.stanford.edu/~goodman/
Associated Data
This section collects any data citations, data availability statements, or supplementary materials included in this article.


