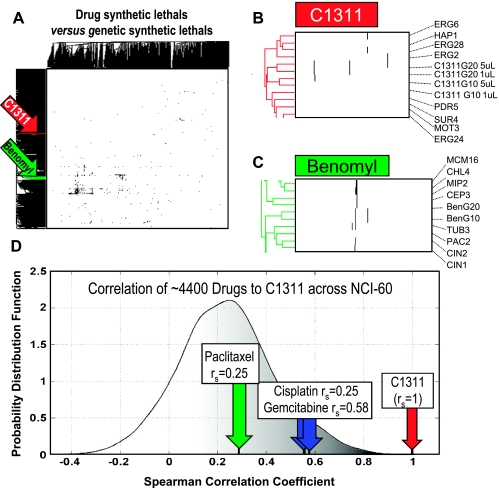
Figure 2.
Chemigenomic analysis of C1311 and paclitaxel between yeast and human cells. (A) Two-way hierarchical cluster of a 1521 x 2804 binary matrix where a black pixel represents either a synthetic lethal interaction between two yeast ORFs or reduced fitness between a drug and a yeast deletion mutant, or a white pixel represents all other two-ORF or drug-ORF pairs. We highlight the C1311 (red) and benomyl (green) clusters. (B) We see that C1311 is in a relatively sparse area of the matrix, and the four treatments with C1311 (two concentrations after 10 or 20 generations of competitive growth) cluster immediately next to each other and among several deletion strains involved with membrane lipid biogenesis, implicating this pathway in the function of C1311. (C) Enlarged inset view of the benomyl cluster from (A) showing benomyl treatments for 10 and 20 generations and neighboring deletion strains, enriched for microtubule and spindle components, as would be expected for this microtubule poison. (D) IC50 patterns across 60 cell lines for ∼4400 drugs from the 60 cell lines of NCI-60 screen [20] were correlated to that of C1311 and the probability distribution function of the coefficients was plotted. Paclitaxel, cisplatin, and gemcitabine exhibited the indicated correlation coefficients.

