Abstract
It is generally accepted that K+ uptake into guard cells via inward-rectifying K+ channels is required for stomatal opening. To test whether the guard cell K+ channel KAT1 is essential for stomatal opening, a knockout mutant, KAT1∷En-1, was isolated from an En-1 mutagenized Arabidopsis thaliana population. Stomatal action and K+ uptake, however, were not impaired in KAT1-deficient plants. Reverse transcription–PCR experiments with isolated guard cell protoplasts showed that in addition to KAT1, the K+ channels AKT1, AKT2/3, AtKC1, and KAT2 were expressed in this cell type. In impalement measurements, intact guard cells exhibited inward-rectifying K+ currents across the plasma membrane of both wild-type and KAT1∷En-1 plants. This study demonstrates that multiple K+ channel transcripts exist in guard cells and that KAT1 is not essential for stomatal action.
Guard cells represent the best characterized plant cell type with respect to ion transport and signal transduction. Opening of stomata in response to various stimuli such as light, low CO2 concentrations, or the phytohormone auxin is supposed to require K+ uptake through inward-rectifying K+ channels in the plasma membrane (1–8). Likewise, stomatal closure caused by the wilting hormone abscisic acid (ABA), or high CO2, is suggested to involve signal cascades that down-regulate the K+ inward-rectifier and promote ion efflux (9–13). Even though the inward-rectifying K+ channel KAT1 has been cloned (14), characterized in oocytes (15–18), and shown to express in guard cells (19), its impact for the functional K+ channel in the plasma membrane of guard cells is still unknown (20). To analyze the physiological role of the KAT1 channel in planta, we have isolated a mutant in the KAT1 gene by using transposon mutagenesis (21). We show that disruption of the KAT1 gene does not affect stomatal opening, although underlying potassium currents were altered.
Materials and Methods
Arabidopsis thaliana wild-type and KAT1∷En-1 plants were grown in a growth chamber or in the greenhouse under a dark/light regime of 16:8 h. Plants with fully developed leaves were used (growth period 5–8 weeks).
Reverse Genetic Screening and Reverse Transcription (RT)-PCR Experiments.
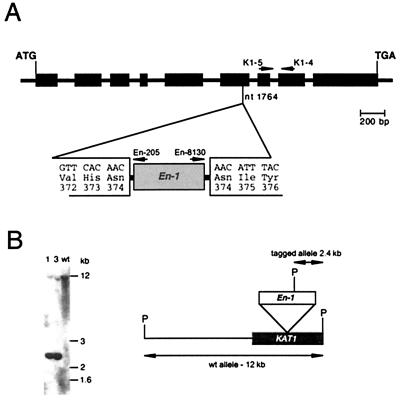
For functional analysis of the KAT1 gene, we screened for a knockout mutant in a collection of Arabidopsis plants mutagenized by the maize transposon En-1 (21). In a reverse genetic approach (22) employing a combination of KAT1- and En-1-specific PCR-primers, we identified the mutant KAT1∷En-1 7AAD31 (Fig. 1A). KAT1-primers were K1–5 (5′-TAG ACG CTG AGT ATT TCC CAC CAA A-3′) and K1–4 (5′-TCC ATC AAC GTA GAC AGT GAA GTC C-3′). En-1-specific primers were En-205 (5′-AGA AGC ACG ACG GCT GTA GAA TAG GA-3′) and En-8130 (5′-GAG CGT CGG TCC CCA CAC TTC TAT AC-3′). For RT-PCR experiments, guard cell protoplasts were isolated as described below and mRNA was purified twice with the Dynabeads mRNA Direct kit (Dynal, Oslo) to minimize DNA contaminations. First strand cDNA was prepared by using Superscript RT (GIBCO/BRL) and diluted for RT-PCR 20-fold in water. PCR was performed in a LightCycler (ROCHE) with the LightCycler-FastStart DNA Master SYBR Green I Kit (ROCHE). The following K+ channel-specific primers were used: KAT1fwd (5′-ACT TCC GAC ACT GC-3′), KAT1rev (5′-CCC AAA TGA CAT CTA A-3′), KAT2fwd (5′-ATA TTG ATA TGG GGT CA-3′), KAT2rev (5′-ATC TAT TTC TGC GTT TT-3′), AKT1fwd (5′-CCA ACT GTT GCG TAT-3′), AKT1rev (5′-CTG CGT GGT ACT CC-3′), AKT2/3fwd (5′-AAA ATG GCG AAA ACA C-3′), AKT2/3rev (5′-CGC TGC TTC ACA TAG AA-3′), AKT5fwd (5′-AGG CCA CAG TTG TTC-3′), AKT5rev (5′-CGC CAT TTT CTG ATA A-3′), AKT6fwd (5′-GCC AGT GCG GTT AC-3′), AKT6rev (5′-GAC TCA ATC GCT TGG TA-3′), AtKC1fwd (5′-ATA TTG CGA TAC ACA AG-3′), AtKC1rev (5′-GAC CTA ACT TCG CTA AT-3′), GORKfwd (5′-CCT CCT TTA ATT TAG AAG-3′), GORKrev(5′-GCT CCA TCC GAT AG-3′), SKORfwd (5′-TGA CCC GAA TAA GAC AG-3′), and SKORrev (5′-TGT GTT TCC CCA TCT G-3′). The GenBank accession numbers are as follows: KAT1 (X93022), KAT2 (CAA16801), AKT1 (X62907), AKT2/3 (U40154/U44745) AKT5 (AJ249479), AKT6 (AC006053), AtKC1 (U81239), AtGORK (AJ279009), SKOR (AJ223358), and Arabidopsis actins (cf. ref. 23). cDNA quantities were calculated by using lightcycler 3.1 (ROCHE). All quantifications were normalized to actin cDNA fragments amplified by ACTfwd (5′-GGT GAT GGT GTG TCT-3′) and ACTrev (5′-ACT GAG CAC AAT GTT AC-3′). To enable detection of contaminating genomic DNA, the primers for KAT2, AKT1, AKT2/3, AKT5, AKT6, and GORK were selected to flank up to three introns. All kits were used according to the manufacturer's protocols.
Figure 1.
Characterization of the plant line tagged by insertion of the En-1 in the KAT1 gene. (A) Position of the En-1 transposon insertion. The diagram depicts the genomic organization of the KAT1 gene (accession no. X93022) with introns (lines) and exons (black boxes). The nucleotide sequence (below) flanking both ends of the transposon insertion (gray box, designated En-1) in the plant line KAT1∷En-1 7AAD31 shows the duplication of codon 374 (AAC). Above, the positions of the KAT1-specific primers K1–4 and K1–5 are indicated. The directions of the En-1-specific primers En-205 and En-8130 are depicted above the En-1 box. (B) Southern blot analysis of KAT1∷En-1 plants. The Southern blot on the left side shows two representative F1 (1 and 3) and the wild-type (wt) plants, digested with PstI and hybridized with a probe specific to the 3′ region of KAT1. The transposon-tagged allele of KAT1 shows a signal of 2.4 kb, and somatic reversion events are visible as a faint band of the expected wild-type size (≈12 kb). On the right side, the KAT1 (black box) and the inserted En-1 (gray box) are shown and the relevant PstI sites (designated P) are indicated.
Patch-Clamp Experiments.
Guard cell protoplasts were isolated as described (24) with the enzyme solution adjusted to 560 mosmol kg−1 by using D-Sorbitol. Current measurements were performed by using an EPC-7 patch-clamp amplifier (HEKA, Lambrecht, Germany) and low-pass filtered with an eight-pole Bessel filter at a cutoff frequency of 2 kHz. Data were sampled at 5 kHz, digitized (ITC-16, Instrutech, Elmont, NY), stored on hard disk, and analyzed with pulse software (HEKA). Patch pipettes were prepared from Kimax-51 glass (Kimble, Vineland, NY) and coated with silicone (Sylgard 184 silicone elastomer kit, Dow Corning). To determine membrane potentials, the command voltages were corrected off-line for liquid junction potentials (25). The standard pipette solution (cytoplasm) contained 150 mM potassium gluconate, 2 mM MgCl2, 10 mM EGTA, 2 mM MgATP, and 10 mM Hepes/Tris (pH 7.4). Sealing solution contained 20 mM CaCl2 and 30 mM potassium gluconate (pH 5.6). The standard bathing medium was composed of 10 mM Mes/Tris (pH 5.6) in addition to 1 mM CaCl2 and 30 mM potassium gluconate. All solutions were adjusted to 560 mosmol kg−1 by using D-sorbitol. Chemicals were obtained from Sigma.
Impalement Measurements.
For the impalement of guard cells with microelectrodes (26), the abaxial epidermis was peeled and attached to a microscope slide by using Medical Adhesive (VM 355, Ulrich AG, St. Gallen, Switzerland). Opening of stomata was provoked by keeping the epidermal strips in the following solution: 50 mM KCl, 0.1 mM CaCl2, and 5 mM Mes/Bis-Tris propane (pH 6.5), which was aerated with CO2-free air and illuminated at a photon flux density of 250 μmol m−2 per s (halogen lamp Type 6423, Philips). Before impalement, the epidermal strips were transferred to the following bath solution: 50 mM KCl and 1 mM Ca(OH)2, buffered to pH 6.0 with Mes. Where indicated, the Ca2+ concentration was increased to 20 mM with CaCl2.
Guard cells were impaled on an upright microscope (Axioskop 2FS, Carl Zeiss), at an angle of 40°. Double barreled electrodes were pulled from borosilicate glass capillaries (GC100F-10, Clark Electromedical Instruments, Pangbourne, U.K.), two capillaries were aligned, heated, and twisted 360° on a customized electrode puller (L/M-3P-A, List Medical Electronic Darmstadt, Germany) and the tip was pulled on a laser puller (P-2000, Sutter Instument Co., Novato, CA). The electrodes were filled with 300 mM potassium acetate (pH 7.5) and had a tip resistance ranging from 100 to 240 MΩ.
The electrodes were connected via 300 mM KCl bridges and AgCl/Cl half cells to a double microelectrode amplifier (VF-102, Bio-Logic, Claix, France) equipped with headstages of 1011 Ω imput impedance. Voltage step protocols were applied via an ITC-16 interface (Instrutech Corp., Elmont, NY) under control of Pulse software (HEKA). The test voltages were fed into a differential amplifier (CA-100, Bio-Logic) connected to the VF-102 amplifier. The data were low pass filtered at 300 Hz with an 8-pole Bessel filter (type 902, Frequency Devices, Haverhill, MA) and sampled at 1 kHz.
Measurements of Apoplastic K+ Concentrations.
K+ concentrations were recorded by K+-sensitive microelectrodes as described (27). Briefly, the measuring electrode was inserted through a half-open stoma into the apoplastic cavity below. The voltage reference was positioned in a neighboring stoma. Both electrodes were connected to a high-impedance amplifier (FD 223; WP-Instruments, Sarasota, FL) that simultaneously measured and subtracted the signals coming from the K+ electrode and the voltage electrode. Single pipettes were pulled on a vertical puller (List Instruments, Darmstadt, Germany) and silanized internally by using a 0.2% tributylsilane/chloroform solution. After heat stabilization at 200°C for 1 h, the cooled pipettes were backfilled with the sensor mixture (Fluka, no. 60398) dissolved in a mixture of polyvinylchloride/tetrahydrofuran (40 mg/ml) at a ratio of 30:70 (vol/vol). After evaporation of the tetrahydrofuran, the remaining firm gel was topped with the undiluted sensor mixture followed by the reference solution, which consisted of 100 mM Mes/Tris mixed to pH 6 in 0.5 mM KCl.
Stomatal Assay.
Leaves were harvested at 8 a.m. from darkened plants. Epidermal strips were peeled off under dim red light, washed for 1 min in a solution without K+ (pH 4.5), and transferred to the test solutions containing 0.1 mM CaCl2 and 5 mM Mes/BTP (pH 5.6) and KCl at the desired concentration. Epidermal peels were kept either in the dark or light (400 μmol m−2 per s) for 3 h. To take stomatal images, the strips were pasted onto coverslips by using silicon glue, covered with the respective solution, and mounted on the microscope (Axiovert 100, Zeiss). The stomatal aperture was defined as the maximal width between the inner cuticular lips. No differences in the length of the stomatal complex were observed between wild-type and knockout plants. For each condition, >100 stomata were analyzed in three different plants.
Gas Exchange Measurements.
A section of the predarkened Arabidopsis leaf was enclosed in a sandwich-type cuvette (diameter 2.1 cm) with two windows on the upper and lower side. Gas flow through the cuvette was set to a constant rate of 0.5 liter min−1. Relative humidity was 40% and the temperature was 25°C. Transpiration rates were measured by infrared gas analysis technique by using the Binos instrument (Heraeus, Hanau, Germany). Experiments were started at 8 a.m.
Results and Discussion
Isolation of a KAT1 Transposon Insertion Mutant from Arabidopsis thaliana.
In a reverse genetic approach (22) employing a combination of KAT1- and En-1-specific PCR-primers, we identified the mutant KAT1∷En-1 7AAD31. Sequence analysis revealed that En-1 was inserted into the sixth exon of the KAT1 gene, thereby disrupting the ORF. This insertion caused a duplication of the nucleotides 1,764–1,766, which code for Asn374 (Fig. 1A). Southern blot analysis of six F1 plants revealed that the parental line 7AAD31 was homozygous for the En-1 insertion (data not shown). In the F1 plants, we observed a low degree of somatic reversion as indicated by a faint band on the Southern blot at the size of the KAT1 wild-type signal (≈12 kb, Fig. 1B). This signal constituted 12–17% of the overall signal, an amount frequently observed for somatic reversion of En-1 in Arabidopsis (28).
Stomatal Movement in KAT1∷En-1 Mutants Is Identical to That in Wild-Type Plants.
Wild-type and mutant plants were indistinguishable with respect to plant morphology, guard cell size (radius r = 4.1 ± 1.9 μm for the wild type and r = 4.2 ± 2.1 μm for KAT1∷En-1, calculated from the whole-cell capacitance of 18 and 16 guard cells, respectively), and number of chloroplasts per guard cell (8 ± 1, n = 14, for wild type and 8 ± 1, n = 16, for KAT1∷En-1). Furthermore, no significant differences between the photosynthetic capacity of guard cell chloroplasts from wild-type and KAT1∷En-1 plants could be detected in Microscopy-PAM chlorophyll fluorescence measurements (data not shown; ref. 29).
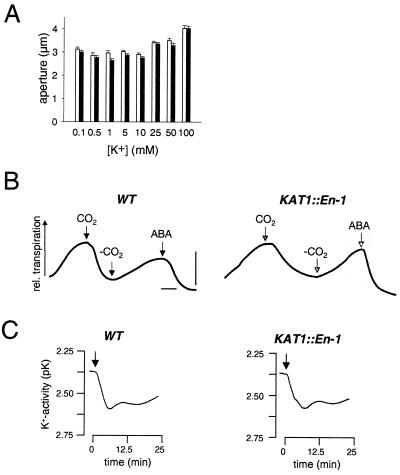
In search for the phenotype of a KAT1 insertion mutant, we measured the stomatal aperture in epidermal peels of predarkened wild-type and mutant plants in response to a 3-h light period. Stomatal opening assays were started at 8 a.m. because recent experiments demonstrated that in the morning stomatal opening is based on K+ uptake, whereas in the afternoon it is also driven by sugar accumulation (30, 31). Unexpectedly, light-dependent stomatal apertures of KAT1∷En-1 plants at different K+ concentrations were similar to those of wild-type plants (Fig. 2A). Even in the presence of 10 μM fusicoccin, a compound that hyperactivates the H+-ATPase and thereby induces stomatal opening (32), stomatal behavior of mutant and wild-type plants was indistinguishable (data not shown).
Figure 2.
Stomatal performance of wild-type and KAT1∷En-1 plants. (A) Light-induced stomatal opening from wild-type (open bars) and KAT1∷En-1 (filled bars) plants. Stomatal apertures were measured after a 3-h illumination period of epidermal peels incubated in concentrations of KCl as indicated. Mean values (± standard errors) are shown. (B) Stomatal movement in wild-type and KAT1∷En-1 leaves in response to CO2 and ABA. Leaves from predarkened plants were placed in a gas exchange chamber and superfused continuously with CO2-free air for stomatal opening. Application of either 340 ppm of CO2 or 100 μM ABA (arrows) induced stomatal closure, whereas removal of CO2 led to reopening of stomata (arrows). Transpiration rates are given in arbitrary units. Bars represent 20 min and 0.5 mmol m−2 per s, respectively. (C) Apoplastic changes in K+ activity (pK) during light-dependent stomatal opening of representative wild-type and KAT1∷En-1 plants. Following the dark-conditioning characterized by stable K+-activities the application of continuous white light (200 μmol m−2 per s) caused a decrease in the K+ activity (increase in pK) reaching a stable value after ≈20 min.
To verify that stomata in intact leaves behave similarly to those in isolated epidermal strips, we mounted Arabidopsis wild-type and mutant leaves into a gas exchange chamber. Using infrared gas analysis, we monitored changes in transpiration, a measure for stomatal movement (33). Predarkened wild-type and mutant plants opened their stomata in response to CO2-free air, but they closed upon increase of CO2 to 340 ppm (Fig. 2B). Feeding the wilting hormone ABA via the petiole to leaves from wild-type and knockout plants induced the rapid closure of preopened stomata. Using K+-selective electrodes, we tested whether stomatal opening in wild-type and knockout plants is accompanied by K+ changes in the apoplast. Following the light stimulus, the K+ concentration in the apoplastic cleft between the guard cells and their neighboring cells decreased from 3.97 ± 0.92 mM to 2.25 ± 0.94 mM (n = 7) in wild-type plants and from 4.55 ± 1.21 mM to 3.17 ± 1.12 mM (n = 11) in KAT1∷En-1 plants (Fig. 2C). These values corresponded to a decrease in apoplastic K+ concentration of 1.72 ± 0.08 mM K+ in the wild type compared with 1.38 ± 0.31 mM in KAT1∷En-1. These results show that K+ uptake into guard cells from KAT1∷En-1 is not impaired by the mutation and indicates that K+ uptake in the mutant is rescued by other K+ transporters.
Multiple K+ Channel Genes Are Transcribed in Guard Cells of Arabidopsis.
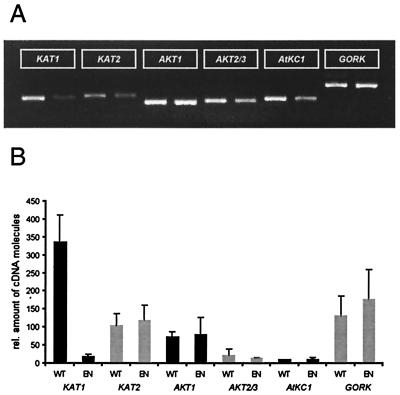
To identify other transcripts for K+ channels that could influence K+ uptake, we performed RT-PCR experiments on mRNA isolated from preparations of guard cell protoplasts of both wild-type and KAT1∷En1 plants. As expected for somatic reversion, we detected low levels of KAT1 mRNA in guard cell protoplasts from KAT1∷En-1 (≈6% of wild-type level, Fig. 3, cf. Fig. 1B). Using gene-specific primers in RT-PCR experiments, we probed for the presence of KAT1-related channel transcripts. Among them, KAT1 (15), KAT2 (34), and AKT1 (35) encode inward-rectifying, GORK (36) and SKOR (37) encode outward-rectifying, and AKT2/3 (38) encodes largely voltage-independent K+ channels. We analyzed the transcript levels of AtKC1, AKT5, and AKT6, channels that have not been functionally expressed yet. In addition to KAT1, we found KAT2, AKT1, AtKC1, AKT2/3, and GORK to be expressed in wild-type guard cells (Fig. 3). In contrast, AKT5, AKT6, and SKOR mRNA could not be detected. The finding that guard cells express multiple K+ channels is in line with staining of guard cells expressing GUS under the control of the individual promoters for KAT2 (34), AKT1 (39), AKT2/3 (40), or GORK (data not shown, cf. ref. 36). Despite the strong reduction in KAT1 transcripts, expression levels of the other K+ channel transcripts in mutant guard cells remained largely unaffected (Fig. 3B).
Figure 3.
Quantitative RT-PCR. (A) Gel electrophoresis of RT-PCR products of either wild-type (left lanes) or KAT1∷En-1 (right lanes) guard cell protoplast mRNA (positive signals only); representative of n = 3 experiments. Fragments were cloned and sequenced for verification. Notice that KAT1 transcripts are also detectable in the KAT1∷En-1. Fragment length are for KAT1 = 379 bp, KAT2 = 392 bp, AKT1 = 347 bp, AKT2/3 = 353 bp, AtKC1 = 373 bp, and AtGORK = 496 bp. (B) Quantification of K+ channel transcripts by external standards relative to actin in different guard cell protoplast preparations of wild-type (WT) and KAT1∷En-1 (EN; n = 3 ± SD). The figure shows the calculated amount of cDNA molecules in the individual probes. KAT1 expression in the KAT1∷En-1 compared with the wild type is about 6%.
Inward-Rectifying K+ Currents in Intact Guard Cells from Wild-Type and KAT1∷En-1 Plants.
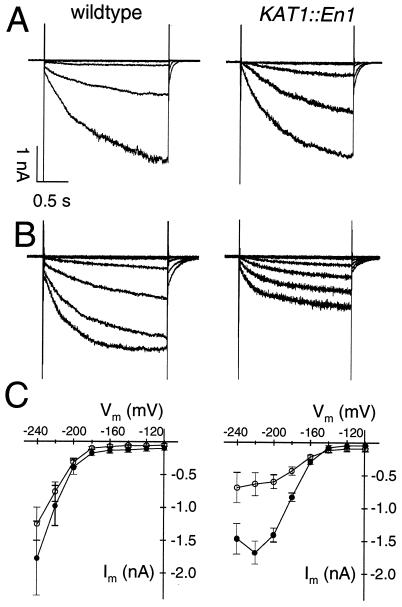
To compare the properties of the K+ inward rectifier between the wild type and mutant, we used two different approaches: impalement of double barreled microelectrodes into intact guard cells and patch-clamp analysis on enzymatically isolated guard cell protoplasts. Upon hyperpolarization of guard cells impaled by microelectrodes, time- and voltage-dependent inward K+ currents were elicited in both wild-type and mutant plants (Fig. 4A). At 1 mM extracellular Ca2+, K+ current amplitudes were not significantly smaller in KAT1∷En-1 compared with wild type (Fig. 4C). In the presence of 20 mM Ca2+, however, a pronounced difference in current amplitudes between wild type and mutant plants appeared (Fig. 4 B and C). The decrease of K+ currents at strong hyperpolarization results from a voltage-dependent Ca2+ block, characteristic for the guard cell inward rectifier (41–43). Apparently, K+ channels in the KAT1∷En-1 exhibit a higher Ca2+ sensitivity compared with wild type. When heterologously expressed, KAT1 (42), KAT2 (our own observations), and AKT1 (A. Bertl, personal communication) are Ca2+-insensitive. Because AKT2/3 represents the only Arabidopsis K+ channel known to be susceptible to block by Ca2+ ions (38), this channel could possibly account for the Ca2+-sensitive component of the guard cell inward rectifier. The pronounced Ca2+ sensitivity of mutant guard cells compared with wild type therefore may result from a relative increase in AKT2/3 channels with respect to the entire K+ channel pool.
Figure 4.
Inward-rectifying K+ currents in intact guard cells from wild-type and KAT1 knockout plants. (A) Hyperpolarization-induced K+ currents in the presence of 1 mM Ca2+ and 50 mM K+ in guard cells from wild-type (Left) and KAT1∷En-1 (Right). Cells were clamped from a holding potential of −100 mV to test pulses ranging from −100 mV to −220 mV in 20-mV decrements. (B) Activation of K+ channels in wild-type (Left) and KAT1∷En-1 (Right) using the pulse protocol as in A. Currents were recorded in the presence of 20 mM Ca2+ and 50 mM K+. (C) Steady-state current-voltage relation of K+ currents in wild type (filled symbols) and KAT1∷En-1 (open symbols) in the presence of 1 mM (Left) and 20 mM Ca2+ (Right). Data points represent mean values ± SEM, n = 8 (wild type, 1 mM Ca2+), 7 (KAT1∷En-1, 1 mM Ca2+), and 6 (wild type and KAT1∷En-1, 20 mM Ca2+). Note the higher Ca2+ sensitivity of inward K+ channels in KAT1∷En-1 compared with the wild type. Inward K+ currents were observed in 20 out of 32 (wild type) and 21 out of 44 measurements (KAT1∷En-1).
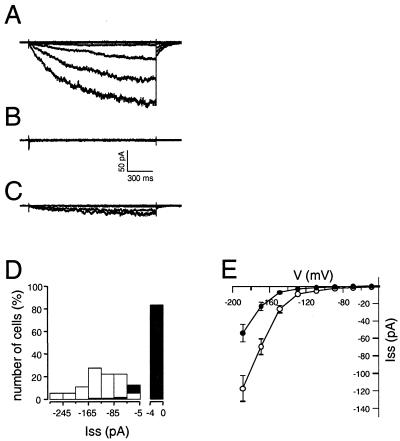
In line with the impalement studies, patch-clamp experiments on guard cell protoplasts from Arabidopsis wild-type plants revealed the presence of inward-rectifying K+ currents (Fig. 5A) (20, 42, 44, 45). In contrast, however, the major fraction of KAT1∷En-1 protoplasts (79%) lacked this K+ conductance (Fig. 5 B and D). In the remaining 21% of cells, hyperpolarization elicited time-dependent inward K+ currents of reduced amplitude (Fig. 5 C and E). Based on their voltage-dependence (Fig. 5E), these residual currents largely resembled those of the guard cell inward rectifier observed in wild-type Arabidopsis. The strong reduction in K+ currents of mutant guard cell protoplasts compared with wild-type cells correlates with the decrease of KAT1 mRNA levels. This coincidence indicates that KAT1 represents the dominant inward K+ channel recorded in patch-clamp measurements on enzymatically isolated guard cell protoplasts. In intact guard cells, however, qualitative rather than quantitative differences between the mutant and wild type were observed. The differences in K+ currents between intact guard cells and protoplasts may reflect, for example, alterations in signaling chains induced by elicitors released by cell wall degradation or changes in the turgor.
Figure 5.
K+ channel activities of guard cell protoplasts from wild-type and KAT1∷En-1 plants. (A) Wild-type inward K+ currents in the whole-cell configuration of the patch-clamp technique upon hyperpolarization of the guard cell plasma membrane. Test pulses to voltages between −9 and −189 mV were applied in 20-mV decrements starting from a holding potential of −49 mV. Absence (B) or reduction (C) of inward K+ currents in response to the same voltage protocol as used in A in two different guard cell protoplasts from KAT1∷En-1 mutants. The bath contained 30 mM K+ and 1 mM Ca2+ (pH 5.6). (D) Histogram of steady-state K+ current (Iss) amplitudes at −189 mV of 18 cells from wild type (open bars) and 95 cells from KAT1∷En-1 plants (filled bars). (E) Steady-state current-voltage relations for K+ channels from wild-type (open circles, ± SEM, n = 18) and KAT∷En-1 (filled circles, ± SEM, n = 16) plants.
The presence of KAT2, AKT1, AtKC1, and AKT2/3 transcripts in guard cells together with the K+ current fingerprint of KAT1 knockout plants documents that multiple K+ channels coexpress in this cell type. We thus conclude that inward-rectifying K+ currents in wild-type Arabidopsis guard cells are not based just on KAT1 homomers. K+ currents observed in KAT1∷En-1 may therefore be mediated by Ca2+-insensitive K+ channels (e.g., AKT1, KAT2) and Ca2+-sensitive (AKT2/3) K+ channels. Whether the different channels form homo- or heteromeric K+ channels is under current investigation (46, 47). In conclusion, we predict that in the absence of KAT1 guard cell K+ channel homeostasis guarantees stomatal function.
Acknowledgments
We are grateful to Petra Spoormaker for help and support during the early stage of the project. We also thank Michaela Lehnen, Petra Tänzler, and Spidola Neimanis for excellent technical assistance as well as Susanne Michel and the ADIS group for sequence analysis. We are also grateful to Chang-Hyo Goh for chlorophyll fluorescence measurements. This work was funded by the European Community's BIOTECH and INCO-Copernicus programs and the Deutsche Forschungsgemeinschaft to R.H. and K.P.
Abbreviations
- ABA
abscisic acid
- RT
reverse transcription
References
- 1.Assmann S M, Haubrick L L. Curr Opin Cell Biol. 1996;8:458–467. doi: 10.1016/s0955-0674(96)80021-4. [DOI] [PubMed] [Google Scholar]
- 2.Hedrich R, Hoth S, Becker D, Dreyer I, Dietrich P. In: NATO ASI Series. Lo Schiavo F, Last R L, Morelli G, Reikhel N V, editors. H 104. Berlin: Springer; 1998. pp. 35–45. [Google Scholar]
- 3.MacRobbie E A C. Philos Trans R Soc London B Biol Sci. 1998;353:1475–1488. doi: 10.1098/rstb.1998.0303. [DOI] [PMC free article] [PubMed] [Google Scholar]
- 4.Thiel G, Wolf A H. Trends Plant Sci. 1997;2:339–345. [Google Scholar]
- 5.Ward J M, Schroeder J I. In: Molecular and Cell Biology Updates: Signal Transduction in Plants. Aducci P, editor. Boston: Birkhauser; 1997. pp. 1–22. [Google Scholar]
- 6.Willmer C, Fricker M. Stomata. London: Chapman and Hall; 1996. [Google Scholar]
- 7.Zimmermann S, Ehrhardt T, Plesch G, Müller-Röber B. Cell Mol Life Sci. 1999;55:183–203. doi: 10.1007/s000180050284. [DOI] [PMC free article] [PubMed] [Google Scholar]
- 8.Grabov A, Blatt M R. J Exp Bot. 1998;49:351–360. [Google Scholar]
- 9.Li J, Wang X Q, Watson M B, Assmann S M. Science. 2000;287:300–303. doi: 10.1126/science.287.5451.300. [DOI] [PubMed] [Google Scholar]
- 10.Armstrong F, Leung J, Grabov A, Brearley J, Giraudat J, Blatt M R. Proc Natl Acad Sci USA. 1995;92:9520–9524. doi: 10.1073/pnas.92.21.9520. [DOI] [PMC free article] [PubMed] [Google Scholar]
- 11.Grabov A, Blatt M R. Proc Natl Acad Sci USA. 1998;95:4778–4783. doi: 10.1073/pnas.95.8.4778. [DOI] [PMC free article] [PubMed] [Google Scholar]
- 12.Jacob T, Ritchie S, Assmann S M, Gilroy S. Proc Natl Acad Sci USA. 1999;96:12192–12197. doi: 10.1073/pnas.96.21.12192. [DOI] [PMC free article] [PubMed] [Google Scholar]
- 13.Grabov A, Blatt M R. Plant Physiol. 1999;119:277–288. doi: 10.1104/pp.119.1.277. [DOI] [PMC free article] [PubMed] [Google Scholar]
- 14.Anderson J A, Huprikar S S, Kochian L V, Lucas W J, Gaber R F. Proc Natl Acad Sci USA. 1992;89:3736–3740. doi: 10.1073/pnas.89.9.3736. [DOI] [PMC free article] [PubMed] [Google Scholar]
- 15.Schachtman D P, Schroeder J I, Lucas W J, Anderson J A, Gaber R F. Science. 1992;258:1654–1658. doi: 10.1126/science.8966547. [DOI] [PubMed] [Google Scholar]
- 16.Véry A A, Gaymard F, Bosseux C, Sentenac H, Thibaud J B. Plant J. 1995;7:321–332. doi: 10.1046/j.1365-313x.1995.7020321.x. [DOI] [PubMed] [Google Scholar]
- 17.Hoshi T. J Gen Physiol. 1995;105:309–328. doi: 10.1085/jgp.105.3.309. [DOI] [PMC free article] [PubMed] [Google Scholar]
- 18.Hedrich R, Moran O, Conti F, Busch H, Becker D, Gambale F, Dreyer I, Kuch A, Neuwinger K, Palme K. Eur Biophys J. 1995;24:107–115. doi: 10.1007/BF00211406. [DOI] [PubMed] [Google Scholar]
- 19.Nakamura R L, McKendree W L, Jr, Hirsch R E, Sedbrook J C, Gaber R F, Sussman M R. Plant Physiol. 1995;109:371–374. doi: 10.1104/pp.109.2.371. [DOI] [PMC free article] [PubMed] [Google Scholar]
- 20.Ichida A M, Pei Z M, Baizabal-Aguirre V M, Turner K J, Schroeder J I. Plant Cell. 1997;9:1843–1857. doi: 10.1105/tpc.9.10.1843. [DOI] [PMC free article] [PubMed] [Google Scholar]
- 21.Wisman E, Guillermo H C, Fransz P, Seadler H. Plant Mol Biol. 1998;37:989–999. doi: 10.1023/a:1006082009151. [DOI] [PubMed] [Google Scholar]
- 22.Baumann E, Lewald J, Saedler H, Schulz B, Wisman E. Theor Appl Genet. 1998;97:729–734. [Google Scholar]
- 23.An Y Q, McDowell J M, Huang S, McKinney E C, Chambliss S, Meagher R B. Plant J. 1996;10:107–121. doi: 10.1046/j.1365-313x.1996.10010107.x. [DOI] [PubMed] [Google Scholar]
- 24.Hedrich R, Busch H, Raschke K. EMBO J. 1990;9:3889–3892. doi: 10.1002/j.1460-2075.1990.tb07608.x. [DOI] [PMC free article] [PubMed] [Google Scholar]
- 25.Neher E. Methods Enzymol. 1992;207:123–131. doi: 10.1016/0076-6879(92)07008-c. [DOI] [PubMed] [Google Scholar]
- 26.Roelfsema M R, Prins H B. Planta. 1997;202:18–27. doi: 10.1007/s004250050098. [DOI] [PubMed] [Google Scholar]
- 27.Felle H H, Hanstein S, Steinmeyer R, Hedrich R. Plant J. 2000;24:297–304. doi: 10.1046/j.1365-313x.2000.00878.x. [DOI] [PubMed] [Google Scholar]
- 28.Cardon G H, Frey M, Saedler H, Gierl A. Plant J. 1993;3:773–784. [PubMed] [Google Scholar]
- 29.Goh C-H, Schreiber U, Hedrich R. Plant Cell Environ. 1999;22:1057–1070. [Google Scholar]
- 30.Talbott L-D, Zeiger E. Plant Physiol. 1996;111:1051–1057. doi: 10.1104/pp.111.4.1051. [DOI] [PMC free article] [PubMed] [Google Scholar]
- 31.Lu P, Zhang S Q, Outlaw W H, Jr, Riddle K A. FEBS Lett. 1995;362:180–184. doi: 10.1016/0014-5793(95)00239-6. [DOI] [PubMed] [Google Scholar]
- 32.Baunsgaard L, Fuglsang A T, Jahn T, Korthout H A, de Boer A H, Palmgren M G. Plant J. 1998;13:661–671. doi: 10.1046/j.1365-313x.1998.00083.x. [DOI] [PubMed] [Google Scholar]
- 33.Raschke K. In: Encyclopedia of Plant Physiology, New Series, Physiology of Movements. Feinleib H W A M E, editor. Vol. 7. New York: Springer; 1979. pp. 383–441. [Google Scholar]
- 34.Pilot, G., Lacombe, B., Gaymard, F., Cherel, I., Boucherez, J., Thibaud, J. B. & Sentenac, H. (2000) J. Biol. Chem., in press. [DOI] [PubMed]
- 35.Bertl A, Anderson J A, Slayman C L, Sentenac H, Gaber R F. Folia Microbiol. 1994;39:507–509. doi: 10.1007/BF02814074. [DOI] [PubMed] [Google Scholar]
- 36.Ache P, Becker D, Ivashikina N, Dietrich P, Roelfsema M R G, Hedrich R. FEBS Lett. 2000;486:93–98. doi: 10.1016/s0014-5793(00)02248-1. [DOI] [PubMed] [Google Scholar]
- 37.Gaymard F, Pilot G, Lacombe B, Bouchez D, Bruneau D, Boucherez J, Michaux-Ferriere N, Thibaud J B, Sentenac H. Cell. 1998;94:647–655. doi: 10.1016/s0092-8674(00)81606-2. [DOI] [PubMed] [Google Scholar]
- 38.Marten I, Hoth S, Deeken R, Ache P, Ketchum K A, Hoshi T, Hedrich R. Proc Natl Acad Sci USA. 1999;96:7581–7586. doi: 10.1073/pnas.96.13.7581. [DOI] [PMC free article] [PubMed] [Google Scholar]
- 39.Lagarde D, Basset M, Lepetit M, Conejero G, Gaymard F, Astruc S, Grignon C. Plant J. 1996;9:195–203. doi: 10.1046/j.1365-313x.1996.09020195.x. [DOI] [PubMed] [Google Scholar]
- 40.Lacombe B, Pilot G, Michard E, Gaymard F, Sentenac H, Thibaud J B. Plant Cell. 2000;12:837–51. doi: 10.1105/tpc.12.6.837. [DOI] [PMC free article] [PubMed] [Google Scholar]
- 41.Dietrich P, Dreyer I, Wiesner P, Hedrich R. Planta. 1998;205:277–287. [Google Scholar]
- 42.Brüggemann L, Dietrich P, Dreyer I, Hedrich R. Planta. 1999;207:370–376. doi: 10.1007/s004250050494. [DOI] [PubMed] [Google Scholar]
- 43.Fairley-Grenot K A, Assmann S M. J Membr Biol. 1992;128:103–113. doi: 10.1007/BF00231883. [DOI] [PubMed] [Google Scholar]
- 44.Brüggemann L, Dietrich P, Becker D, Dreyer I, Palme K, Hedrich R. Proc Natl Acad Sci USA. 1999;96:3298–3302. doi: 10.1073/pnas.96.6.3298. [DOI] [PMC free article] [PubMed] [Google Scholar]
- 45.Pei Z M, Kuchitsu K, Ward J M, Schwarz M, Schroeder J I. Plant Cell. 1997;9:409–423. doi: 10.1105/tpc.9.3.409. [DOI] [PMC free article] [PubMed] [Google Scholar]
- 46.Dreyer I, Becker D, Bregante M, Gambale F, Lehnen M, Palme K, Hedrich R. FEBS Lett. 1998;430:370–376. doi: 10.1016/s0014-5793(98)00694-2. [DOI] [PubMed] [Google Scholar]
- 47.Urbach S, Cherel I, Sentenac H, Gaymard F. Plant J. 2000;23:527–538. doi: 10.1046/j.1365-313x.2000.00828.x. [DOI] [PubMed] [Google Scholar]


