

Abstract
Making genes into gene products is subject to predictable errors, each with a phenotypic effect that depends on a normally cryptic sequence. Many cryptic sequences have strongly deleterious effects, for example when they cause protein misfolding. Strongly deleterious effects can be avoided globally by avoiding making errors (e.g., via proofreading machinery) or locally by ensuring that each error has a relatively benign effect. The local solution requires powerful selection acting on every cryptic site and so evolves only in large populations. Small populations with less effective selection evolve global solutions. Here we show that for a large range of realistic intermediate population sizes, the evolutionary dynamics are bistable and either solution may result. The local solution facilitates the genetic assimilation of cryptic genetic variation and therefore substantially increases evolvability.
Keywords: alternative splicing, chaperones, robustness, transcription, translation
The processes involved in the production of RNA and proteins may occasionally fail to express gene products accurately (1). For example, translation errors can lead to proteins with more (e.g., stop codon read-through) or fewer (e.g., premature termination) amino acids. To be functional, a protein needs to fold and to have one or several functional sites. Some changes to the normal sequence of a protein will disrupt its folding, in which case function is destroyed; only changes that preserve folding have the potential to tinker with function. A similar dichotomy is illustrated by the bimodal distribution of the possible effects of new mutations, which can be lethal or nearly neutral, but very rarely in between (2).
Certain errors in protein synthesis lead to the expression of a sequence that is otherwise cryptic. For example, when a stop codon is read through, an amino acid sequence translated from the 3′-untranslated region (3′-UTR) may be added to the C-terminal end of a protein; similarly, a splicing error may lead to the inclusion of an intronic sequence in the coding form. These cryptic protein-coding sequences have been exposed to very little selection, except insofar as the same error (e.g., a stop codon read-through) has been repeated on a regular basis. When this selection is negligible, the probability that a sequence is nearly neutral rather than deleterious is given by a mutational equilibrium. Because the number of amino acid sequences that fold is restricted (3), at this equilibrium most cryptic sequences are deleterious. A globally low error rate will then be selected, because it impedes the expression of deleterious products from all these loci. This low error rate will further reduce the action of selection on individual cryptic sequences. This positive feedback loop between accuracy and the proportion of cryptic sequences that are strongly deleterious would ultimately lead to the evolution of an infinitely small error rate if avoiding errors did not come at a cost (4, 5), resulting in a trade-off between the cost of expressing deleterious sequences and the cost of accuracy (6, 7).
There are two ways to handle the dangers posed by errors. One is to avoid making errors. This is normally a global solution, e.g., through improved proofreading machinery. The other is to make more errors, but evolve robustness to the effects of each of them. This is a local solution that needs to evolve separately at each affected locus.
The positive feedback loop means that only one of the two solutions is expected to evolve in a given population. Selection for local solutions is weaker and is therefore expected only in large populations. A similar prediction was previously made in studies of the evolution of redundancy (8) and of chaperone proteins (8–10). Here we confirm this prediction; however, we also find that the evolutionary dynamics are bistable; i.e., either a low error rate (global solution) or a high error rate (local solution) can evolve, for a broad range of intermediate population sizes. Moreover, we find that low and high error rates confer different evolvability properties, owing to the fact that errors expose potentially adaptive cryptic variation to selection.
Evolution of an Error Rate
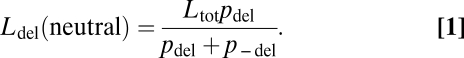
We first parameterize our model for the case study of stop codon read-through, assuming that the rate of read-through (denoted ρ) is constant across loci and can be fine-tuned via mutations (4, 5, 11–15). Let each of the N individuals in the population have Ltot loci; the elongated sequence including read-through into the 3′-UTR is deleterious for Ldel of these loci and neutral for the others. Potentially deleterious consequences of read-through include protein misfolding (1, 3, 16) and, when no “backup” stop codon exists, nonstop mRNA decay (17). Mutations occur with probability μ (= 10−8) at each of the nh (= 30) nucleotides of each cryptic sequence and change the effect of read-through from neutral to deleterious with probability pdel or from deleterious to neutral with probability p−del. Assuming that deleterious effects due to protein misfolding are representative, we estimate p−del = 0.4 (3) and set a lower value for the probability of reverse mutations (p−del = 0.1). In the absence of selection, the expected number of loci with a deleterious cryptic sequence is
 |
A genotype i with deleterious cryptic sequences in Ldel(i) loci, and error rate ρ(i), has fitness
where ωm, ωa, and ωs denote components of fitness associated, respectively, with the expression of deleterious cryptic sequences, with deleterious sequences becoming permanently expressed through new mutations and with the cost of proofreading during protein synthesis. ω(i) was used to calculate the probability that an individual will be of genotype i in the next generation, using a standard Wright–Fisher simulation without recombination (Methods).
We first assume that effects of expression errors across multiple loci are multiplicative, such that each deleterious sequence decreases fitness by a factor (1 − ρ)γ (Eq. 3). We used low values of γ (typically 0.01), so that a deleterious product has a strong negative effect on fitness only when it is expressed as a high proportion of the total expression. This assumption is based on the observation that most lethal mutations are strongly recessive, as observed in Drosphilia (18) and Saccharomyces cerevisiae (19) (Methods). The second term of Eq. 3 describes the fitness effect of expressing the sequence following a backup stop codon in the 3′-UTR, which occurs with frequency ρ2. We assume that these sequences are not affected by selection, so they are deleterious for Ldel(neutral) loci. Subsequent sequences in the 3′-UTR, expressed with frequency ≤ρ3, are ignored:
ωm = 0 when deleterious read-through is complete (ρ = 1), which means that the loci considered code for essential proteins.
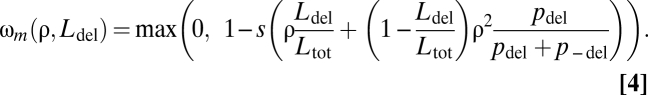
This multiplicative scenario could, for example, correspond to the fitness effects of loss of function. We also examined a model of additive fitness effects, which may better describe the gain of a nonspecific toxic function, e.g., due to the aggregation of misfolded proteins (1, 16). Fitness in the additive scenario depends on the total concentration of all deleterious products within the cell and on their toxicity. Fitness is decreased by the product of a parameter, s (Methods), and the total concentration of all deleterious proteins, so the component of fitness ωm (Eq. 2) can be rewritten:
 |
The low expression level ρ of a given cryptic sequence may increase to 1 if the sequence is genetically assimilated. Assimilation happens if a mutation changes the stop codon into a sense codon, which occurs with approximate probability  (20). Because the Ltot loci code for essential proteins, the assimilation of a deleterious sequence leads to null fitness. There may therefore be selection for mutational robustness, with fitness proportional to the probability that no assimilation event will occur:
We assume that the rate of read-through decreases exponentially with the time spent reading the stop codon. In other words, each time a stop codon is “proofread” divides the remaining probability that an error will occur by a given amount. Speed of translation is rate limiting for the growth of most microorganisms. Evidence for this rate limitation includes the positive correlation between the growth rate and the cellular concentration of rRNA in Salmonella typhimurium (21). Moreover, hyperaccurate translation leads to slow growth in Escherichia coli (4). Generation time is then proportional to 1 − log(ρ) × δ. Assuming that fitness is inversely proportional to the generation time, as expected for fast-growing species,
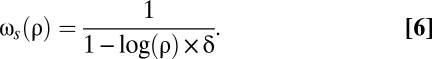 |
Note that Eq. 6 can also be interpreted as an opportunity cost in an alternative additive currency, e.g., energy instead of time.
As a default, we set δ = 10−2.5. With this value, the generation time increases by 0.72% when ρ changes from 10−2 to 10−3. Such a small contribution of stop codon reading is compatible with the observation that the rate of protein synthesis is determined largely by the rate of translation initiation, which depends on the availability of free ribosomes, itself slightly increased by faster elongation or termination (22).
Evolutionary Dynamics of the Error Rate Are Bistable
Here we present results for the multiplicative fitness scenario (Eq. 3): Results for the additive scenario (Eq. 4) are very similar and can be found in Figs. S1–S3. The optimal value of ρ for a given value of Ldel is calculated from Eq. 2 and shown as a thick gray line in Fig. 1A and Fig. S1A. The optimal error rate decreases when the number of cryptic deleterious sequences increases. Considering the relationship in the opposite causal direction, equilibrium values of Ldel, resulting from a mix of drift and selection, were obtained by simulation for given values of ρ (Fig. 1A and Fig. S1A, thin lines). When ρ is low, deleterious cryptic sequences are less likely to be eliminated by selection and Ldel converges toward the value given by mutation bias alone, which equals 400 in this example. Higher values of ρ expose cryptic sequences to selection, and Ldel tends to be low in consequence.
Fig. 1.

Evolutionary dynamics of the read-through error rate ρ. (A) Coevolution of ρ and of the number of cryptic sequences that are deleterious, Ldel. The optimal value of ρ as a function of Ldel, calculated as the value maximizing Eq. 2 (Methods), is represented by a thick gray line, and ρ evolves toward this line when Ldel is fixed. The equilibrium values of Ldel as functions of log10(ρ) are represented by thin lines, for population sizes N = 103 and N = 105. Ldel evolves toward these lines when ρ is fixed. The values of ρ and Ldel obtained by simulation are represented by solid crosses (centered on the mean, ±2 SD across replicate populations), each matching the intersection of the thick and one thin line. Movie S1 shows the simulated coevolutionary dynamics. (B) The evolved error rate ρ is low in small populations, high in large populations, and bistable for intermediate populations. Solid and open symbols (error bars ±2 SD; x values were slightly changed to avoid superposition) represent the results of simulations starting with (log10(ρ), Ldel) = (−5, 400) and (−2, 0), respectively. (C) The ranges of N at which ρ is low or bistable increase with the total number of loci, Ltot. Bistable outcomes were identified by comparing the results of simulations obtained with the same initial conditions as in B, using a t test with critical value 0.005. Parameter values: γ = 0.01, pdel = 0.4, p−del = 0.1, δ = 10−2.5, μ = 10−8, and Ltot = 500 (A and B).
In a small population (N = 103), drift overcomes the weak effect of selection on cryptic sequences, even for large values of ρ at which cryptic sequences are more exposed. In consequence, once the optimal value of ρ is reached for a given low value of Ldel, more deleterious sequences fix. This increase in Ldel favors the evolution of a lower error rate, which weakens selection on cryptic sequences still further, and more of them tend to be deleterious in consequence. This process (Movie S1) ultimately leads to the evolution of a low rate of errors (log10(ρ) ≃ −3.15) and of a large number of deleterious cryptic sequences (nearly 400). This steady state would be reached for any initial value of ρ or Ldel. This result is confirmed by individual-based simulations, in which both Ldel and ρ are randomly changed by mutation (Fig. 1A, Fig. S1A, and Movie S1).
In contrast, in a large population (N = 105) that starts with a high error rate and no deleterious cryptic sequences, selection eliminates deleterious cryptic sequences efficiently (Fig. 1A, Fig. S1A, and Movie S1). With so few deleterious cryptic sequences, a high value of ρ can be maintained because there is now so little cost to the expression of cryptic sequences. This dynamical process ultimately leads to a steady state where the rate of errors is high  and the number of deleterious cryptic sequences is almost 0. This result is confirmed by individual-based simulations (Fig. 1A, Fig. S1A, and Movie S1). In a large population that starts with a low error rate and 400 deleterious cryptic sequences, however, deleterious cryptic sequences are not efficiently eliminated by selection after the optimal value of ρ is reached. Reading through stop codons decreases fitness strongly, and consequently a low error rate ultimately evolves (log10(ρ) ≃ −2.96), just as it did for a small population.
As the population size increases, selection against deleterious sequences gets more efficient, so the same value of Ldel is expected for a lower value of ρ. Graphically, this shifts the thin curve to the left in Fig. 1A and Fig. S1A, while preserving its shape. Past some critical value of N, the thin and thick curves intersect three times instead of just once. At this point, a second stable outcome appears, corresponding to a high error rate. As shown in Fig. 1 B and C, this transition happens at ∼N = 104.3 for Ltot = 500 in the multiplicative scenario. In very large populations (N ≥ 106), the curves again intersect only once, this time in the lower right corner of Fig. 1A and Fig. S1A, and only the high-ρ attractor exists (Fig. 1B and Fig. S1B). The sigmoidal shape of the thin curve explains why the evolved values of ρ differ by as much as 30-fold between the two attractors in Fig. 1B, but often vary little with N given the same attractor. The difference in error rates between the two attractors increases with the total number of loci Ltot in the multiplicative scenario (Fig. S4) but not in the additive scenario (Fig. S2). Increasing Ltot also broadens the range of population sizes with a bistable outcome, as well as the minimum population size at which ρ is bistable (Fig. 1C and Fig. S2). Due to the accumulation of deleterious mutations in cryptic sequences, the attractor with the lower ρ has the lower mean population fitness (0.975 vs. 0.986 when N = 105 in the multiplicative scenario).
Bistability for some intermediate value of N was predicted for all sets of parameter values used (Figs. S2–S6). When δ increases, meaning that the process of stop codon reading contributes more to the time of protein synthesis, the range of population sizes at which ρ is bistable gets slightly narrower, and the ratio of ρ between the two attractors decreases (Fig. S5). Increasing γ so that partial loss of function has larger fitness effects increases the range of population sizes with a bistable outcome by decreasing the lower bound of this range; it also increases the difference between the two attractors (Fig. S6). Similar results were obtained under the additive fitness scenario, where increasing the toxicity of deleterious products (s) increases both the range of population sizes with two attractors and the difference between the attractors (Fig. S3).
High Error Rate Attractor Has Higher Evolvability
So far, we have considered only the potentially catastrophic consequences of read-through. While strongly deleterious sequences dominate the dynamics described above, cryptic sequences that are not strongly deleterious may tinker with rather than destroy function and so contribute to adaptation. In this regard, the two attractor genotypes expected from the coevolutionary dynamics of ρ and Ldel may have different evolvability properties, with nonlethal cryptic sequences potentially contributing to adaptation via genetic assimilation (i.e., permanent loss of the stop codon). Let us assume that K loci affect a trait value x and that the effect size at each locus can be changed if a cryptic sequence that is not catastrophically deleterious is expressed or assimilated. Because a high rate of read-through eliminates strongly deleterious sequences and thus facilitates the adaptive assimilation of cryptic sequences, it might cause more rapid adaptation after an environmental change alters the optimal trait value (23).
Let us modify the model slightly to test this prediction. The regular sequences of K of the Ltot loci now have additive effects, denoted αik for locus k (and genotype i), on the trait value xi. The cryptic sequence has an additive effect denoted βik when it is expressed with frequency ρ. A protein produced from locus k that includes the expression of a cryptic sequence has strongly deleterious effects if Bik = 0 (otherwise Bik = 1). Strongly deleterious proteins have no direct effect on the trait value. We thus have
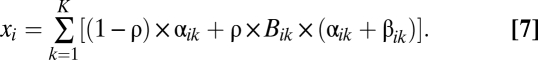 |
The trait value can be changed by point mutations occurring with probability μ on nc = 300 or nh = 30 nucleotides in the regular or cryptic sequence of a locus, respectively. A mutation changes αik or βik by an amount sampled from a normal distribution with mean = −(αik / a) or −(βik / a), respectively, and SD = σm / K. Parameter a sets a stationary distribution for αik and βik in the absence of selection (see SI Methods; we used a = 750 in the results presented). New values of βik are chosen by sampling from this distribution. Mutations in the cryptic sequence of locus k also change the value of Bik to 0 or to 1 with respective probabilities pdel and p−del. Assimilation of cryptic sequences occurs with probability μa, in which case αik increases by βik if Bik = 1, whereas the fitness of the mutant is set to 0 if Bik = 0.
Fitness associated with the trait value is assumed to be Gaussian with a maximum at the environmental optimum, denoted oe,
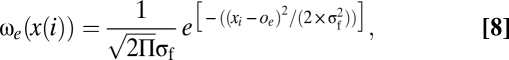 |
where σf = 0.5. Fitness of an individual with genotype i now equals
We compared the ability to adapt after an environmental change for populations representing the two attractors expected when N = 105 (Fig. 2): Populations with the higher error rate adapt much more rapidly to the new environment. The time to adaptation was consistently lower for the high error rate attractor in our simulations, as long as the number of loci coding for the trait was larger than five (Fig. 2B and Fig. S7). This result agrees with previous work showing that cryptic genetic variation promotes evolvability most strongly when adaptations have a complex genetic basis (20, 23–25).
Fig. 2.

The mean population trait value, x, changes faster after an environmental change with the high -ρ (log10(ρ) = −1.71) than with the low-ρ attractor (log10(ρ) = −2.96). (A) One simulation in which the population with the high-ρ attractor (dashed line) reaches the new optimum before the low-ρ attractor (solid line). A change in the optimal trait value, from −1.5 to 1.5, is simulated at t = 20,000. (B) The time before the population reaches a mean trait value near the optimum (1.4) after an environmental change (time to adaptation) increases with the number of loci coding for the trait, K. The time to adaptation is consistently lower for the high-ρ attractor when K > 5. The size of mutations decreases with K (see text), which explains that the time to fixation of advantageous mutants increases. Keeping the size of mutations independent of K leads to a decreasing time to adaptation with K (Fig. S7), but leads to the same K > 5 condition for high-ρ attractor advantage. The error bars represent the first and third quartiles in the distribution of the time to adaptation, calculated from 20 simulations for each set of parameter values. The two attractors are those shown in Fig. 1 A and B for N = 105. Parameter values: N = 105, σm = 0.5, a = 750; other values are the same as in Fig. 1 A and B.
Modifications to all other parameter values preserved our result. High values of σm and large population sizes both increase the speed of adaptation for both attractors, with a stronger effect when ρ is high (Figs. S8 and S9). Parameter a sets the genetic variability of cryptic sequences, and accordingly adaptation in populations with a high ρ is quicker for higher values of this parameter (Fig. S10). Indeed, populations with a low ρ are less affected by the increase in a and adapt more slowly for all values taken by this parameter.
Evolvability (26, 27), when considered as a by-product of the evolution of the error rate, is thus higher when molecular errors are common. It is even conceivable that a changing environment would favor the evolution of an increased error rate, as a consequence of its evolvability properties, when bistability exists.
Application to Read-Through Errors
We predict that the rate of read-through should be very different in very small (e.g., N ≤ 104.3 in Fig. 1 B and C) and very large populations (e.g., N ≥ 106 in Fig. 1 B and C). Read-through frequency in wild-type S. cerevisae (28) for a typical stop-codon context is ∼3 × 10⁻³ to 5 × 10⁻³, which is compatible with our prediction of a high error rate in a species with large population sizes. We are not aware of measures of this rate in species with very small population sizes. At intermediate population sizes, the read-through error rate should depend on the history of the species and of the population studied. For example, if a species comes from an ancestor with very large population sizes, hence with a high error rate and few deleterious cryptic sequences, these characteristics should be conserved as the population size decreases toward intermediate values. Similarly, a low error rate and a majority of cryptic sequences being deleterious are expected features for a species that increased in size compared with its small-population ancestor. Moreover, a prolonged bottleneck in a population of a species with a high error rate could initiate the accumulation of deleterious cryptic sequences and the evolution of a low error rate, which may persist after the population size increases back to intermediate. Measures of read-through rates in various species with different population sizes and known histories could be interpreted in the light of these considerations and provide a test of our theory.
Our prediction of selection eliminating deleterious cryptic sequences in large populations is compatible with the evidence of a prevalence of backup stop codons in yeast (29, 30). We do not expect such signatures of purging selection in species with lower population sizes, such as endosymbiotic bacteria (31).
Assimilations of 3′-UTR sequences into coding regions have been observed in both rodents and Saccharomyces (32). According to our predictions, such events might have been facilitated by a high error rate, which should evolve only in large populations. Testing this prediction will require both more experimental studies measuring the rate of read-through in species with diverse population sizes and an estimation in these same species of the frequency of 3′-UTR assimilation events.
Other Applications of the Model
Although this model was parameterized for the specific case of stop codon read-through, our qualitative conclusions remain unchanged for a wide range of parameter values (Figs. 1 and 2 and Figs. S1–S10). They may therefore be valid for other reproducible errors in gene expression that reveal discrete cryptic sequences at many loci (Table 1). This is not the case for amino acid misincorporations, where a vast diversity of cryptic sequences exist per locus. However, our model may describe the evolution of novel alternative splice sites via splicing errors (23, 33, 34). The first part of our model may also describe the evolution of chaperones (9, 35). In this case, the probability of a folding error is affected both locally by particular coding sequences and globally by chaperones. Evolvability considerations are important but slightly different in the case of chaperones, as evolvability does not involve a local increase in ρ (37). A similar model has also been used to describe redundancy at the global level, e.g., via polyploidy (8). In the case of ploidy, an ideal model would allow ρ to increase globally but to decrease locally, unlike the global evolution of ρ modeled both here and elsewhere (8).
Table 1.
Applications for this model
| Type of error | Local solution(s) (low Ldel) | Global solution(s) (low ρ) | Assimilation | Remarks | Selected refs. |
| Stop codon read-through | Read-through of 3′-UTR is benign | Accurate ribosome and release factors | Stop codon disappears | (29, 30, 32) | |
| Splicing error | Erroneous splice site yields benign product | Accurate spliceosome | New alternative splice site appears | ρ may not reach 1 after assimilation | (33, 34) |
| Failure to fold, misfolding | Chaperone-independent folding | Chaperones | — | Excess folding stability increases evolvability by facilitating the evolution of proteins with similar fold but alternative sequences and functions | (9) |
| Mistranslation-induced folding errors | Optimal codon use | Chaperones | — | (35) | |
| Failure to fold | Excess stability (thermodynamic) | AT-biased DNA repair | — | Selection strengths differ, so AT bias is selected at low Ne, then GC at intermediate Ne, and then balance between the two at high Ne | (36, 37) |
| Misfolding | Canalized folding process (kinetic) | CG-biased DNA repair | — | (36) | |
| Mutational loss of function | Purging of loss-of-function mutants, gene duplication | Low mutation rate, genome duplication (e.g., high ploidy), other tolerance of loss of function | Subfunctionalization or neofunctionalization | (8, 38) |
Our core result is that a solution acting at many sites at once evolves in small populations, and local solutions at each independent site evolve in large populations, whereas either outcome is possible in populations of intermediate size. Local solutions, associated with large populations, have both higher mean fitness and greater evolvability.
Methods
Simulation Procedures.
The population is replaced each generation by sampling according to a Wright–Fisher process without recombination. The probability that a given new individual has genotype i equals
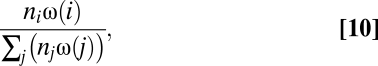 |
where ni denotes the number of individuals with genotype i and the sum is made over all of the genotypes in the population. Changes in Ldel(i), which occur with probability  (increase) and
  (decrease), lead to new genotypes, as do changes in ρ(i) occurring with probability μρ = 10−5 per individual per generation. Such mutations increase log10(ρ) by an amount sampled from a normal distribution with mean = 0 and SD = 0.2. For each set of parameter values, 20 simulations were run for 5 × 10⁷ generations, starting from a monomorphic population with log10(ρ) either −5 or −2 and Ldel either Ldel (neutral) or 0. During an initial period of 106 generations, μρ is set to 0. The equilibrium values of Ldel in Fig. 1 were obtained by keeping μρ = 0 all along each simulation and initializing ρ with the desired values.
We assumed clonal reproduction to reduce simulation times. The summary statistic Ldel would have to be replaced by a specific tracking of each locus in a model with sex and recombination, which would be very computationally expensive.
Estimation of γ and s.
We estimated the cost of expressing deleterious cryptic sequences from the fitness of heterozygotes for a lethal allele. Szafraniec and collaborators (19) estimated the dominance coefficient h ≈ 0.0034 for lethal mutations in Saccharomyces by comparing fitness of heterozygotes vs. haploids. The comparison between haploids and heterozygotes may not be ideal, for instance because certain genes can be lethal in haploids and not in homozygote diploids (19), so h is probably underestimated in this study. In Drosophila populations, h ranges from 0.0057 to 0.025 (18). We thus used h = 0.007, so the fitness associated with the expression of a lethal sequence with frequency 0.5, f(0.5), equals 1 − h = 0.993.
In the multiplicative fitness scenario, fitness associated with the expression of a deleterious sequence in the 3′-UTR of a single locus coding for an essential protein is assumed to take the form
This is the first term of Eq. 3, corresponding to Ldel = 1. From Eq. 11 with ρ = 0.5, we calculate γ as
 |
We used this value of γ in the main text and studied the effect of this parameter in Fig. S6.
We used the same approach to estimate s in the additive fitness scenario. For the purpose of comparison with the multiplicative scenario, we assume the same fitness effect for ρ = 0.5, Ldel = 1. Eq. 11 then becomes
 |
The value of s depends on Ltot, which we take to be 1,000. From Eq. 13 with ρ = 0.5, we calculate s as
 |
We used this value for s in the additive fitness scenario (Figs. S1 and S2), and we studied the effect of this parameter in Fig. S3.
Supplementary Material
Acknowledgments
We thank M. Guiserix for solving Eq. S3 and two anonymous reviewers for helpful comments. This work was supported by National Institutes of Health Grant R01 GM076041. J.M. is a Pew Scholar in the Biomedical Sciences.
Footnotes
The authors declare no conflict of interest.
*This Direct Submission article had a prearranged editor.
This article contains supporting information online at www.pnas.org/lookup/suppl/doi:10.1073/pnas.1012918108/-/DCSupplemental.
References
- 1.Drummond DA, Wilke CO. The evolutionary consequences of erroneous protein synthesis. Nat Rev Genet. 2009;10:715–724. doi: 10.1038/nrg2662. [DOI] [PMC free article] [PubMed] [Google Scholar]
- 2.Eyre-Walker A, Keightley PD. The distribution of fitness effects of new mutations. Nat Rev Genet. 2007;8:610–618. doi: 10.1038/nrg2146. [DOI] [PubMed] [Google Scholar]
- 3.Bloom JD, et al. Thermodynamic prediction of protein neutrality. Proc Natl Acad Sci USA. 2005;102:606–611. doi: 10.1073/pnas.0406744102. [DOI] [PMC free article] [PubMed] [Google Scholar]
- 4.Andersson DI, van Verseveld HW, Stouthamer AH, Kurland CG. Suboptimal growth with hyper-accurate ribosomes. Arch Microbiol. 1986;144:96–101. doi: 10.1007/BF00454963. [DOI] [PubMed] [Google Scholar]
- 5.Youngman EM, McDonald ME, Green R. Peptide release on the ribosome: Mechanism and implications for translational control. Annu Rev Microbiol. 2008;62:353–373. doi: 10.1146/annurev.micro.61.080706.093323. [DOI] [PubMed] [Google Scholar]
- 6.Kurland CG, Ehrenberg M. Growth-optimizing accuracy of gene expression. Annu Rev Biophys Biophys Chem. 1987;16:291–317. doi: 10.1146/annurev.bb.16.060187.001451. [DOI] [PubMed] [Google Scholar]
- 7.Zaher HS, Green R. Fidelity at the molecular level: Lessons from protein synthesis. Cell. 2009;136:746–762. doi: 10.1016/j.cell.2009.01.036. [DOI] [PMC free article] [PubMed] [Google Scholar]
- 8.Krakauer DC, Plotkin JB. Redundancy, antiredundancy, and the robustness of genomes. Proc Natl Acad Sci USA. 2002;99:1405–1409. doi: 10.1073/pnas.032668599. [DOI] [PMC free article] [PubMed] [Google Scholar]
- 9.Fares MA, Ruiz-González MX, Moya A, Elena SF, Barrio E. Endosymbiotic bacteria: groEL buffers against deleterious mutations. Nature. 2002;417:398. doi: 10.1038/417398a. [DOI] [PubMed] [Google Scholar]
- 10.Gros PA, Tenaillon O. Selection for chaperone-like mediated genetic robustness at low mutation rate: Impact of drift, epistasis and complexity. Genetics. 2009;182:555–564. doi: 10.1534/genetics.108.099366. [DOI] [PMC free article] [PubMed] [Google Scholar]
- 11.Uno M, Ito K, Nakamura Y. Polypeptide release at sense and noncognate stop codons by localized charge-exchange alterations in translational release factors. Proc Natl Acad Sci USA. 2002;99:1819–1824. doi: 10.1073/pnas.032457599. [DOI] [PMC free article] [PubMed] [Google Scholar]
- 12.Chao AT, Dierick HA, Addy TM, Bejsovec A. Mutations in eukaryotic release factors 1 and 3 act as general nonsense suppressors in Drosophila. Genetics. 2003;165:601–612. doi: 10.1093/genetics/165.2.601. [DOI] [PMC free article] [PubMed] [Google Scholar]
- 13.Janzen DM, Geballe AP. The effect of eukaryotic release factor depletion on translation termination in human cell lines. Nucleic Acids Res. 2004;32:4491–4502. doi: 10.1093/nar/gkh791. [DOI] [PMC free article] [PubMed] [Google Scholar]
- 14.O'Connor M, Gregory ST, Dahlberg AE. Multiple defects in translation associated with altered ribosomal protein L4. Nucleic Acids Res. 2004;32:5750–5756. doi: 10.1093/nar/gkh913. [DOI] [PMC free article] [PubMed] [Google Scholar]
- 15.Baudin-Baillieu A, et al. Nucleotide modifications in three functionally important regions of the Saccharomyces cerevisiae ribosome affect translation accuracy. Nucleic Acids Res. 2009;37:7665–7677. doi: 10.1093/nar/gkp816. [DOI] [PMC free article] [PubMed] [Google Scholar]
- 16.Dobson CM. Protein folding and misfolding. Nature. 2003;426:884–890. doi: 10.1038/nature02261. [DOI] [PubMed] [Google Scholar]
- 17.Frischmeyer PA, et al. An mRNA surveillance mechanism that eliminates transcripts lacking termination codons. Science. 2002;295:2258–2261. doi: 10.1126/science.1067338. [DOI] [PubMed] [Google Scholar]
- 18.Simmons MJ, Crow JF. Mutations affecting fitness in Drosophila populations. Annu Rev Genet. 1977;11:49–78. doi: 10.1146/annurev.ge.11.120177.000405. [DOI] [PubMed] [Google Scholar]
- 19.Szafraniec K, Wloch DM, Sliwa P, Borts RH, Korona R. Small fitness effects and weak genetic interactions between deleterious mutations in heterozygous loci of the yeast Saccharomyces cerevisiae. Genet Res. 2003;82:19–31. doi: 10.1017/s001667230300630x. [DOI] [PubMed] [Google Scholar]
- 20.Griswold CK, Masel J. Complex adaptations can drive the evolution of the capacitor [PSI], even with realistic rates of yeast sex. PLoS Genet. 2009;5:e1000517. doi: 10.1371/journal.pgen.1000517. [DOI] [PMC free article] [PubMed] [Google Scholar]
- 21.Ecker RE, Schaechter M. Ribosome content and the rate of growth of Salmonella typhimurium. Biochim Biophys Acta. 1963;76:275–279. [PubMed] [Google Scholar]
- 22.Bulmer M. The selection-mutation-drift theory of synonymous codon usage. Genetics. 1991;129:897–907. doi: 10.1093/genetics/129.3.897. [DOI] [PMC free article] [PubMed] [Google Scholar]
- 23.Masel J. Cryptic genetic variation is enriched for potential adaptations. Genetics. 2006;172:1985–1991. doi: 10.1534/genetics.105.051649. [DOI] [PMC free article] [PubMed] [Google Scholar]
- 24.Kim Y. Rate of adaptive peak shifts with partial genetic robustness. Evolution. 2007;61:1847–1856. doi: 10.1111/j.1558-5646.2007.00166.x. [DOI] [PubMed] [Google Scholar]
- 25.Whitehead DJ, Wilke CO, Vernazobres D, Bornberg-Bauer E. The look-ahead effect of phenotypic mutations. Biol Direct. 2008;3:18. doi: 10.1186/1745-6150-3-18. [DOI] [PMC free article] [PubMed] [Google Scholar]
- 26.Masel J, Trotter MV. Robustness and evolvability. Trends Genet. 2010;26:406–414. doi: 10.1016/j.tig.2010.06.002. [DOI] [PMC free article] [PubMed] [Google Scholar]
- 27.Pigliucci M. Is evolvability evolvable? Nat Rev Genet. 2008;9:75–82. doi: 10.1038/nrg2278. [DOI] [PubMed] [Google Scholar]
- 28.Firoozan M, Grant CM, Duarte JAB, Tuite MF. Quantitation of readthrough of termination codons in yeast using a novel gene fusion assay. Yeast. 1991;7:173–183. doi: 10.1002/yea.320070211. [DOI] [PubMed] [Google Scholar]
- 29.Williams I, Richardson J, Starkey A, Stansfield I. Genome-wide prediction of stop codon readthrough during translation in the yeast Saccharomyces cerevisiae. Nucleic Acids Res. 2004;32:6605–6616. doi: 10.1093/nar/gkh1004. [DOI] [PMC free article] [PubMed] [Google Scholar]
- 30.Liang H, Cavalcanti AR, Landweber LF. Conservation of tandem stop codons in yeasts. Genome Biol. 2005;6:R31. doi: 10.1186/gb-2005-6-4-r31. [DOI] [PMC free article] [PubMed] [Google Scholar]
- 31.Moran NA, McCutcheon JP, Nakabachi A. Genomics and evolution of heritable bacterial symbionts. Annu Rev Genet. 2008;42:165–190. doi: 10.1146/annurev.genet.41.110306.130119. [DOI] [PubMed] [Google Scholar]
- 32.Giacomelli MG, Hancock AS, Masel J. The conversion of 3′ UTRs into coding regions. Mol Biol Evol. 2007;24:457–464. doi: 10.1093/molbev/msl172. [DOI] [PMC free article] [PubMed] [Google Scholar]
- 33.Modrek B, Lee C. A genomic view of alternative splicing. Nat Genet. 2002;30:13–19. doi: 10.1038/ng0102-13. [DOI] [PubMed] [Google Scholar]
- 34.Kondrashov FA, Koonin EV. Evolution of alternative splicing: Deletions, insertions and origin of functional parts of proteins from intron sequences. Trends Genet. 2003;19:115–119. doi: 10.1016/S0168-9525(02)00029-X. [DOI] [PubMed] [Google Scholar]
- 35.Warnecke T, Hurst LD. GroEL dependency affects codon usage—support for a critical role of misfolding in gene evolution. Mol Syst Biol. 2010;6:340. doi: 10.1038/msb.2009.94. [DOI] [PMC free article] [PubMed] [Google Scholar]
- 36.Mendez R, Fritsche M, Porto M, Bastolla U. Mutation bias favors protein folding stability in the evolution of small populations. PLoS Comput Biol. 2010;6:e1000767. doi: 10.1371/journal.pcbi.1000767. [DOI] [PMC free article] [PubMed] [Google Scholar]
- 37.Bloom JD, Labthavikul ST, Otey CR, Arnold FH. Protein stability promotes evolvability. Proc Natl Acad Sci USA. 2006;103:5869–5874. doi: 10.1073/pnas.0510098103. [DOI] [PMC free article] [PubMed] [Google Scholar]
- 38.Crow KD, Wagner GP. SMBE Tri-National Young Investigators Proceedings of the SMBE Tri-National Young Investigators’ Workshop 2005. What is the role of genome duplication in the evolution of complexity and diversity? Mol Biol Evol. 2006;23:887–892. doi: 10.1093/molbev/msj083. [DOI] [PubMed] [Google Scholar]
Associated Data
This section collects any data citations, data availability statements, or supplementary materials included in this article.