

Abstract
Spatial asymmetry is crucial to development. One mechanism for generating asymmetry involves the localized synthesis of a key regulatory protein that diffuses away from its source, forming a spatial gradient. Although gradients are prevalent in eukaryotes, at both the tissue and intracellular levels, it is unclear whether gradients of freely diffusible proteins can form within bacterial cells given their small size and the speed of diffusion. Here, we show that the bacterium Caulobacter crescentus generates a gradient of the active, phosphorylated form of the master regulator CtrA, which directly regulates DNA replication. Using a combination of mathematical modeling, single-cell microscopy, and genetic manipulation, we demonstrate that this gradient is produced by the polarly localized phosphorylation and dephosphorylation of CtrA. Our data indicate that cells robustly establish the asymmetric fates of daughter cells before cell division causes physical compartmentalization. More generally, our results demonstrate that uniform protein abundance may belie gradients and other sophisticated spatial patterns of protein activity in bacterial cells.
Keywords: cellular asymmetry, spatial gradients, two-component signaling, reaction–diffusion model, histidine kinase
Asymmetry plays a crucial role in generating complexity within biological systems, and the establishment of asymmetry often requires spatial heterogeneity of key regulatory proteins. Among the best-studied examples of this phenomenon are morphogen gradients in multicellular organisms that drive developmental patterning (1). In such cases, signaling proteins form a concentration gradient across many cells via diffusion from a spatially localized source. Protein gradients have also been observed within individual eukaryotic cells (reviewed in ref. 2), such as the gradient of Ran-GTP that emanates from yeast chromosomes to help organize the mitotic spindle.
Consistent with their ability to establish protein gradients in the presence of diffusion, eukaryotic cells can sense gradients of small molecules by directly comparing concentrations across their cell bodies (3). By contrast, because of their small size, bacterial detection of chemoattractant gradients relies on temporal comparisons during swimming (4). It is thus unclear whether bacteria, typically smaller than eukaryotic cells by an order of magnitude or more, can establish spatial gradients of freely diffusible proteins. Indeed, most bacterial cytoplasmic proteins are uniformly distributed within the cell, and exceptions such as the gradient of MinC protein in Escherichia coli are notable for their dependence on interaction with membrane-associated proteins (5).
The bacterium Caulobacter crescentus is a model bacterium for understanding the molecular basis of cellular asymmetry. Each cell division in this organism is asymmetric, producing a daughter stalked cell in S phase and a daughter swarmer cell in G1. This difference in cell fate is dictated by the cytoplasmic protein CtrA, an essential transcription factor that also binds to and directly silences the origin of replication (6). Here, we present evidence for a spatial gradient of the active, phosphorylated form of CtrA. Before cell division occurs, phosphorylated CtrA (CtrA~P) is abundant and transcriptionally activates more than 70 target genes, many required for cell division (7). After cell division, CtrA~P continues to repress DNA replication in daughter swarmer cells but is rapidly dephosphorylated and degraded in daughter stalked cells, permitting the immediate initiation of DNA replication. A prevailing model posits that cytokinesis is necessary for the establishment of cell fate asymmetry (8), implying that phosphorylated CtrA is homogeneously distributed before cell division. Our data challenge this model, indicating instead that the cell uses a sophisticated symmetry-breaking mechanism such that CtrA is differentially phosphorylated across the predivisional cell. Cytokinesis then serves to reinforce the existing asymmetry in daughter cells.
CtrA activity is regulated by CckA, which can act either as a kinase or as a phosphatase for CtrA via the phosphotransferase ChpT (9, 10). In predivisional cells, when CtrA phosphorylation levels peak, CckA is usually bipolarly localized (10, 11). Here, we demonstrate a critical role for the localization and bifunctional activity of CckA in which it is a kinase at the swarmer pole and a phosphatase at the stalked pole. This spatial asymmetry in opposing CckA activities produces a gradient of CtrA phosphorylation across the predivisional cell with dramatic consequences for the asymmetry of critical cellular processes such as DNA replication.
Results
Replication in Predivisional Cells Has an Intrinsic Spatial Asymmetry.
Caulobacter cells normally replicate their DNA exactly once per cell cycle (12). However, we found that blocking cell division with the antibiotic cephalexin allowed for additional rounds of replication in predivisional cells. Intriguingly, flow cytometry indicated that for most cephalexin-treated cells, only one of the two chromosomes replicated, such that cells transitioned from having two to three chromosomes (Fig. 1A). By contrast, when E. coli cells harboring two chromosomes were treated with cephalexin, both chromosomes replicated to yield cells with four chromosomes (Fig. 1A). We thus asked whether the two chromosomes in Caulobacter predivisional cells have unequal likelihoods of initiating replication, even before cell division occurs.
Fig. 1.

Chromosomal replication in wild-type predivisional cells exhibits spatial asymmetry. (A) Flow cytometry analysis of DNA content in mixed populations of C. crescentus and E. coli cells. Cephalexin was added to cultures at time t = 0 to inhibit cell division. Samples were taken immediately or after 15 min (E. coli) or 60 min (Caulobacter) and chromosome content examined by flow cytometry. (B) Experimental design for using the tetO, TetR-YFP FROS to examine DNA replication in individual cells. At time t = 0, newly synchronized swarmer cells are placed on an agarose pad supplemented with cephalexin and imaged at various time points by phase and epifluorescence microscopy. Green dots represent fluorescent foci of TetR-YFP, which label the origins of replication. (C) Representative time-lapse images from a wild-type cell harboring the tet FROS. A single origin at the old/stalked pole (arrowhead) replicates within the first 90 min to yield two polar origins. A third origin stemming from the stalked pole is visible after the 126-min time point. (D) Quantification of the spatial patterns of DNA replication in division-inhibited wild-type cells. (E) Computational modeling of CtrA~P asymmetry when CckA functions as a kinase at the swarmer pole and as a phosphatase at the stalked pole (phosphorylation and dephosphorylation rates are σk = 100/s and σp = 10/s, respectively, and occur across the hemispherical surfaces indicated in red). The predivisional cell is represented as a 3D curved cylinder with length 4 μm. Small triangles represent the surfaces of tetrahedral simulation grid points, and the concentration of CtrA~P is shaded relative to total CtrA protein.
To visualize DNA replication in individual living cells, we implemented a fluorescent repressor–operator system (FROS) (13) in which cells produce TetR-YFP and harbor an array of tet operator (tetO) sites near the origin of replication (14). Binding of TetR-YFP molecules to the tetO array produces a fluorescent focus that marks the origin and enables tracking of DNA replication (Fig. 1B). In a synchronous population of G1 swarmer cells, a single focus was visible at the older pole, which became the stalked pole after differentiation. After the G1–S transition, DNA replication led to the appearance of a second focus that was rapidly tethered to the opposite, nascent swarmer, pole (Fig. 1C). In the presence of cephalexin, cells did not divide, and 77% replicated again to produce a third TetR-YFP focus, on average 105 min after the appearance of the second focus (Fig. 1C). Strikingly, this third focus originated from the stalked pole in 82% of cells and from the swarmer pole in only 16% of cells, with 2% of cells replicating bipolarly (defined as instances when origins at both poles fire within one 6-min frame of each other) (Fig. 1D). Experiments using BrdU labeling also revealed a strong bias for replication of the stalked pole-proximal chromosome (Fig. S1 A and B). To confirm that cephalexin inhibits compartmentalization in Caulobacter, we performed fluorescence recovery after photobleaching (FRAP) on cells expressing a YFP-CtrA fusion. After bleaching one of the poles, fluorescence in that area typically recovered rapidly, and levels within the two halves of the cell converged to similar values, indicating that YFP-CtrA diffuses freely throughout cephalexin-treated cells (Fig. S1 C and D). Consistent with the cephalexin-treated cells, we also observed a strong asymmetry of DNA replication in cells depleted of FtsZ (Fig. S1E). Our data thus indicate that replicative capacity in predivisional cells is strongly asymmetrical, being heavily biased toward the stalked pole, and occurs without compartmentalization.
Spatial Gradient of CtrA Phosphorylation Generates Replicative Asymmetry in Predivisional Cells.
The difference in DNA replication potential of Caulobacter daughter cells after cell division involves asymmetry in the levels of the master regulator CtrA. Whether CtrA dictated the replicative asymmetry we observed in predivisional cells (Fig. 1D) was initially unclear because a YFP-CtrA reporter was found uniformly distributed throughout the cytoplasm (Fig. S2A) (15). However, we hypothesized that phosphorylated CtrA was asymmetrically distributed, forming a spatial gradient of CtrA activity that was responsible for the observed replicative asymmetry. The phosphorylation of CtrA is ultimately driven by CckA, which likely requires the essential factor DivL for kinase activity (16). Whereas CckA typically localizes to both poles of a predivisional cell, DivL usually localizes only to the swarmer pole (17). These patterns are maintained in a large fraction of cephalexin-treated cells (Fig. S2B), suggesting that CckA functions as a kinase at the swarmer pole and perhaps as a phosphatase at the stalked pole, thereby acting as a source and a sink for CtrA~P, respectively.
To investigate whether this asymmetry in CckA activity could generate and maintain a steady-state gradient of CtrA~P before cell division, we developed a reaction–diffusion model of the Caulobacter predivisional cell (Materials and Methods). In this model, we assumed that the phosphorylation state of CtrA is controlled predominantly by kinase and phosphatase activity localized at the swarmer and stalked poles, respectively, and that CtrA and CtrA~P freely diffuse within the cytoplasm. For a cell of length L ≈ 4 μm and a CtrA diffusion constant of D ≈ 1–10 μm2/s (Materials and Methods and Fig. S1C), the time scale required to diffuse between the two poles is τD ≈ L2/2D ≈ 1–10 s. We then determined that if the rates of CtrA phosphorylation and dephosphorylation are fast compared with 1/τD, a gradient of CtrA~P can be produced while maintaining a uniform distribution of CtrA protein (Figs. 1E and 2A). We experimentally measured the half-life of the phosphoryl group on CtrA~P in predivisional cells to be on the order of tens of seconds or less, suggesting that there are indeed high rates of both phosphorylation and dephosphorylation (Fig. S3), which could produce a gradient. Incorporating ChpT into our model did not disrupt the spatial asymmetry of CtrA~P, even if ChpT is free to diffuse (Fig. S4A). The gradient was also insensitive to whether CckA activity was assumed to be spread across the entire pole or concentrated in a region as small as 50 nm (Fig. S4B).
Fig. 2.

CtrA activity is required for replication asymmetry in predivisional cells. (A) Mathematical modeling of the spatial distribution of CtrA phosphorylation in wild-type and mutant strains disrupted for CckA kinase activity (divLts) or CckA phosphatase activity [cckA(V366P)]. For wild type the phosphorylation and dephosphorylation rates, σk and σp, respectively, are 100/s and 10/s; for divLts, σk = 0; for cckA(V366P), σp = 0. The predicted patterns of CtrA~P relative to the total CtrA concentration are shown as a function of position along a 1D, 2-μm cell and in the predivisional cell schematics. (B) Experimental design for examining DNA replication in cckAts and divLts cells. At time t = 0, a mixed population of cells harboring the tet fluorescent reporter-operator system and grown at 28 °C (cckAts) or 30 °C (divLts) was placed on an agarose pad for microscopy at 34 °C. Phase contrast and epifluorescence microscopy were used to follow late predivisional cells that divided immediately after beginning a time-lapse movie. Both daughter cells inherit a single chromosome that replicates, leading to two origin foci. At the restrictive temperature of 34 °C, cckAts and divLts cells do not divide; we then examined the spatial pattern of subsequent DNA replication events. (C) Frames from a representative time-lapse movie of divLts cells showing bipolar replication (left cell) and unipolar replication from the stalked pole (right cell). (D) Quantification of the spatial patterns of DNA replication in wild-type, cckAts, divLts, and cckA(V366P) cells. Temperatures and numbers of replicating cells examined are indicated.
Because the direct observation of a protein phosphorylation gradient is currently intractable, we used our model to systematically alter the gradient via perturbation of CckA localization and function and then verified these predictions using a variety of mutants. Our model predicts that a gradient of CtrA~P would be substantially reduced or eliminated by removing (i) the kinase activity of CckA alone, (ii) both the kinase and phosphatase activity, or (iii) the phosphatase activity alone (Fig. 2A). In each case, the absence of a source and/or sink of CtrA~P would lead to a near-uniform distribution of CtrA~P, which should reduce or eliminate the stalked pole bias in replicative asymmetry of predivisional cells and should, in the first two cases, also lead to an increase in the fraction of cells replicating bipolarly (Fig. 2A).
To test our predictions regarding the relationship between CtrA activity and replicative asymmetry, we first examined DNA replication in cells harboring the TetR-tetO system and either a divLts or cckAts mutation. Both mutations lead to a decrease in CtrA activity when shifted from a permissive to restrictive temperature (18, 19). For divLts, CckA kinase activity is likely reduced at the restrictive temperature (16), whereas the cckAts mutation probably affects both kinase and phosphatase activities. We placed a mixed population of cells (for both cckAts and divLts) on agarose pads at the restrictive temperature of 34 °C and followed late predivisional cells, which divided once but not again owing to the loss of CtrA activity, even without adding cephalexin (Fig. 2 B and C). We then examined the spatial pattern of new rounds of DNA replication in these cells, assessing whether replication occurred at the old/stalked pole, the new/swarmer pole, or both.
In the divLts and cckAts strains, the loss of CckA kinase activity and consequent reduction in CtrA~P at 34 °C completely eliminated the asymmetry of replication (Fig. 2D). For divLts cells that replicated unipolarly, 51% initiated at the stalked pole and 49% at the swarmer pole. For cckAts cells that replicated unipolarly, 46% of cells initiated at the stalked pole and 54% at the swarmer pole. By contrast, for wild-type cells at 34 °C that replicated unipolarly, 85% initiated at the stalked pole. In agreement with our prediction of uniform CtrA~P levels, the divLts and cckAts strains also exhibited increases in bipolar firings; 53% of divLts cells and 30% of cckAts cells at 34 °C replicated bipolarly, compared with just 4% in wild type (Fig. 2D). As a control, we verified that these losses in asymmetry were not attributable to differences in cell length in the mutant strains (Fig. S5). The timing of replication was also substantially faster in the mutant strains, with replication at the stalked pole in divLts and cckAts cells occurring an average of 45 and 43 min, respectively, earlier than in wild-type predivisional cells at 34 °C. Earlier replication likely reflects a loss of CtrA-mediated inhibition of the origin of replication. In sum, our data indicate that replicative asymmetry is eliminated in divLts and cckAts cells at 34 °C owing to a loss in CckA kinase activity.
CckA Phosphatase Activity Is Important for Generating a CtrA Activity Gradient.
To test the importance of CckA phosphatase activity in forming a CtrA~P gradient, we replaced the chromosomal copy of cckA with cckA(V366P). CckA(V366P) retains kinase activity but has significantly diminished phosphatase activity in vitro (10) and leads to a significantly longer half-life of the phosphoryl group on CtrA~P in vivo (Fig. S3). Using the TetR-tetO system, we confirmed our prediction that predivisional cells of the cckA(V366P) strain would also exhibit a dramatically decreased spatial replication bias, with 53% of origins coming from the stalked pole and 45% from the swarmer pole (Fig. 2D). Additionally, cckA(V366P) predivisional cells took an average of ≈10 min longer before initiating DNA replication than wild-type cells (P = 0.0003, two-sided t test). This delay is likely due to an increase in the overall levels of CtrA~P, resulting from a loss of CckA phosphatase activity. If the V366P mutation had simply increased kinase activity rather than eliminating phosphatase activity, our model predicts that CtrA~P asymmetry would be retained. Thus, the combination of decreased asymmetry and slower replication implies that CckA at the stalked pole is not inert (11) but is actively dephosphorylating CtrA to help form a CtrA~P gradient.
Replicative Asymmetry Depends on Direct Repression of the Origin by CtrA.
CtrA has two distinct functions: direct repression of the origin and transcriptional regulation of cell-cycle genes (6, 7). To show that replicative asymmetry depends on CtrA~P binding to the origin rather than indirectly on CtrA-dependent transcription, we used strains in which either two or three of the five CtrA~P binding sites at the origin were mutated to severely disrupt CtrA~P binding (20) (Fig. 3A). These strains still harbor wild-type copies of ctrA, cckA, and divL and exhibit relatively normal cellular morphology and doubling times, suggesting that CtrA transcriptional activity is not significantly affected. For the strain with two mutated binding sites, we observed a weaker spatial bias, with 58% of cells replicating from the stalked pole and 31% from the swarmer pole (Fig. 3B). The strain in which three of the five CtrA binding sites were mutated exhibited a further reduction in replicative asymmetry, with 51% of cells replicating from the stalked pole and 31% from the swarmer pole (Fig. 3B). We predict that mutating all five CtrA binding sites would completely eliminate spatial bias, but such strains could not be examined because they are extremely sick, likely because removing all CtrA binding sites eliminates other critical, overlapping elements of the origin.
Fig. 3.

Asymmetry of replication depends on direct CtrA repression of the origin. (A) Schematic of CtrA binding sites in the origin of replication of wild type and the “bd” and “bcLd” mutants (20), which have mutations in two or three sites, respectively. (B) Quantification of spatial patterns of DNA replication in wild-type and origin mutants. Cells were examined as in Fig. 2C at 30 °C. (C) Markov model for concentration dependence of the average time before all CtrA~P binding sites are left unoccupied, thereby allowing for DNA replication initiation. Rates of binding (σb = 0.001/s) and unbinding (σu = 0.005/s) were selected to reproduce the average firing time in wild-type cells. Polar concentrations (dashed lines) were translated into approximate molecule counts using a DNA-interaction volume of 105 nm3, and the heights of the shaded triangles indicate the degree of asymmetry between the stalked pole (Left) and swarmer pole (Right). As the number of CtrA binding sites increases from two to four (green line to red line), the height of the shaded triangle increases, indicating an expected increase in the asymmetry of firing times between the stalked and swarmer poles.
The effects of mutating the origin on replicative asymmetry were captured in a Markov chain model in which CtrA~P molecules rapidly bind to and dissociate from the origin, with replication initiating only when all binding sites are unoccupied (Fig. 3C). This model predicts that the difference in firing times at opposite poles should decrease in the presence of fewer CtrA binding sites in a manner consistent with our experimental results (SI Materials and Methods). Hence, our data collectively indicate that a spatial gradient of phosphorylation dictates CtrA's propensity to bind and repress the origins in different regions of predivisional cells and that the dependence of origin firing on CtrA~P concentration can be altered by perturbing the regulation of CtrA~P in trans or the binding of CtrA~P in cis.
Fundamental Criteria for Generating Phosphorylation Asymmetry.
Our experimental readout provides information on CtrA activity only near the poles where the origins of replication are anchored. Although there are not yet tools to measure the complete spatial distribution of phosphorylated CtrA, our mathematical modeling predicts that a sufficiently fast-acting source and sink for phosphorylation localized at opposite poles would produce a linear gradient of CtrA~P. To test whether other mechanisms could explain our data, we used the model to investigate the range of kinetic parameters that produce robust gradients, whether gradient formation relies on localization of both the source and the sink, and the role of localized synthesis and proteolysis in gradient formation.
We first exhaustively explored the ranges of possible phosphorylation and dephosphorylation rates that would support a substantial steady-state gradient of CtrA~P and uncovered a general rule that a robust gradient requires both rates to be faster than the inverse diffusive time scale 1/τD ≈ 1/s (Fig. 4A). The phosphorylation and dephosphorylation rates for CtrA in vivo are likely 50–100/s (Materials and Methods), suggesting that cells operate well above the threshold necessary to produce a substantial gradient of CtrA~P. We then used the model to assess whether a gradient can be produced if either the CckA kinase or phosphatase activity is delocalized. We also considered a scenario in which CckA phosphatase activity at the pole is slow, but an additional delocalized phosphatase for CtrA exists (10). Our simulations indicated that, provided the overall rates of phosphorylation and dephosphorylation remained faster than 1/τD, the formation of a gradient was robust to delocalization of one but not both activities (Fig. S6).
Fig. 4.

Both kinase and phosphatase activities of CckA must be fast to produce a CtrA~P gradient. (A) Mathematical modeling of the spatial asymmetry in CtrA~P across a 1D cell for varying kinase and phosphatase rates. A substantial gradient is obtained only when CtrA phosphorylation and dephosphorylation are faster than the inverse of the time scale required for diffusion across the cell, 1/τD = 2D/L2. Degradation and synthesis are not included in these simulations because they have little effect on the gradient unless the half-life is shorter than τD. (B) Schematic of protein localization patterns in Caulobacter resulting in formation of a gradient of CtrA~P in predivisional cells. Cell division reinforces the asymmetric distribution of CtrA~P, resulting in daughter cells with different replicative capacities and fates. (C) Schematic of the CckA/ChpT/CtrA phosphorelay. When stimulated by DivL at the swarmer pole, CckA operates as a kinase, resulting in phosphorylation of ChpT and, ultimately, CtrA. When unstimulated at the stalked pole, CckA operates as a phosphatase, driving dephosphorylation of CtrA~P.
Finally, we used our model to address the potential roles of localized CtrA synthesis or proteolysis in gradient formation. We assumed that synthesis produces unphosphorylated CtrA, whereas degradation does not distinguish between CtrA and CtrA~P. Although the absolute levels of CtrA activity will depend on total CtrA protein levels, our model predicts that the shape of the gradient (and hence the relative asymmetry) is insensitive to the location or amount of CtrA synthesis, because diffusion between the poles is fast relative to the rate of CtrA synthesis. Because the protease for CtrA is often polarly localized in stalked cells (21), we also considered a model in which CtrA proteolysis is concentrated at the stalked pole. Such asymmetry in proteolysis also did not significantly affect a gradient of CtrA~P unless the half-life of CtrA protein was comparable to, or shorter than, τD (on the order of seconds or faster) (Fig. S7A). However, we measured a half-life for CtrA in predivisional cells of ≈60 min (Fig. S7 B and C), several orders of magnitude too slow to impact a phosphorylation gradient. Moreover, if the rate of proteolysis at the stalked pole were comparable to 1/τD, a clear signature would be a gradient of CtrA protein, which we do not observe with YFP-CtrA. Finally, we note that although the protease for CtrA is often localized in stalked cells, it is usually dispersed in predivisional cells (21), and our model predicts that dispersed proteolysis at a rate that is slow compared with 1/τD would also not significantly impact a phosphorylation gradient. We conclude that replicative asymmetry depends primarily on the phosphorylation and dephosphorylation of CtrA and not on proteolysis or synthesis, specifically because phosphorylation state can be modified on time scales faster than diffusion.
Discussion
Spatial homogeneity of a protein's abundance throughout the cell does not necessitate spatial homogeneity of the protein's activity. Here, we provide evidence that although YFP-CtrA is uniformly distributed in a Caulobacter predivisional cell, CtrA~P forms a gradient. We observed a remarkable spatial bias for DNA replication in predivisional cells, with initiation occurring much more frequently at the stalked pole. Because chromosomal origins are tethered to opposite poles in Caulobacter predivisional cells and are silenced by CtrA~P, this replication bias reflects an underlying asymmetry in CtrA phosphorylation at the poles. This asymmetry in CtrA phosphorylation depends on the bifunctional enzyme CckA. Although localized to both poles, our data suggest a difference in activity state of polar CckA in predivisional cells, with a strong bias toward the kinase state at the swarmer pole and toward the phosphatase state at the stalked pole (Fig. 4B). The gradient of phosphorylated CtrA identified here thus establishes replicative asymmetry before cytokinesis, which then locks in the existing spatial bias in CtrA activity.
Although it is often assumed that diffusion eliminates spatial variations in protein concentrations at this short length scale and on time scales relevant to cell division, our data indicate that phosphorylated CtrA, a freely diffusible protein, forms a robust gradient. Given the prevalence of two-component signaling systems in bacteria, there may be other regulators that have uniform protein distribution but spatially heterogeneous activity. Our work reveals a pressing need for phosphorylation state-specific reporters of bacterial proteins. There may also be other enzyme pairs with opposing, spatially segregated activities that can produce gradients, such as the diguanylate cyclases and phosphodiesterases that produce and degrade, respectively, the bacterial second messenger c-di-GMP (22). In sum, although the advent and application of GFP technology has clearly demonstrated that bacterial proteins can be targeted to specific cellular locations, our results suggest yet another level of spatial organization operating on protein activity.
Materials and Methods
Microscopy.
Imaging was performed on a Zeiss Axiovert 200 microscope with a 63× phase objective fitted with an objective heater (Bioptechs). The stage was fitted with a culture dish heater (Warner Instruments). Imaging was performed at 30 °C or 34 °C. We examined divLts and cckAts strains at 34 °C because at 37 °C, under our movie conditions, many cells failed to segregate their chromosomes; individual origin foci increased in intensity, indicating rereplication had occurred, but segregation of the new origins was impaired.
For analysis of synchronized cells, the stalked pole was determined as the pole proximal to the initial, single origin. For analysis of unsynchronized cells, we followed the two daughter cells of each mother cell that was in the late predivisional stage at the beginning of the movie. The poles of the mother cell become the stalked poles of each daughter cell, whereas the two poles formed upon cytokinesis of the mother cell become the nascent swarmer poles of each daughter cell in the predivisional stage. Fluorescence images were taken every 6 min, and origin firing was designated as bipolar if the two origins in a predivisional cell fired within one frame of each other. Replication patterns were counted in cells that replicated; some cells did not grow or lysed, presumably owing to the effects of growth on cephalexin or on an agarose pad. To confirm the quantification of replication patterns, a member of the laboratory who did not collect the microscopy data performed a blind quantification of two strains [wild type and cckA(V366P)]. The results fit within the error bars shown in Fig. S8.
Reaction–Diffusion Model of CtrA~P Dynamics.
We developed a reaction–diffusion model of the CckA/DivL/CtrA system consisting of two equations describing the spatial and temporal evolution of the [CtrA] and [CtrA~P] densities:
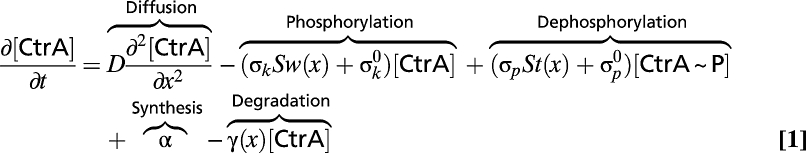 |
 |
We used the Einstein relation (D = kBT/6πηR) and the 23-kDa molecular mass of CtrA to estimate an upper bound on the CtrA diffusion constant D ≈ 8 μm2/s. Our FRAP studies demonstrated full recovery of photobleaching at the poles within 1–8 s in the majority of cells examined (Fig. S1C), indicating that D ≈ 1–10 μm2/s. For all calculations, we assume D = 2 μm2/s and is independent of phosphorylation state. Any reduction in D caused by factors such as DNA binding only enhances the gradient of CtrA~P. The functions Sw(x) and St(x) are 1 at the swarmer and stalk poles, respectively, and zero elsewhere. The poles occupy 1/8 of the cell length, except in Fig. S4B, where they range from 1/8 to 1/40 of the cell length. The uniform appearance of YFP-CtrA indicates that CtrA does not spend a significant amount of time in an immobile bound state, hence the rate constants σk and σp representing the phosphorylation and dephosphorylation of CtrA, respectively, are assumed to be linearly dependent on the concentration of CckA. Unless otherwise stated, we set these rates at 100/s and 10/s, respectively, which are conservative, lower-bound estimates. For predivisional cells with CtrA and stalked pole-localized CckA numbering 10,000 (15) and 50 molecules, respectively, a half-life of the phosphoryl group on CtrA~P on the order of seconds (Fig. S3) implies a rate of CtrA dephosphorylation by each CckA molecule on the order of 100/s. The rate of CtrA phosphorylation must be even faster because there is a net accumulation of phosphorylated CtrA in predivisional cells. We assume that other cytoplasmic sources of phosphorylation and dephosphorylation are uniformly distributed and, except for Fig. S6, are slow enough (0.1/s) to only define the overall levels of CtrA~P in the absence of CckA.
To analyze CtrA~P asymmetry in mutants, we set σk = 0 for divLts and σp = 0 for cckA(V366P). For divLts, we assume that CckA remains as a phosphatase at the swarmer pole. In Figs. 1E and 2A, we ignore CtrA synthesis (α = 0) and proteolysis (γ = 0). In Fig. S8, we investigate the effects of stalk pole-localized proteolysis using the function γ(x) = γ0St(x). The phosphorylated fraction of CtrA determined by Eqs. 1 and 2 is independent of the amount of CtrA protein.
For additional methods including strain construction details, see SI Materials and Methods and Table S1.
Supplementary Material
Acknowledgments
We thank Z. Gitai, N. Wingreen, R. Phillips, T. Ursell, and J. Modell for comments on the manuscript; and C. Aakre for help in constructing strain ML1876. M.T.L. is an Early Career Scientist at the Howard Hughes Medical Institute. This work was supported by National Institutes of Health (NIH) Grant 5R01GM082899 (to M.T.L.) and by NIH Director's New Innovator Award DP2OD006466 (to K.C.H). K.J. is supported by a research fellowship from the German Research Foundation.
Footnotes
The authors declare no conflict of interest.
*This Direct Submission article had a prearranged editor.
This article contains supporting information online at www.pnas.org/lookup/suppl/doi:10.1073/pnas.1015397108/-/DCSupplemental.
References
- 1.Lander AD. Morpheus unbound: Reimagining the morphogen gradient. Cell. 2007;128:245–256. doi: 10.1016/j.cell.2007.01.004. [DOI] [PubMed] [Google Scholar]
- 2.Dehmelt L, Bastiaens PI. Spatial organization of intracellular communication: Insights from imaging. Nat Rev Mol Cell Biol. 2010;11:440–452. doi: 10.1038/nrm2903. [DOI] [PubMed] [Google Scholar]
- 3.Parent CA, Blacklock BJ, Froehlich WM, Murphy DB, Devreotes PN. G protein signaling events are activated at the leading edge of chemotactic cells. Cell. 1998;95:81–91. doi: 10.1016/s0092-8674(00)81784-5. [DOI] [PubMed] [Google Scholar]
- 4.Berg HC, Purcell EM. Physics of chemoreception. Biophys J. 1977;20:193–219. doi: 10.1016/S0006-3495(77)85544-6. [DOI] [PMC free article] [PubMed] [Google Scholar]
- 5.Raskin DM, de Boer PA. MinDE-dependent pole-to-pole oscillation of division inhibitor MinC in Escherichia coli. J Bacteriol. 1999;181:6419–6424. doi: 10.1128/jb.181.20.6419-6424.1999. [DOI] [PMC free article] [PubMed] [Google Scholar]
- 6.Quon KC, Yang B, Domian IJ, Shapiro L, Marczynski GT. Negative control of bacterial DNA replication by a cell cycle regulatory protein that binds at the chromosome origin. Proc Natl Acad Sci USA. 1998;95:120–125. doi: 10.1073/pnas.95.1.120. [DOI] [PMC free article] [PubMed] [Google Scholar]
- 7.Laub MT, Chen SL, Shapiro L, McAdams HH. Genes directly controlled by CtrA, a master regulator of the Caulobacter cell cycle. Proc Natl Acad Sci USA. 2002;99:4632–4637. doi: 10.1073/pnas.062065699. [DOI] [PMC free article] [PubMed] [Google Scholar]
- 8.Matroule JY, Lam H, Burnette DT, Jacobs-Wagner C. Cytokinesis monitoring during development; rapid pole-to-pole shuttling of a signaling protein by localized kinase and phosphatase in Caulobacter. Cell. 2004;118:579–590. doi: 10.1016/j.cell.2004.08.019. [DOI] [PubMed] [Google Scholar]
- 9.Biondi EG, et al. Regulation of the bacterial cell cycle by an integrated genetic circuit. Nature. 2006;444:899–904. doi: 10.1038/nature05321. [DOI] [PubMed] [Google Scholar]
- 10.Chen YE, Tsokos CG, Biondi EG, Perchuk BS, Laub MT. Dynamics of two Phosphorelays controlling cell cycle progression in Caulobacter crescentus. J Bacteriol. 2009;191:7417–7429. doi: 10.1128/JB.00992-09. [DOI] [PMC free article] [PubMed] [Google Scholar]
- 11.Angelastro PS, Sliusarenko O, Jacobs-Wagner C. Polar localization of the CckA histidine kinase and cell cycle periodicity of the essential master regulator CtrA in Caulobacter crescentus. J Bacteriol. 2010;192:539–552. doi: 10.1128/JB.00985-09. [DOI] [PMC free article] [PubMed] [Google Scholar]
- 12.Marczynski GT. Chromosome methylation and measurement of faithful, once and only once per cell cycle chromosome replication in Caulobacter crescentus. J Bacteriol. 1999;181:1984–1993. doi: 10.1128/jb.181.7.1984-1993.1999. [DOI] [PMC free article] [PubMed] [Google Scholar]
- 13.Robinett CC, et al. In vivo localization of DNA sequences and visualization of large-scale chromatin organization using lac operator/repressor recognition. J Cell Biol. 1996;135:1685–1700. doi: 10.1083/jcb.135.6.1685. [DOI] [PMC free article] [PubMed] [Google Scholar]
- 14.Viollier PH, et al. Rapid and sequential movement of individual chromosomal loci to specific subcellular locations during bacterial DNA replication. Proc Natl Acad Sci USA. 2004;101:9257–9262. doi: 10.1073/pnas.0402606101. [DOI] [PMC free article] [PubMed] [Google Scholar]
- 15.Judd EM, Ryan KR, Moerner WE, Shapiro L, McAdams HH. Fluorescence bleaching reveals asymmetric compartment formation prior to cell division in Caulobacter. Proc Natl Acad Sci USA. 2003;100:8235–8240. doi: 10.1073/pnas.1433105100. [DOI] [PMC free article] [PubMed] [Google Scholar]
- 16.Iniesta AA, Hillson NJ, Shapiro L. Cell pole-specific activation of a critical bacterial cell cycle kinase. Proc Natl Acad Sci USA. 2010;107:7012–7017. doi: 10.1073/pnas.1001767107. [DOI] [PMC free article] [PubMed] [Google Scholar]
- 17.Sciochetti SA, Ohta N, Newton A. The role of polar localization in the function of an essential Caulobacter crescentus tyrosine kinase. Mol Microbiol. 2005;56:1467–1480. doi: 10.1111/j.1365-2958.2005.04652.x. [DOI] [PubMed] [Google Scholar]
- 18.Jacobs C, Domian IJ, Maddock JR, Shapiro L. Cell cycle-dependent polar localization of an essential bacterial histidine kinase that controls DNA replication and cell division. Cell. 1999;97:111–120. doi: 10.1016/s0092-8674(00)80719-9. [DOI] [PubMed] [Google Scholar]
- 19.Wu J, Ohta N, Zhao JL, Newton A. A novel bacterial tyrosine kinase essential for cell division and differentiation. Proc Natl Acad Sci USA. 1999;96:13068–13073. doi: 10.1073/pnas.96.23.13068. [DOI] [PMC free article] [PubMed] [Google Scholar]
- 20.Bastedo DP, Marczynski GT. CtrA response regulator binding to the Caulobacter chromosome replication origin is required during nutrient and antibiotic stress as well as during cell cycle progression. Mol Microbiol. 2009;72:139–154. doi: 10.1111/j.1365-2958.2009.06630.x. [DOI] [PubMed] [Google Scholar]
- 21.McGrath PT, Iniesta AA, Ryan KR, Shapiro L, McAdams HH. A dynamically localized protease complex and a polar specificity factor control a cell cycle master regulator. Cell. 2006;124:535–547. doi: 10.1016/j.cell.2005.12.033. [DOI] [PubMed] [Google Scholar]
- 22.Christen M, et al. Asymmetrical distribution of the second messenger c-di-GMP upon bacterial cell division. Science. 2010;328:1295–1297. doi: 10.1126/science.1188658. [DOI] [PMC free article] [PubMed] [Google Scholar]
Associated Data
This section collects any data citations, data availability statements, or supplementary materials included in this article.