

Abstract
Abscisic acid (ABA) has shown efficacy in the treatment of diabetes and inflammation; however, its molecular targets and the mechanisms of action underlying its immunomodulatory effects remain unclear. This study investigates the role of peroxisome proliferator-activated receptor γ (PPAR γ) and lanthionine synthetase C-like 2 (LANCL2) as molecular targets for ABA. We demonstrate that ABA increases PPAR γ reporter activity in RAW 264.7 macrophages and increases ppar γ expression in vivo, although it does not bind to the ligand-binding domain of PPAR γ. LANCL2 knockdown studies provide evidence that ABA-mediated activation of macrophage PPAR γ is dependent on lancl2 expression. Consistent with the association of LANCL2 with G proteins, we provide evidence that ABA increases cAMP accumulation in immune cells. ABA suppresses LPS-induced prostaglandin E2 and MCP-1 production via a PPAR γ-dependent mechanism possibly involving activation of PPAR γ and suppression of NF-κB and nuclear factor of activated T cells. LPS challenge studies in PPAR γ-expressing and immune cell-specific PPAR γ null mice demonstrate that ABA down-regulates toll-like receptor 4 expression in macrophages and T cells in vivo through a PPAR γ-dependent mechanism. Global transcriptomic profiling and confirmatory quantitative RT-PCR suggest novel candidate targets and demonstrate that ABA treatment mitigates the effect of LPS on the expression of genes involved in inflammation, metabolism, and cell signaling, in part, through PPAR γ. In conclusion, ABA decreases LPS-mediated inflammation and regulates innate immune responses through a bifurcating pathway involving LANCL2 and an alternative, ligand-binding domain-independent mechanism of PPAR γ activation.
Keywords: Inflammation, Ligand-binding Protein, Lipopolysaccharide (LPS), Macrophage, Mouse, Lanthionine C-like Receptor 2 (LanCL2), Peroxisome Proliferator-activated Receptor gamma
Introduction
Abscisic acid (ABA)3 is an isoprenoid phytohormone discovered in the early 1960s that has received some recent attention due to its medicinal applications (1). Specifically, oral ABA administration has shown prophylactic and therapeutic efficacy in mouse models of diabetes, inflammatory bowel disease, and atherosclerosis (2–6). In line with the anti-diabetic effects of ABA, there is evidence that endogenously generated ABA at nanomolar concentrations can act locally and enhance the insulin-secreting ability of pancreatic β-cells (7). However, little is known about the role of ABA in the modulation of immune and inflammatory responses and the cellular and molecular mechanisms underlying its health effects.
Mechanistically, ABA activates peroxisome proliferator-activated receptor γ (PPAR γ) reporter activity in pre-adipocytes (4), and a deficiency of PPAR γ in immune cells impairs the ability of ABA to normalize blood glucose concentrations and ameliorate macrophage infiltration in the white adipose tissue of obese mice (3). PPAR γ is a nuclear hormone receptor and the molecular target of the thiazolidinedione (TZD) class of anti-diabetic drugs (8). Naturally occurring and endogenous agonists of PPARs include fatty acids, eicosanoids and botanicals (9). PPAR γ suppresses the expression of pro-inflammatory cytokines and chemokines by antagonizing the activities of transcription factors, such as AP-1, STAT, and NF-κB (10), enhancing nucleocytoplasmic shuttling of the activated p65 subunit of NF-κB (11), and targeting co-repressor complexes onto inflammatory gene promoters (12). These molecular changes induced by PPAR γ agonists are linked to anti-inflammatory efficacy in mouse models of inflammatory bowel disease, encephalomyelitis, rheumatoid arthritis, and eosinophilic airway inflammation (13–15). There is also clinical evidence showing that rosiglitazone is efficacious in the treatment of mild to moderate ulcerative colitis in humans (16). However, TZDs are unlikely to be adopted for the treatment of chronic inflammation due to their significant side effects, including fluid retention, weight gain, bone fracture, congestive heart failure, and hepatotoxicity (17), that may be linked to their mechanism of action (18). In contrast to TZDs, the ABA-mediated activation of PPAR γ can be blocked by inhibiting intracellular cAMP production or protein kinase A (PKA) activity (2), suggesting that ABA triggers an alternative mechanism of PPAR γ activation. However, no data are available addressing whether ABA activates PPAR γ, like TZDs, by binding to its ligand-binding domain (LBD) or through an alternative mechanism involving indirect interactions with PPAR γ. In addition to PPAR γ, lanthionine C-like receptor 2 (LANCL2) has been proposed as a possible target for ABA in human granulocytes (19). LANCL2 is a member of the LanC-like protein family associated with the plasma membrane through myristoylation (20). However, it remains unknown whether the effects of ABA on PPAR γ are initiated via binding to LANCL2. This study characterizes the role of PPAR γ and LANCL2 as molecular targets of ABA in innate immunity, determines the role of PPAR γ in the immune modulatory properties of ABA during LPS-mediated inflammation, characterizes ABA-controlled gene regulatory networks, and elucidates the molecular mechanisms of action underlying the anti-inflammatory and immunoregulatory properties of ABA.
EXPERIMENTAL PROCEDURES
In Silico Docking of Abscisic Acid to PPAR γ
A model of PPAR γ for docking was developed based on analysis of various PPAR crystal structures with co-crystallized full agonists downloaded from the RCSB Protein Data Bank (PDB) (21). PDB code 3ET3 was selected as the primary model with the variable loop between helices H2′ and H3 from PDB code 2F4B used to fill in this missing portion of 3ET3. This structural model was based on re-docking studies and was evaluated to ensure that large scale testing with various compounds would allow for prediction of full agonism. Docking and analysis were conducted with AutoDock 4.2 (22, 23) and AutoDock Vina (27). Additional analysis and image generation was conducted with UCSF Chimera (25).
The Dundee PRODRG server (26) was used to generate a PDB file for ABA, and AutoDock Tools was used to generate PDBQT files for ABA and PPAR γ. Several different docking runs were conducted to assess the plausibility of ABA binding to PPAR γ. AutoDock Vina (27) was used to run a broad potential binding site search of the lower half of the PPAR γ LBD. PPAR γ is composed of three layers of α-helices sandwiched together. Helices H4 and H5 of the middle layer mark the boundary between the top and bottom portions. This lower region is characterized by a pocket surrounded by helices H2, H2′, H6, and H12 and portions of helices H3, H7, and H11. This binding cavity has been well established in the literature (28, 29) and therefore allowed for restriction of the search grid.
Three different grid box sizes were used, all of which possessed the largest spacing between grid points (1.000 Å) for AutoDock Vina. Each grid box represents the search area for docking. The first box covered the lower half of the LBD where the binding cavity is located. The second box was a reduced version of the first, which excluded most surface interactions and restricted the search to the interior-binding cavity. The final box was reduced in size to cover only the active site of the binding cavity where full agonists bind to induce PPAR γ activation. This last box size was chosen to provide a docking test to assess if ABA could adopt a favorable binding conformation within the known binding site for PPAR γ agonists. A total of 161 poses were returned from these initial docking studies.
To complement this initial testing, conventional AutoDock 4.2 methods were used to produce 1000 docking poses with the largest box dimensions and grid point spacing used for the AutoDock Vina test. The 1000 predicted poses were from a total of 10 AutoDock runs with 100 poses predicted for each execution. Another set of 1000 poses was predicted with a similar box size, but with a smaller grid point spacing (0.375 Å) to refine pose prediction. Free energy of binding values for the 2161 poses was evaluated, and binding sites for ABA were evaluated based on clustering of docked conformations. Examining free energy of binding, clustering of docked conformations, and distance measures between key atoms allowed for predictions to be made concerning plausibility of binding.
In Silico Docking of Abscisic Acid to LANCL2
Recently, Sturla et al. (19) provided in vitro results suggesting that the LANCL2 is a membrane-associated protein required for ABA binding on the membrane of human granulocytes, and LANCL2 is necessary for transduction of the ABA signal into cell-specific functional responses in granulocytes but failed to identify an ABA-binding site on the surface of LANCL2. LANCL2 is a member of the eukaryotic lanthionine synthetase component C-like protein family, which is related to the bacterial lanthionine synthetase component C (20). To further understand the function of LANCL2 through its structure and to investigate whether ABA activates LANCL2 via direct binding to its extracellular domain, we performed homology modeling of human LANCL2 using the SWISS-MODEL Workspace (30). The template used was the crystal structure of human lanthionine synthetase component C-like protein 1 (LANCL1) (2.6 Å resolution, PDB code 3E6U, chain C), which shares 54% sequence identity and 71% sequence similarity with LANCL2 (31). Together, in silico PPAR γ and LANCL2 docking studies were used to generate hypotheses regarding the mechanisms of action of ABA.
PPAR γ Ligand Binding Assay
The ability of ABA to bind to the ligand-binding domain of PPAR γ was assessed experimentally using the Polar ScreenTM PPAR Competitor Assay, Green (Invitrogen), following the manufacturer's instructions. Briefly, concentrations of (+)-ABA (Sigma), (−)-ABA (Sigma), and rosiglitazone (Cayman Chemical) ranging from 0.001 to 10 μm were added to wells containing the ligand-binding domain of PPAR γ bound to a fluorescent marker. After 4 h, the ability of each compound to displace the fluorescent ligand, and therefore reduce the polarization values, was assessed using a fluorescent plate reader with 485 nm excitation and 535 nm emission. Results are a compilation of four independent experiments.
Reporter Activity Assays
To determine PPAR γ activity, pCMX.PPAR γ expression plasmid and a pTK.PPRE3× luciferase reporter plasmid driven by the peroxisome proliferator responsive element-containing acyl-CoA oxidase promoter were purified using maxi kit from Qiagen (Valencia, CA). RAW 264.7 macrophages were cultured with DMEM (Mediatech, Manassas, VA) containing 10% fetal bovine serum (FBS) and grown until 60–70% confluence. Cells were co-transfected in each well with 0.6 μg plasmid of DNA and 10 ng of pRL reporter control using F-2 transfection reagents (Targeting Systems, Santee, CA) according to the manufacturer's protocol. After 24 h, transfected cells were seeded into white, opaque 96-well plates (BD Biosciences) at a concentration of 25,000 cells/well. To determine NF-κB reporter activity, cells were then transfected with 0.2 μg of pNF-κB reporter and 0.2 μg of pRL reporter control using the Lipofectamine 2000 transfection reagent (Invitrogen). Transfected cells were then treated in replicates of eight with rosiglitazone (Ros 1 μm; Cayman Chemical, Ann Arbor, MI), (+)-ABA (1.25, 2.5, 5, and 10 μm, Sigma), (−)-ABA (1.25, 2.5, 5, and 10 μm, Sigma), or vehicle (DMSO) and placed in a 37 °C incubator with 5% CO2. After 20 h, cells were harvested in reporter lysis reagent. Luciferase activity, normalized to pRL activity in the cell extracts, was determined by using the Dual-Luciferase II reporter assay system (Promega, Madison, WI) using a Modulus 96-well luminometer (Turner Biosystems, Sunnyvale, CA). All values were normalized to control wells to calculate relative luciferase activity.
LANCL2 siRNA and PPAR γ Co-transfections
RAW macrophages were transfected with the PPAR γ plasmid as described above with or without LANCL2 siRNA. Specifically, RAW macrophages were co-transfected with 0.2 μg of plasmid DNA and 0.25 μl of LANCL2 siRNA (20 μm) per well using the Lipofectamine 2000 transfection reagent (Invitrogen). After 48 h of incubation at 37 °C, RAW macrophages were treated in replicates of eight with ABA (1.25, 2.5, 5, or 10 μm), Ros (1 or 10 μm), or DMSO control and incubated for 24 h at 37 °C. After incubation, RAW macrophages were harvested in reporter lysis reagent, and luciferase activity was determined as described above. LANCL2 mRNA was measured by RT-PCR in control wells to assess the efficiency of knockdown.
Bone Marrow-derived Macrophage (BMM) Cultures
Bone marrow cells from PPAR γ flfl; MMTV-Cre− (flfl-Cre−), and flfl-Cre+ mice were cultured in DMEM with m-CSF (50 ng/ml) for 7 days. Fresh media with m-CSF was added on day 3. FACS analysis of BMM harvested at day 7 showed that under these conditions ≥90% of cells were CD11b+ F4/80+, corresponding to a macrophage phenotype. Following differentiation, macrophages were directly stimulated with LPS (100 ng/ml) as described previously for 12 h (32). ABA was added to macrophage cultures at a concentration of 2.5 μm. The effect of ABA on LPS/toll-like receptor 4 (TLR4)-mediated prostaglandin E2 (PGE2), leukotriene B4, and monocyte chemoattractant protein-1 (MCP-1) production by macrophages was examined in cell supernatants 12 h following the LPS challenge by using a commercial PGE2 EIA kit (Cayman Chemicals), a leukotriene B4 competitive binding assay (R&D Systems), and an MCP-1 ELISA (R&D Systems), respectively, per the manufacturer's instructions.
Mice and in Vivo Treatments
PPAR γ flfl; MMTV Cre+ (flfl-Cre+) conditional knock-out mice, lacking functional PPAR γ in all hematopoietic cells, and their flfl-Cre− control littermates in a C57BL/6 background were generated by using the Cre-lox recombination system as described previously (13, 33). Mice were fed control, ABA (100 mg/kg of diet, corresponding to an effective oral dose of 0.2 mg of ABA/mouse/day), or pioglitazone (70 mg/kg diet, 0.14 mg of pioglitazone/mouse/day)-supplemented diets for 36 days and then were challenged with Escherichia coli lipopolysaccharide (LPS) at 375 μg/kg in 0.1 ml of sterile saline solution intraperitoneally to induce systemic inflammation. All experimental procedures were approved by the Institutional Animal Care and Use Committee of Virginia Polytechnic Institute and State University and met or exceeded requirements of the USPHS, National Institutes of Health, and the Animal Welfare Act as amended.
Intracellular cAMP in CD3/CD28-stimulated Splenocytes and LPS-stimulated Macrophages
Spleens were excised from C57BL6/J mice under sterile conditions. Cells were released by disrupting the tissue between frosted glass slides, and red blood cells were lysed with erythrocyte lysis buffer. Splenocytes were enumerated with a Coulter counter (Beckman Coulter, Fullerton, CA) and seeded in cRPMI at 1 × 10⁶/ml onto 24-well plates pre-coated with anti-mouse CD3 (5 μg/ml; Pharmingen) and anti-mouse CD28 (1 μg/ml; Pharmingen). After 20 h of incubation in a 37 °C incubator with 5% CO2, cells were adapted to Hanks' buffered salt solution buffer for 30 min and then stimulated with ABA (0, 0.01, 1, and 10 μm) for 10 min. RAW 264.7 macrophages and BMM obtained as described above were adapted to DMEM without FBS for 12 h and then stimulated with ABA (1.25, 2.5, 5, and 10 μm) for 10 min. For intracellular assessment of cAMP, cells were harvested into 0.1 m HCl, and the lysates were collected. The cAMP concentration of the lysates was determined using an EIA kit (Assay Designs, Ann Arbor, MI).
Flow Cytometry
Mesenteric lymph nodes (MLN) and spleen-derived cells (2 × 10⁵ cells/well) or whole blood cells (10 μl/well) were seeded onto 96-well plates, centrifuged at 4 °C at 3000 rpm for 4 min, and washed with PBS containing 5% FBS and 0.09% sodium azide (FACS buffer). To assess differential monocyte/macrophage subsets, the cells were incubated in the dark at 4 °C for 20 min in FcBlock (20 μg/ml; Pharmingen), then for an additional 20 min with fluorochrome-conjugated primary antibodies anti-F4/80-PE-Cy5 (5 μg/ml, eBioscience), anti-CD11b-Alexa Fluor 700 (2 μg/ml, eBioscience), and anti-TLR-4-PE-Cy7 (2 μg/ml, eBioscience). For lymphocyte assessment, cells were incubated with anti-CD4-FITC (2 μg/ml; Pharmingen), anti-CD8-PerCp-Cy5.5 (2 μg/ml; eBioscience), CD3 PE-Cy5 (2 μg/ml; Pharmingen), anti-TLR-4 PE-Cy7, and anti-IL17A-PE (2 μg/ml; eBioscience) as shown previously (34). Flow results were computed with a BD LSR II flow cytometer, and data analyses were performed with FACS Diva software (BD Biosciences).
Microarray Data Analysis
After homogenization of spleens, total RNA was extracted and purified using the RNeasy system according to the manufacturer's instructions (Qiagen Valencia, CA). The Qiagen RNase-free DNase supplement kit was used to ensure that the RNA was free from DNA contamination. RNA was then processed and labeled according to the standard target labeling protocols, and the samples were hybridized, stained, and scanned per standard Affymetrix protocols at VBI Core Laboratory on Mouse 430 2.0 expression arrays (Affymetrix Inc., Santa Clara, CA). All statistical analyses of the data were performed within the R statistical environment, version 2.9.0 (35), using Bioconductor packages (36). Raw microarray data from CEL files were read with “affy” package (37) and pre-processed by gcRMA algorithm (GC Robust Multiarray Average) that performs the following three steps: (i) adjustment of the gene expression signal against the background caused by optical noise and nonspecific binding; (ii) robust multiarray normalization (38); and (iii) summarization of the probes belonging to each probe set. Empirical Bayes adjustment was applied, and p values were corrected for multiple testing. Genes associated with p < 0.1 were considered significantly modulated by LPS. The selected list of genes was analyzed with hypergeometric testing that applies Fisher's exact test to find association between interesting genes and membership within the KEGG pathway(s).
The microarray data (both raw and normalized) have been submitted to the Gene Expression Omnibus (GEO) (www.ncbi.nlm.nih.gov, data set GSE21013). The experiment followed a 2 × 2 factorial design with two factors,. LPS and ABA, each with two levels, absence and presence. Thus, there were four groups of mice as follows: LPS and ABA, LPS and control, no LPS and control, and no LPS and ABA. The design matrix, constructed in the package “limma,” defined coefficients for LPS main effect, ABA main effect, and the interaction effect. Linear modeling discovered 43 probe sets (genes) corresponding to the LPS-ABA interaction. These 43 probe sets were uploaded to IPA8.0 for Ingenuity Pathway Analysis (Ingenuity Systems, Redwood City, CA).
Real Time Quantitative RT-PCR Gene Expression Analyses
Total RNA (1 μg) from spleens was used to generate a cDNA template using the iScript cDNA synthesis kit (Bio-Rad) using conditions described previously (13). Each gene amplicon was purified with the MiniElute PCR purification kit (Qiagen) and quantitated on an agarose gel by using a DNA mass ladder (Promega). These purified amplicons were used to optimize real time PCR conditions and to generate standard curves in the real time PCR assay. Primer concentrations and annealing temperatures were optimized for the iCycler iQ system (Bio-Rad) for each set of primers using the gradient protocol of the system. PCR efficiencies were maintained between 92 and 105% and correlation coefficients above 0.98 for each primer set during optimization and also during the real time PCR of sample DNA. cDNA concentrations for genes of interest were examined by real time quantitative PCR using an iCycler IQ system by using a previously published protocol (13).
NF-κB and NFATC1 Activities
Spleens were diced into smaller pieces in lysis buffer containing dithiothreitol and a protease inhibitor mixture and then further disrupted using a Dounce ground glass homogenizer at 4 °C. Nuclear extraction for tissue homogenate and BMM was performed using the Nuclear Extract kit (Active Motif, Carlsbad, CA) per the manufacturer's instructions. The extracts were used to perform a Bradford-based assay for quantifying the protein concentrations and stored at −80 °C. NF-κB and NFATc1 activities were measured as described previously (13) by using the Trans-AMTM NF-κB p65 and the Trans-AMTM NFATc1 ELISA (Active Motif), respectively, per the manufacturer's instructions.
Statistical Analysis
Parametric data were analyzed by using the analysis of variance followed by Scheffe's multiple comparison method. Nonparametric data were analyzed by using the Mann-Whitney's U test followed by a Dunn's multiple comparisons test. Analysis of variance was performed by using the general linear model procedure of SAS (SAS Institute Inc., Cary, NC) (39). Statistical significance was assessed at a probability (p) value ≤0.05.
RESULTS
In Silico Docking of ABA to PPAR γ and LANCL2
To determine whether ABA is a functional ligand of PPAR γ, we first used an in silico approach to dock ABA to the PPAR γ LBD (supplemental Fig. 1A). Several groups have predicted the rear portion of the binding cavity proximal to helix H12 to be the site where ligand binding would induce activation of PPAR γ (29, 41, 42). The docking results showed that this site (S2) is not favored by ABA when the entirety of the binding cavity is evaluated for binding interactions. Instead, ABA energetically favored a mostly hydrophobic cleft near the opening of the binding cavity (S1) for all docking methods used where the grid boxes included this region. The predicted free energy of binding values ranged from −9.4 to −9.0 kcal/mol for poses in S1 (92.64% of 2161 poses) and −7.0 to −6.2 kcal/mol for poses in S2 (4.53% of 2161 poses). Given these predicted energies, it seems unlikely that it would be energetically favorable for ABA to diffuse past the more favorable opening surface through the binding cavity to the activation site at the rear of the cavity in order for PPAR γ activation to occur.
If ABA docking is tightly restricted to the region of the binding site expected for full agonism, the majority of returned poses show the hydrogen-bonding residues in the receptor site interacting with the ring structure head group rather than the carboxylate group, as typically observed with full agonists. Although the head group contains a single carbonyl group that could serve as a hydrogen bond acceptor and hydrogen bonding interactions are observed in the binding site in the docked complex, supplemental Fig. 2A experiments suggest that these interactions may not be sufficient to cause activation of the receptor. The carboxylate must be oriented toward the critical amino acid residues for activation to occur.
Because ABA did not appear to bind to the activation site of PPAR γ and given its purported signaling via LANCL2 in human granulocytes (19), we next examined the ability of ABA to bind to LANCL2. Data and details for this examination were previously published (51). Examination of the distribution of the binding sites on LANCL2 implied that ABA showed preferential binding to the loop regions of LANCL2. The red region on the LANCL2 with the highest population of clusters was considered as the potential binding site for ABA (supplemental Fig. 1B). The supplemental Fig. 2B shows a docked pose for the ABA pocket in LANCL2 after the binding site restricted grid area search. Two hydrogen bonds formed between the nitrogen atom in the side chain of LYS283 and two oxygen atoms of ABA that positioned ABA deep in the pocket and increased the affinity of ABA for LANCL2, although we do not know whether ABA binding induces a conformational change in LANCL2.
ABA Isomer-specific Effects on Transactivation of PPAR γ and cAMP Accumulation
We next examined the effect of ABA on PPAR γ in vitro. We have previously demonstrated that a racemic mixture of ABA isomers activates PPAR γ in 3T3-L1 preadipocytes (4). Here, we assessed the affect of the individual (+)- and (−)-ABA isomers on PPAR γ activation using the RAW 264.7 macrophage cell line (Fig. 1A). Both the (+)- and (−)-ABA isomers activated PPAR γ to a similar degree, inducing a maximal effect at 2.5 μm.
FIGURE 1.

In vitro effects of ABA isomers. For transient transfections, RAW 264.7 macrophages were transfected as described under “Experimental Procedures” before being exposed to increasing concentrations (1.25, 2.5, 5, or 10 μm) of (+)- or (−)-ABA, DMSO alone (no treatment), or rosiglitazone (1 μm) (A). After 20 h, the relative luciferase activity was assessed for each treatment. To assess the ability of the ABA isomers to bind PPAR γ, concentrations of (+)-ABA, (−)-ABA, or rosiglitazone ranging from 0.001–10 μm were assessed for their ability to displace a fluorescent ligand bound to the PPAR γ ligand-binding domain (B). Results are a compilation of four independent experiments. The ability of ABA to increase intracellular cAMP concentrations (C), lanthionine synthetase C-like 2 (LANCL2) (D), and PPAR γ (E) in CD3/CD28-stimulated splenocytes was assessed. The effect of ABA on cAMP concentrations in macrophages was determined (F). Data are presented as means ± S.E. of three independent experiments. Data points with an asterisk (p < 0.05) or a number sign (p < 0.0001) are significantly different.
To confirm our in silico findings indicating that ABA is not a ligand of PPAR γ, we next compared the ability of each ABA isomer and the synthetic PPAR γ ligand Ros to compete for binding to the PPAR γ LBD (Fig. 1B). Increasing the concentrations of ABA from 0.001 to 10 μm showed no ability of either ABA isomer to compete with the tracer for binding to the PPAR γ LBD, whereas Ros successfully competed for binding to the LBD and displaced the tracer. These findings indicate that ABA is not a PPAR γ ligand despite its ability to increase PPAR γ activity.
There have been recent reports indicating that ABA increases intracellular levels of cAMP (7, 44). Here, we show that splenocytes stimulated with CD3/CD28 show significantly increased intracellular cAMP when treated with ABA at 10 μm (Fig. 1C) without affecting phosphodiesterase activity (data not shown). The increased accumulation of intracellular cAMP was associated with up-regulation of PPAR γ and its reporter activity but not LANCL2 mRNA expression (Fig. 1, D and E). We also demonstrate that treatment of macrophages for 10 min with ABA induces a cAMP peak (10% over control) at 2.5 μm, thereby coinciding with the peak of maximal ABA-mediated PPAR γ activation. When compared with splenocytes, M1 macrophages exhibited a more narrow concentration range and relative insensitivity to ABA treatment in relation to cAMP generation (Fig. 1F).
Knockdown of LANCL2 Disrupts PPAR γ Activation
To measure the effect of LANCL2 knockdown on ABA- and Ros-induced PPAR γ activation, cells were first transfected with a PPAR γ expression and luciferase plasmids and treated with either racemic ABA or Ros (1 or 10 μm). As anticipated, ABA and Ros significantly elevated PPAR γ compared with untreated cells (Fig. 2A). In the same project, we assessed whether introduction of LANCL2 siRNA affects ABA or Ros-induced PPAR γ activation. Our data indicate that the addition of LANCL2 siRNA significantly disrupted PPAR γ activation (Fig. 2A), as neither ABA nor Ros significantly affected PPAR γ activity. The disruption of LANCL2 was 80% by quantitative RT-PCR (Fig. 2B).
FIGURE 2.

Effect of LANCL2 disruption on PPAR γ activation. A illustrates the effect of ABA (1.25, 2.5, 5, or 10 μm) and Ros (1 and 10 μm) on PPAR γ reporter activity in RAW 264.7 macrophages expressing normal levels of LANCL2 or following a knockdown of LANCL2 using siRNA. B illustrates the effect of siRNA on LANCL2 mRNA expression. The efficiency of LANCL2 knockdown was calculated by real time quantitative RT-PCR to be 80%. Data are presented as means ± S.E. of three independent experiments. Data points with an asterisk are significantly different from control (p < 0.05).
ABA Suppresses the Generation of Inflammatory Mediators by LPS-stimulated Macrophages
The macrophage is one of the cell types whose functions can be significantly regulated by PPAR γ agonists (10, 45). Because our findings indicated that PPAR γ agonism by ABA occurred without direct binding to the receptor, we next evaluated whether in vitro treatment of BMM mimicked the effects induced by other agonists, like the TZDs. We specifically measured if ABA could down-regulate the expression of pro-inflammatory mediators. We found that ABA significantly suppressed the ability of BMM to secrete monocyte chemoattractant protein 1 (MCP-1) and PGE2 in response to in vitro LPS stimulation as detected by ELISA and EIA, respectively, in cell culture supernatants (Fig. 3, A and B).
FIGURE 3.

ABA treatment down-regulates the production of MCP-1 (A) and PGE2 (B) in bone marrow-derived macrophages recovered from PPAR γ-expressing (flfl-Cre−) and conditional PPAR γ null (flfl-Cre+) mice and stimulated with LPS. Cell supernatants from macrophages treated with ABA (2.5 μm) or vehicle alone were collected at 12 h following LPS stimulation (* versus **, p < 0.05). Results are presented as means ± S.E. (n = 5).
Effect of ABA on Immune Cell Subsets Following an LPS Challenge
To assess whether ABA suppressed systemic inflammation, we administered control or ABA- or pioglitazone (PGZ)-supplemented diets for 36 days to immune cell-specific PPAR γ null mice or floxed littermates. Based on feed intake and dose in the diet, we estimate that mice were ingesting 0.2 mg of ABA or 0.14 mg of PGZ on a daily basis, which can be considered prophylactic doses. The concentrations of ABA and PGZ were chosen based on previously published ABA and TZD studies (2, 4). At the end of the treatment period, mice were challenged intraperitoneally with LPS, and the systemic inflammatory response was assessed at 6 h post-challenge. We examined immune cell subsets in peripheral blood, MLN, and spleen. ABA significantly increased the percentages of blood monocytes (defined as F4/80+CD11b+) in LPS-treated immune cell-specific PPAR γ null mice, although not in PPAR γ-expressing mice. In the MLN, both ABA and PGZ supplementation significantly suppressed the expression of TLR4 in F4/80+CD11b+ macrophages, an effect that could limit the extent of LPS-induced inflammation. In mice treated with LPS, ABA reduced TLR4 expression levels by macrophages in PPAR γ-expressing but not in immune cell-specific PPAR γ null mice suggesting either a PPAR γ dependence of this effect or indicating that PPAR γ is required for TLR4 expression, regardless of drug treatment. Both ABA and PGZ also significantly reduced the TLR4 expression in CD8+ T cells of non-LPS-treated mice (Fig. 4).
FIGURE 4.

Effect of ABA on TLR-4 expression in blood and MLN-derived immune cells in mice challenged with LPS. PPAR γ flfl; Cre− (flfl-Cre−) and PPAR γ flfl; MMTV Cre+ mice (flfl-Cre+), which lack PPAR γ in hematopoietic cells, were fed a control diet or diets supplemented with ABA or PGZ. Mice were injected with LPS (375 μg/kg) and euthanized after 6 h. Flow cytometry was performed on cells derived from blood and MLN to assess immune cell subsets affected by diet. Data are presented as means ± S.E. Data points with an asterisk indicate a significant difference from the respective control diet (p < 0.05). Results are presented as means ± S.E. of groups of 10 mice.
Microarray Analysis of Effect of ABA on LPS-mediated Inflammation in the Spleen
Immune cell-specific PPAR γ null mice or floxed littermates were fed control or ABA-supplemented diets and then intraperitoneally challenged with LPS (375 μg/kg). Global transcriptomic and network analyses were performed in spleen samples collected 6 h post-LPS challenge. Under the p value threshold of 0.1, more than 2000 genes were modulated by LPS in both data sets. Of these, 130 were discovered to be consistently modulated by LPS but unchanged in expression when diet was supplemented with ABA. Filtering on the fold-change (at least 2-fold induction by LPS) extracted 64 genes that were either up- or down-regulated by LPS, but this transcriptional effect was lessened in the presence of ABA in diet (supplemental Fig. 3). After applying hierarchical clustering on these genes, a heat map was generated. Regardless of the direction (up or down) of modulation, the magnitude of gene expression (fold-change) was attenuated by ABA (as seen in lighter color on the right column of supplemental Fig. 3). Four genes that emphatically responded to LPS challenge (i.e. il-6, ifn-γ, tnf-α-induced protein 2, and chemokine ligand 11) were down-regulated by ABA. Fold induction caused by ABA (ABA effect) was calculated for both PPAR γ-expressing and immune cell-specific PPARγ-null mice (supplemental Fig. 4). The ABA effect is impaired (or abrogated) in the absence of functional immune cell PPAR γ.
Next, we performed hypergeometric testing on the 130 genes that were down-modulated by ABA. One pathway, aminoacyl-tRNA biosynthesis (KEGG Id 00970), was significantly associated with the ABA effect. Genes in this pathway were down-modulated by ABA (supplemental Table 1).
The network analyses performed in genes differentially regulated by ABA in LPS-challenged mice revealed a complex ABA-controlled network that illustrates a down-regulation of pro-inflammatory genes (il-6, il-1β, mif, and ifn-γ) and inflammatory signaling molecules such as c-jun and jak1, up-regulation of nuclear receptors (i.e. ppar γ, ppar α, rxrα, and rxrβ), an anti-inflammatory cytokine (i.e. tgf-β), the transient receptor potential cation channel, subfamily M, member 2 (trpm2), and the hypoxia-inducible factor (hif)-1α, a transcription factor driving glycolytic metabolism (supplemental Fig. 5A). Many of these transcriptional modulatory effects of ABA were abrogated or impaired in spleens recovered from immune cell-specific PPAR γ null mice (supplemental Fig. 5B).
Modulation of Inflammatory and PPAR γ-Responsive Gene Expression by ABA
The microarray analyses indicated that ABA suppressed the LPS-mediated induction of inflammatory genes in the spleen. Here, we determined whether some of these genes were differentially affected by real time RT-PCR. We provide evidence that ABA suppressed LPS-mediated up-regulation of tnf-α in a PPAR γ-dependent manner (Fig. 5A) but had no effect on inos mRNA expression (data not shown). Interestingly, ncoa6 mRNA expression was increased by ABA, regardless of the LPS challenge (Fig. 5B). In addition, ABA mitigated the LPS-mediated suppression of PPAR γ and glut4 (Fig. 5, C and D). These effects of ABA were abrogated in mice lacking PPAR γ in immune cells.
FIGURE 5.

Effect of dietary ABA on splenic gene expression following an intraperitoneal LPS challenge of PPAR γ-expressing (flfl-Cre−) and conditional PPAR γ null (flfl-Cre+) mice. Quantification of mRNA expression of TNF-α (A), nuclear receptor co-activator 6 (NCOA6) (B), PPAR γ (C), and Glut4 (D) in spleens of mice administered control or ABA-supplemented (100 mg/kg). Splenic samples were collected 6 h following an in vivo (intraperitoneal) challenge with LPS at 375 μg/kg in 0.1 ml of saline (* versus **, p < 0.05). Results are presented as means ± S.E. of groups of 10 mice.
Modulation of NF-κB and NFATc1 Activities by ABA
We next examined the effect of ABA on NF-κB and NFATc1 activation in spleens of LPS-challenged mice and found that although ABA did not affect NF-κB activity (Fig. 6A), it significantly decreased LPS-mediated activation of NFATc1 (Fig. 6B). We next quantified the effect of ABA on NF-κB activation of BMM following stimulation with LPS/IFN-γ and demonstrated that 2.5 μm ABA significantly decreased NF-κB p65 activity in nuclear extracts from PPAR γ-expressing primary macrophages (Fig. 6C). The loss of PPAR γ in macrophages resulted overall in greater NF-κB activity when compared with WT and further activation induced by ABA (Fig. 6C). We then performed an NF-κB reporter activity assay in 3T3-L1 cells (Fig. 6D) and RAW macrophages (data not shown) and demonstrated that ABA significantly suppressed NF-κB reporter activity in 3T3-L1 cells (Fig. 6D) but it increased it in RAW macrophages (data not shown). Of note, 3T3-L1 cells express endogenous PPAR γ, whereas RAW macrophages do not (46). In summary, these data demonstrate that ABA antagonizes inflammatory pathways via PPAR γ.
FIGURE 6.

Effect of ABA on splenic NF-κB and activated NFATc1 activation following a LPS challenge. The concentration of activated NF-κB (A) and nuclear factor of activated T-cells (B) in the spleens of control or LPS-challenged mice and bone marrow macrophages derived from wild-type (WT) or macrophage-specific PPAR γ null mice (flfl LysozymeM-Cre+) (C) was determined using an enzyme-linked immunosorbent-based assay. For the NF-κB reporter activity assay, 3T3-L1 cells were transfected as described under “Experimental Procedures” before being exposed to increasing concentrations (1.25, 2.5, 5, or 10 μm) of ABA, DMSO alone (no treatment), or rosiglitazone (1, 5 and 10 μm). After 20 h, the relative luciferase activity was assessed for each treatment. *, p < 0.05. In vivo results are presented as means ± S.E. of groups of 10 mice. In vitro findings are representative results of three independent experiments run in triplicate.
DISCUSSION
ABA is a phytohormone that plays important roles in the plant life cycle (1). In addition to its effects in regulating plant response to stress, endogenous ABA activity has also been reported in fungi (47), marine sponges (48, 49), and more recently human granulocytes (50), monocytes (44), and pancreatic β-cells (7), suggesting that endogenously generated ABA may play an important role in regulating immune and inflammatory processes.
Our group demonstrated the pre-clinical efficacy of oral ABA administration in mouse models of obesity-related inflammation, diabetes, atherosclerosis, and inflammatory bowel disease (2–6). We demonstrated that ABA treatment activates PPAR γ in 3T3-L1 pre-adipocytes (4), and its blood glucose-lowering actions require the expression of PPAR γ in immune cells (3). Surprisingly, ABA synergizes with Ros to improve glucose tolerance and regulate macrophage accumulation in adipose tissue (2). Because Ros saturates the LBD of PPAR γ, the reported synergism between the compounds suggests that ABA might activate PPAR γ through an alternative mechanism that differs from that of TZDs. Indeed, this study demonstrates that both (+)- and (−)-ABA isomers can activate PPAR γ reporter activity in RAW macrophages. However, at the molecular level, the effect of ABA on PPAR γ is independent of direct binding to the LBD of this receptor. More specifically, results of docking studies indicate ABA does not bind to the portion of the PPAR γ-binding cavity that is associated with activation (29, 41, 42). Moreover, unlike TZDs, if ABA docking is restricted to this binding site, its ring head structure, rather than the carboxylate group, unexpectedly interacts with hydrogen-bonding residues. As such, many subsequent hydrophobic interactions necessary for activation-related conformational changes might be absent. The inability of ABA to bind directly to the site of agonism within the PPAR γ LBD is further validated by competitive ligand-binding assays demonstrating the inability of ABA to displace the tracer. Hence, this is the first study demonstrating that ABA activates PPAR γ independently of the PPAR γ LBD, suggesting the existence of a potential molecular target for ABA upstream of PPAR γ. Together, these molecular findings are consistent with previous in vitro evidence demonstrating that the ABA-induced activation of PPAR γ reporter activity can be inhibited through blocking cAMP production or inhibiting PKA activity (2), suggesting that upstream cAMP/PKA signaling may be required for the alternative activation of PPAR γ by ABA.
Bruzzone et al. (7) showed that ABA induced cAMP overproduction and PKA activation in insulin-secreting pancreatic β-cell lines. We previously reported increased intracellular cAMP accumulation in human aortic endothelial cells (5). Here, we demonstrate that ABA treatment of activated primary mouse splenocytes and macrophages increases cAMP accumulation, although the specific molecular events connecting a membrane-initiated mechanism leading to cAMP accumulation and activation of PPAR γ remain unknown. The G protein-coupled LANCL2 represents a possible membrane-associated target for ABA involved in the initiation of the cAMP signal in leukocytes that has been reported to play a role in the signaling of ABA in human granulocytes (19). We identified a putative ABA-binding site on the surface of LANCL2 and demonstrated that ABA treatment of splenocytes and macrophages results in increased cAMP accumulation. In addition, our molecular docking studies predicted that ABA and TZDs (e.g. Ros and PGZ) share a binding site on LANCL2 (51), thereby providing a nexus between signaling pathways and indicating that TZDs can bind both PPAR γ and LANCL2; docking studies suggest that ABA binds effectively to LANCL2 but binding of ABA to PPAR γ is at sites or in an orientation that does not activate this receptor. To investigate the importance of LANCL2 in ABA-mediated activation of PPAR γ, we determined whether knocking down LANCL2 in RAW macrophages by using siRNA impaired or abrogated the effect of ABA on PPAR γ reporter activity. Our findings indicate that knocking down about 80% of LANCL2 mRNA significantly attenuates the effect of ABA on PPAR γ activity. Interestingly, consistent with the prediction of our molecular model of LANCL2 indicating binding of Ros (51), the PPAR γ agonistic effects of Ros were also significantly diminished in siRNA-treated cells. These findings suggest that LANCL2 is an influential modulator of PPAR γ activity, although the mechanism underlying this effect is unclear. Sturla et al. (19) imply that LANCL2 may form an ABA-sensitive complex with Gi protein(s) upstream from adenylate cyclase. Indeed, LANCL2 could influence Gi either indirectly by inducing post-translational modifications or through binding interactions; the former would require LANCL2 to have an undiscovered catalytic function and the latter would not. Interestingly, GSH/GSSG interacts with LANCL1 and to a weaker extent with LANCL2 (31, 52), all of which provides evidence in support of potential catalytic functions in the LANCLs.
It is well accepted that Ros activates PPAR γ by binding directly to its LBD. In fact, our data corroborate this assertion. However, our virtual screening results demonstrate that Ros and other TZDs, in addition to binding PPAR γ, can also bind LANCL2 in the same region of the protein targeted by ABA (51); all of which suggests that TZDs target PPARs both directly binding to their LBD and indirectly by targeting the LANCL2 pathway. The cross-talk between PPAR γ and LANCL2 is not well understood, and further investigation into this molecular interaction may shed new light on the mechanistic components of this pathway linked to differences in efficacy and side effects (i.e. ABA versus TZD class).
Because LANCL2 is coupled to a pertussis toxin-sensitive G-protein that regulates the cAMP synthesizing activity of adenylate cyclase (19), the cAMP signaling pathway represents a likely mechanism underlying some of the immune modulatory actions of ABA. Furthermore, there is some evidence demonstrating that cAMP/PKA activation increases basal and ligand-induced PPAR γ activity (53), providing a basis for either cross-talk between the cAMP and PPAR γ pathways or the existence of a common cAMP/PKA/PPAR γ signaling axis. This pathway parallels findings related to the retinoic acid receptor (RAR) pathway, because RAR activity was significantly increased by cAMP-elevating agents (54). Like PPAR γ, RAR is a nuclear receptor that becomes activated primarily through ligand binding (i.e. retinoic acid for RAR and TZDs or lipids for PPAR γ) to its LBD, although LBD-independent activation is also possible and can be enhanced by cAMP/PKA. Although we demonstrated that ABA does not increase reporter activity of RXR or RAR (data not shown), our findings suggest that, like retinoic acid, ABA may favor the latter LBD-independent mechanism of PPAR γ activation. However, it remains unknown whether, by acting on membrane-initiated signaling, ABA can increase the sensitivity of PPAR γ to endogenously generated ligands acting on the LBD. Notably, the generation of these endogenous ligands would increase during inflammation, lending support to the theory that ABA plays an important role in regulating immune and inflammatory responses.
We next investigated the ability of ABA to modulate the production of inflammatory mediators both in BMM and in vivo following an LPS challenge in mice. Our in vitro findings demonstrate that ABA inhibits LPS-induced production of MCP-1 and PGE2 by macrophages in a PPAR γ-dependent manner. These anti-inflammatory effects are consistent with suppressed surface expression of TLR4, a surface receptor for LPS, in MLN macrophages and T cells from PPAR γ-expressing, LPS-challenged mice that received ABA. However, this anti-inflammatory effect of ABA was abrogated or impaired in immune cell-specific PPAR γ null mice, indicating that PPAR γ mediates the inhibitory actions of ABA on macrophage and T cell TLR4 expression in vivo during an LPS challenge. Alternatively, PPAR γ could be required for TLR4 expression, regardless of the drug. Of note, bacterially induced signals, via TLR4, affect the expression of PPAR γ (55). Our data suggest that the opposite may also be true. Nonetheless, these novel findings are in contradiction with previous reports describing ABA as a pro-inflammatory mediator in vitro (44, 50). A possible explanation for the divergent findings between this study and studies by Magnone et al. (44) in monocytes that show increased MCP-1 and PGE2 is that monocytes express low levels of PPAR γ, and this receptor is only up-regulated during differentiation into macrophages (56). Based on our model, PPAR γ is required for the anti-inflammatory actions of ABA. Therefore, examining the functional effect of ABA in monocytes devoid of PPAR γ results in an inadvertent experimental bias toward the activation of pro-inflammatory pathways downstream of LANCL2. In support of this assertion, our flow cytometry data in LPS-challenged mice demonstrate a PPAR γ-dependent effect of ABA in tissue macrophages (i.e. MLN), where PPAR γ is expressed, but a PPAR γ-independent effect of ABA in blood monocytes. The inhibitory effect of ABA on the production of PGE2 may also influence the induction of adaptive immune responses because PGE2 is known to suppress interleukin-2 (IL-2) production, and in instances in which PGE2 is decreased by other compounds (i.e. vitamin E), IL-2 production by CD4+ T cells is increased, thereby resulting in greater lymphocyte proliferation (57). In support of this hypothesis, our unpublished data4 demonstrate that ABA increases IL-2 production and lymphocyte proliferation. Although the suppressive action of ABA on inflammation did not seem to match its potential immunostimulatory properties, other naturally occurring compounds such as conjugated linoleic acid have been shown to have immunoenhancing properties while at the same time suppressing inflammation by activating PPAR γ (58).
To more comprehensively determine the effect of ABA on gene expression and to identify future target candidates, we used global gene expression profiling of spleens from mice challenged with LPS. We present a complex ABA-controlled regulatory network that illustrates a down-regulation of pro-inflammatory cytokines (il-6, il-1β, mif, and ifn-γ) and inflammatory signaling molecules such as c-jun and jak1, up-regulation of nuclear receptors (i.e. ppar γ, ppar α, rxrα, and rxrβ), an anti-inflammatory cytokine (i.e. tgf-β), trpm2, a cation channel that can be activated by free intracellular ADP-ribose in synergy with free intracellular calcium (59), and in line with the beneficial effects of ABA on glucose homeostasis (3, 4), hif-1α, a transcription factor driving glycolytic metabolism, thereby maintaining ATP generation (60). The up-regulation of trpm2 is consistent with the finding that ADP-ribose is the second messenger of ABA in human granulocytes (50). Of note, MAPK kinase kinase kinase 2 and adenylate cyclase, which catalyzes the conversion of ATP to cAMP, were also down-modulated by LPS, although ABA mitigated this effect in a PPAR γ-dependent manner, an effect that could be associated with the cAMP/PKA and the MAPK pathways. ABA also suppressed the aminoacyl-tRNA biosynthesis pathway that contains genes that serve as signaling molecules in the immune response (61). Lysyl-tRNA synthetase is linked to pro-inflammatory response (62), although several aminoacyl-tRNA synthetases and their proteolytic fragments have been shown to exert chemoattractant properties (63). Down-modulation of these molecules by ABA may contribute to its anti-inflammatory function in the present context. Consistent with our findings in TLR4 expression, the deficiency of PPAR γ in immune cells drastically reduced the number of genes differentially expressed due to the administration of ABA.
Confirmatory real time RT-PCR results indicate that ABA treatment repressed the expression of LPS-induced tnf-α and up-regulated ppar γ and its related genes, ncoa6 and glut4, in spleen. These modulatory effects of ABA in splenic gene expression were abrogated or impaired in immune cell-specific PPAR γ null mice. The suppression of inflammatory genes could be mediated through ABA-induced suppression of NF-κB activity in primary mouse macrophages. Because this effect was observed in wild-type but not in PPAR γ null macrophages, the inhibitory effect of ABA on macrophage NF-κB activity is likely mediated through a PPAR γ-dependent mechanism, possibly related to co-activator competition. On the other hand, the antagonistic effect of ABA on spleen NFATc1 echoes the inhibitory effect of TZDs on TNF-α production by macrophages and osteoclasts, which is mediated by down-regulation of NFATc1 (64). Lending additional support to the PPAR γ requirement for the anti-inflammatory activity of ABA, ABA decreased NF-κB reporter activity in 3T3-L1 cells, but it increased this activity in RAW macrophages. These findings match our proposed bifurcating mechanistic model (Fig. 7) because RAW macrophages do not express endogenous PPAR γ (46), although 3T3 cells do (40). Indeed, we propose that activation of the LANCL2 pathway will lead to enhanced NF-κB activation via PKA in the absence of PPAR γ activation. The proposed bifurcating pathway model also provides an explanation as to why ABA elicited pro-inflammatory effects in monocytes that express limited or null concentrations of PPAR γ (44).
FIGURE 7.
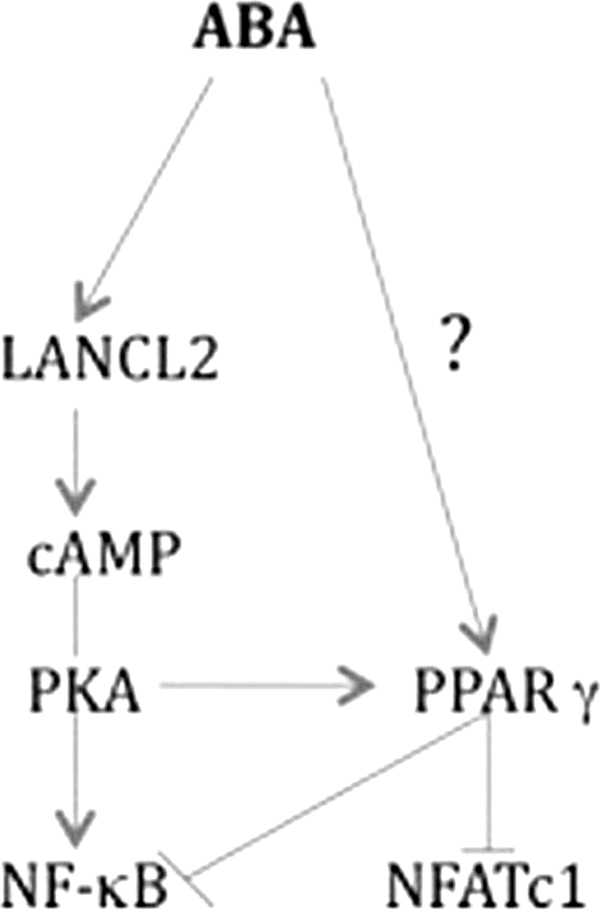
Molecular mechanism underlying activation of PPAR γ by ABA. By binding to LANCL2, ABA activates the cAMP-PKA pathway that is essential for maintaining and enhancing PPAR γ activity in the context of inflammation. In turn, activation of PPAR γ by ABA results in antagonism of NFATc1 and NF-κB activities. Based on this proposed bifurcating pathway mechanistic model, ABA administration in the absence of functional PPAR γ would result in a net pro-inflammatory effect potentially mediated via PKA-dependent activation of NF-κB.
PPAR γ can form complexes with other transcription factors and target co-repressor complexes onto inflammatory gene promoters (12), thereby decreasing inflammation. Our findings are consistent with previous studies demonstrating that treatment of CD4+ T cells with PPAR γ agonists (i.e. ciglitazone or 15dPGJ2) triggered the physical association between PPAR γ and NFATc1 (43) or with NF-κB in gut epithelial cells (11). It remains unknown whether the effect of ABA on PPAR γ is mediated directly by acting on the receptor or indirectly through LANCL2/cAMP initiated signaling and LANCL catalytic functions. Further studies are warranted to determine the impact of the immunoregulatory actions of ABA on human infectious and immune-mediated diseases.
Supplementary Material
This work was supported, in whole or in part, by National Institutes of Health Grant 5R01AT004308 from National Center for Complementary and Alternative Medicine (to J. B.-R.), NIAID Contract HHSN272200900040C (to B. W. S.), and NIAID Contract HHSN272201000056C (to J. B.-R.). This work was also supported by European Commission Grant 224836, the Ramon y Cajal Program, and funds from the Nutritional Immunology and Molecular Medicine Laboratory.

The on-line version of this article (available at http://www.jbc.org) contains supplemental Figs. 1–5 and Table 1.
J. Bassaganya-Riera, A. J. Guri, P. Lu, M. Climent, A. Carbo, B. W. Sobral, W. T. Horne, S. N. Lewis, D. R. Bevan, and R. Hontecillas, unpublished data.
- ABA
- abscisic acid
- PPAR γ
- peroxisome proliferator-activated receptor γ
- LANCL2
- lanthionine synthetase c-like 2
- LBD
- ligand-binding domain
- PG
- prostaglandin
- PGZ
- pioglitazone
- MLN
- mesenteric lymph node
- Ros
- rosiglitazone
- TZD
- thiazolidinedione
- PDB
- Protein Data Bank
- BMM
- bone marrow-derived macrophage
- RAR
- retinoic acid receptor
- RXR
- retinoid X receptor.
REFERENCES
- 1. Bassaganya-Riera J., Skoneczka J., Kingston D. G., Krishnan A., Misyak S. A., Carter A., Pereira A., Guri A. J., Minorsky P., Turmakin R., Hontecillas R. (2010) Curr. Med. Chem. 17, 467–478 [DOI] [PubMed] [Google Scholar]
- 2. Guri A. J., Hontecillas R., Bassaganya-Riera J. (2010) Clin. Nutr. 29, 646–653 [DOI] [PMC free article] [PubMed] [Google Scholar]
- 3. Guri A. J., Hontecillas R., Ferrer G., Casagran O., Wankhade U., Noble A. M., Eizirik D. L., Ortis F., Cnop M., Liu D., Si H., Bassaganya-Riera J. (2008) J. Nutr. Biochem. 19, 216–228 [DOI] [PubMed] [Google Scholar]
- 4. Guri A. J., Hontecillas R., Si H., Liu D., Bassaganya-Riera J. (2007) Clin. Nutr. 26, 107–116 [DOI] [PubMed] [Google Scholar]
- 5. Guri A. J., Misyak S., Hontecillas R., Hasty A., Liu D., Si H., Bassaganya-Riera J. (2010) J. Nutr. Biochem. 21, 1178–1185 [DOI] [PMC free article] [PubMed] [Google Scholar]
- 6. Guri A. J., Hontecillas R., Bassaganya-Riera J. (2010) Clin. Nutr. 29, 824–831 [DOI] [PMC free article] [PubMed] [Google Scholar]
- 7. Bruzzone S., Bodrato N., Usai C., Guida L., Moreschi I., Nano R., Antonioli B., Fruscione F., Magnone M., Scarfì S., De Flora A., Zocchi E. (2008) J. Biol. Chem. 283, 32188–32197 [DOI] [PubMed] [Google Scholar]
- 8. Lehmann J. M., Moore L. B., Smith-Oliver T. A., Wilkison W. O., Willson T. M., Kliewer S. A. (1995) J. Biol. Chem. 270, 12953–12956 [DOI] [PubMed] [Google Scholar]
- 9. Jump D. B., Clarke S. D. (1999) Annu. Rev. Nutr. 19, 63–90 [DOI] [PubMed] [Google Scholar]
- 10. Ricote M., Li A. C., Willson T. M., Kelly C. J., Glass C. K. (1998) Nature 391, 79–82 [DOI] [PubMed] [Google Scholar]
- 11. Kelly D., Campbell J. I., King T. P., Grant G., Jansson E. A., Coutts A. G., Pettersson S., Conway S. (2004) Nat. Immunol. 5, 104–112 [DOI] [PubMed] [Google Scholar]
- 12. Pascual G., Fong A. L., Ogawa S., Gamliel A., Li A. C., Perissi V., Rose D. W., Willson T. M., Rosenfeld M. G., Glass C. K. (2005) Nature 437, 759–763 [DOI] [PMC free article] [PubMed] [Google Scholar]
- 13. Bassaganya-Riera J., Reynolds K., Martino-Catt S., Cui Y., Hennighausen L., Gonzalez F., Rohrer J., Benninghoff A. U., Hontecillas R. (2004) Gastroenterology 127, 777–791 [DOI] [PubMed] [Google Scholar]
- 14. Kim S. R., Lee K. S., Park H. S., Park S. J., Min K. H., Jin S. M., Lee Y. C. (2005) Mol. Pharmacol. 68, 1568–1575 [DOI] [PubMed] [Google Scholar]
- 15. Hammad H., de Heer H. J., Soullié T., Angeli V., Trottein F., Hoogsteden H. C., Lambrecht B. N. (2004) Am J. Pathol. 164, 263–271 [DOI] [PMC free article] [PubMed] [Google Scholar]
- 16. Lewis J. D., Lichtenstein G. R., Deren J. J., Sands B. E., Hanauer S. B., Katz J. A., Lashner B., Present D. H., Chuai S., Ellenberg J. H., Nessel L., Wu G. D. (2008) Gastroenterology 134, 688–695 [DOI] [PMC free article] [PubMed] [Google Scholar]
- 17. Nesto R. W., Bell D., Bonow R. O., Fonseca V., Grundy S. M., Horton E. S., Le Winter M., Porte D., Semenkovich C. F., Smith S., Young L. H., Kahn R. (2003) Circulation 108, 2941–2948 [DOI] [PubMed] [Google Scholar]
- 18. Yang T., Soodvilai S. (2008) PPAR Res. 2008:943614. [DOI] [PMC free article] [PubMed] [Google Scholar]
- 19. Sturla L., Fresia C., Guida L., Bruzzone S., Scarfì S., Usai C., Fruscione F., Magnone M., Millo E., Basile G., Grozio A., Jacchetti E., Allegretti M., De Flora A., Zocchi E. (2009) J. Biol. Chem. 284, 28045–28057 [DOI] [PMC free article] [PubMed] [Google Scholar]
- 20. Landlinger C., Salzer U., Prohaska R. (2006) Biochim. Biophys. Acta 1758, 1759–1767 [DOI] [PubMed] [Google Scholar]
- 21. Berman H. M., Battistuz T., Bhat T. N., Bluhm W. F., Bourne P. E., Burkhardt K., Feng Z., Gilliland G. L., Iype L., Jain S., Fagan P., Marvin J., Padilla D., Ravichandran V., Schneider B., Thanki N., Weissig H., Westbrook J. D., Zardecki C. (2002) Acta Crystallogr. D Biol. Crystallogr. 58, 899–907 [DOI] [PubMed] [Google Scholar]
- 22. Morris G. M., Goodsell D. S., Halliday R. S., Huey R., Hart W. E., Belew R. K., Olson A. J. (1998) J. Comput. Chem. 19, 1639–1662 [Google Scholar]
- 23. Huey R., Morris G. M., Olson A. J., Goodsell D. S. (2007) J. Comput. Chem. 28, 1145–1152 [DOI] [PubMed] [Google Scholar]
- 24. Deleted in proof.
- 25. Pettersen E. F., Goddard T. D., Huang C. C., Couch G. S., Greenblatt D. M., Meng E. C., Ferrin T. E. (2004) J. Comput. Chem. 25, 1605–1612 [DOI] [PubMed] [Google Scholar]
- 26. Schüttelkopf A. W., van Aalten D. M. (2004) Acta Crystallogr. D Biol. Crystallogr. 60, 1355–1363 [DOI] [PubMed] [Google Scholar]
- 27. Trott O., Olson A. J. (2010) J. Comput. Chem. 31, 455–461 [DOI] [PMC free article] [PubMed] [Google Scholar]
- 28. Artis D. R., Lin J. J., Zhang C., Wang W., Mehra U., Perreault M., Erbe D., Krupka H. I., England B. P., Arnold J., Plotnikov A. N., Marimuthu A., Nguyen H., Will S., Signaevsky M., Kral J., Cantwell J., Settachatgull C., Yan D. S., Fong D., Oh A., Shi S., Womack P., Powell B., Habets G., West B. L., Zhang K. Y., Milburn M. V., Vlasuk G. P., Hirth K. P., Nolop K., Bollag G., Ibrahim P. N., Tobin J. F. (2009) Proc. Natl. Acad. Sci. U.S.A. 106, 262–267 [DOI] [PMC free article] [PubMed] [Google Scholar]
- 29. Gampe R. T., Jr., Montana V. G., Lambert M. H., Miller A. B., Bledsoe R. K., Milburn M. V., Kliewer S. A., Willson T. M., Xu H. E. (2000) Mol. Cell 5, 545–555 [DOI] [PubMed] [Google Scholar]
- 30. Arnold K., Bordoli L., Kopp J., Schwede T. (2006) Bioinformatics 22, 195–201 [DOI] [PubMed] [Google Scholar]
- 31. Zhang W., Wang L., Liu Y., Xu J., Zhu G., Cang H., Li X., Bartlam M., Hensley K., Li G., Rao Z., Zhang X. C. (2009) Genes Dev. 23, 1387–1392 [DOI] [PMC free article] [PubMed] [Google Scholar]
- 32. Shirey K. A., Cole L. E., Keegan A. D., Vogel S. N. (2008) J. Immunol. 181, 4159–4167 [DOI] [PMC free article] [PubMed] [Google Scholar]
- 33. Hontecillas R., Bassaganya-Riera J. (2007) J. Immunol. 178, 2940–2949 [DOI] [PubMed] [Google Scholar]
- 34. Bassaganya-Riera J., Misyak S., Guri A. J., Hontecillas R. (2009) Cell. Immunol. 258, 138–146 [DOI] [PMC free article] [PubMed] [Google Scholar]
- 35. Willems F., Vollstedt S., Suter M. (2009) Eur. J. Immunol. 39, 26–35 [DOI] [PubMed] [Google Scholar]
- 36. Gentleman R. C., Carey V. J., Bates D. M., Bolstad B., Dettling M., Dudoit S., Ellis B., Gautier L., Ge Y., Gentry J., Hornik K., Hothorn T., Huber W., Iacus S., Irizarry R., Leisch F., Li C., Maechler M., Rossini A. J., Sawitzki G., Smith C., Smyth G., Tierney L., Yang J. Y., Zhang J. (2004) Genome Biol. 5, R80. [DOI] [PMC free article] [PubMed] [Google Scholar]
- 37. Gautier L., Cope L., Bolstad B. M., Irizarry R. A. (2004) Bioinformatics 20, 307–315 [DOI] [PubMed] [Google Scholar]
- 38. Irizarry R. A., Hobbs B., Collin F., Beazer-Barclay Y. D., Antonellis K. J., Scherf U., Speed T. P. (2003) Biostatistics 4, 249–264 [DOI] [PubMed] [Google Scholar]
- 39. SAS Institute (1988) SAS/STAT User's Guide, version 6.0.3, SAS Institute Inc., Cary, NC [Google Scholar]
- 40. Baillie R. A., Sha X., Thuillier P., Clarke S. D. (1998) J. Lipid Res. 39, 2048–2053 [PubMed] [Google Scholar]
- 41. Itoh T., Fairall L., Amin K., Inaba Y., Szanto A., Balint B. L., Nagy L., Yamamoto K., Schwabe J. W. (2008) Nat. Struct. Mol. Biol. 15, 924–931 [DOI] [PMC free article] [PubMed] [Google Scholar]
- 42. Nolte R. T., Wisely G. B., Westin S., Cobb J. E., Lambert M. H., Kurokawa R., Rosenfeld M. G., Willson T. M., Glass C. K., Milburn M. V. (1998) Nature 395, 137–143 [DOI] [PubMed] [Google Scholar]
- 43. Chung S. W., Kang B. Y., Kim T. S. (2003) Mol. Pharmacol. 64, 1169–1179 [DOI] [PubMed] [Google Scholar]
- 44. Magnone M., Bruzzone S., Guida L., Damonte G., Millo E., Scarfì S., Usai C., Sturla L., Palombo D., De Flora A., Zocchi E. (2009) J. Biol. Chem. 284, 17808–17818 [DOI] [PMC free article] [PubMed] [Google Scholar]
- 45. Welch J. S., Ricote M., Akiyama T. E., Gonzalez F. J., Glass C. K. (2003) Proc. Natl. Acad. Sci. U.S.A. 100, 6712–6717 [DOI] [PMC free article] [PubMed] [Google Scholar]
- 46. Crosby M. B., Svenson J. L., Zhang J., Nicol C. J., Gonzalez F. J., Gilkeson G. S. (2005) J. Pharmacol. Exp. Ther. 312, 69–76 [DOI] [PubMed] [Google Scholar]
- 47. Tsavkelova E. A., Klimova, Slu, Cherdyntseva T. A., Netrusov A. I. (2006) Prikl. Biokhim. Mikrobiol. 42, 261–268 [PubMed] [Google Scholar]
- 48. Zocchi E., Carpaneto A., Cerrano C., Bavestrello G., Giovine M., Bruzzone S., Guida L., Franco L., Usai C. (2001) Proc. Natl. Acad. Sci. U.S.A. 98, 14859–14864 [DOI] [PMC free article] [PubMed] [Google Scholar]
- 49. Zocchi E., Basile G., Cerrano C., Bavestrello G., Giovine M., Bruzzone S., Guida L., Carpaneto A., Magrassi R., Usai C. (2003) J. Cell Sci. 116, 629–636 [DOI] [PubMed] [Google Scholar]
- 50. Bruzzone S., Moreschi I., Usai C., Guida L., Damonte G., Salis A., Scarfì S., Millo E., De Flora A., Zocchi E. (2007) Proc. Natl. Acad. Sci. U.S.A. 104, 5759–5764 [DOI] [PMC free article] [PubMed] [Google Scholar]
- 51. Lu P., Bevan D. R., Lewis S. N., Hontecillas R., Bassaganya-Riera J. (2010) J. Mol. Model., in press [DOI] [PubMed] [Google Scholar]
- 52. Chung C. H., Kurien B. T., Mehta P., Mhatre M., Mou S., Pye Q. N., Stewart C., West M., Williamson K. S., Post J., Liu L., Wang R., Hensley K. (2007) Biochemistry 46, 3262–3269 [DOI] [PubMed] [Google Scholar]
- 53. Lazennec G., Canaple L., Saugy D., Wahli W. (2000) Mol. Endocrinol. 14, 1962–1975 [DOI] [PMC free article] [PubMed] [Google Scholar]
- 54. Saito Y., Okamura M., Nakajima S., Hayakawa K., Huang T., Yao J., Kitamura M. (2010) Am. J. Physiol. Renal Physiol. 298, F1436–1444 [DOI] [PubMed] [Google Scholar]
- 55. Dubuquoy L., Jansson E. A., Deeb S., Rakotobe S., Karoui M., Colombel J. F., Auwerx J., Pettersson S., Desreumaux P. (2003) Gastroenterology 124, 1265–1276 [DOI] [PubMed] [Google Scholar]
- 56. Szanto A., Nagy L. (2005) Mol. Pharmacol. 67, 1935–1943 [DOI] [PubMed] [Google Scholar]
- 57. Adolfsson O., Huber B. T., Meydani S. N. (2001) J. Immunol. 167, 3809–3817 [DOI] [PubMed] [Google Scholar]
- 58. O'Shea M., Bassaganya-Riera J., Mohede I. C. (2004) Am. J. Clin. Nutr. 79, 1199S–1206S [DOI] [PubMed] [Google Scholar]
- 59. Csanády L., Törocsik B. (2009) J. Gen. Physiol. 133, 189–203 [DOI] [PMC free article] [PubMed] [Google Scholar]
- 60. Agrawal A., Guttapalli A., Narayan S., Albert T. J., Shapiro I. M., Risbud M. V. (2007) Am. J. Physiol. Cell Physiol. 293, C621–C631 [DOI] [PubMed] [Google Scholar]
- 61. Nechushtan H., Kim S., Kay G., Razin E. (2009) Adv. Immunol. 103, 1–27 [DOI] [PubMed] [Google Scholar]
- 62. Park S. G., Kim H. J., Min Y. H., Choi E. C., Shin Y. K., Park B. J., Lee S. W., Kim S. (2005) Proc. Natl. Acad. Sci. U.S.A. 102, 6356–6361 [DOI] [PMC free article] [PubMed] [Google Scholar]
- 63. Levine S. M., Rosen A., Casciola-Rosen L. A. (2003) Curr. Opin. Rheumatol. 15, 708–713 [DOI] [PubMed] [Google Scholar]
- 64. Yang C. R., Lai C. C. (2010) Shock 33, 662–667 [DOI] [PubMed] [Google Scholar]
Associated Data
This section collects any data citations, data availability statements, or supplementary materials included in this article.