

Abstract
Homomeric P2X3 receptors are present in sensory ganglia and participate in pain perception. Amino acid (AA) residues were replaced in the four supposed nucleotide binding segments (NBSs) of the human (h) P2X3 receptor by alanine, and these mutants were expressed in HEK293 cells and Xenopus laevis oocytes. Patch clamp and two-electrode voltage clamp measurements as well as the Ca2+ imaging technique were used to compare the concentration-response curves of the selective P2X1,3 agonist α,β-methylene ATP obtained at the wild-type P2X3 receptor and its NBS mutants. Within these NBSs, certain Gly (Gly-66), Lys (Lys-63, Lys-176, Lys-284, Lys-299), Asn (Asn-177, Asn-279), Arg (Arg-281, Arg-295), and Thr (Thr-172) residues were of great importance for a full agonist response. However, the replacement of further AAs in the NBSs by Ala also appeared to modify the amplitude of the current and/or [Ca2+]i responses, although sometimes to a minor degree. The agonist potency decrease was additive after the simultaneous replacement of two adjacent AAs by Ala (K65A/G66A, F171A/T172A, N279A/F280A, F280A/R281A) but was not altered after Ala substitution of two non-adjacent AAs within the same NBS (F171A/N177A). SDS-PAGE in the Cy5 cell surface-labeled form demonstrated that the mutants appeared at the cell surface in oocytes. Thus, groups of AAs organized in NBSs rather than individual amino acids appear to be responsible for agonist binding at the hP2X3 receptor. These NBSs are located at the interface of the three subunits forming a functional receptor.
Keywords: Neuron, Neuroscience, Nucleotide, Purinergic Receptor, Receptor Modification
Introduction
ATP-gated, cation-permeable P2X receptor channels form a family of seven subunits, referred to as P2X1 through P2X7 (1). The subunits consist of two transmembrane domains, a large extracellular loop containing the ATP binding site, as well as intracellular N- and C-terminal tails. Biochemical evidence indicates that both homomeric and heteromeric receptors occur as stable trimers (2–4).
Mutagenesis studies at homomeric P2X receptors uniformly suggested that the negatively charged phosphate groups of ATP occupy some positively charged amino acids (AAs),4 specifically Lys or Arg, in the extracellular loop of the receptor (5–7). Moreover, aromatic Phe residues were assumed to be associated with binding the adenine ring of ATP (8). Molecular models were generated on the basis of these studies, under the assumption that each subunit of the P2X receptor family contains one individual binding site (9, 10). The three-subunit composition of P2X receptors was supported in addition to the already mentioned biochemical evidence (2) by a wealth of further data. (a) Single channel analysis of P2X receptor currents indicated 2–3 sequential binding steps (11, 12). (b) The kinetic behavior of P2X receptor currents was simulated with an allosteric model describing channel opening in the di- or triliganded state (13, 14). (c) Atomic force microscopy provided evidence for three receptor subunits, which moved away from the central pore as the channel opened (15, 16). (d) Fluorescence resonance energy transfer and electron microscopy supplied a rough structure of three interacting subunits (17). (e) The crystal structure of a zebrafish (zf) P2X4 receptor mutant supported the existence of corresponding intersubunit pockets as the binding site for ATP (17, 18).
Because in P2X receptors, instead of a few amino acid residues, four clusters of AAs, termed nucleotide binding domains (NBD1–4 (19); here nucleotide binding segments; NBS1–4), were identified as possible docking places for ATP (see Fig. 1A), we investigated by Ala scanning mutagenesis the functional significance of these NBSs. For this purpose, the human (h) recombinant P2X3 receptor, located at sensory neurons and participating in pain sensation (20, 21), was expressed in HEK293 cells or Xenopus laevis oocytes, and the P2X1,3 receptor-selective α,β-methylene ATP (α,β-meATP) was used as an agonist (22). In contrast to α,β-meATP, ATP itself would have the drawback of also activating P2Y receptors negatively interacting with the stimulatory effect at P2X3 (23).
FIGURE 1.

Current responses to α,β-meATP of the WT hP2X3 receptor and its NBS mutants in HEK293 cells. A, AA residues of the supposed nucleotide binding segments (NBS1–4). Bold characters, conserved AAs; underlined characters, substitution by Ala. B, panel a, whole-cell current responses, induced by α,β-meATP (0.03–30 μm), were recorded with the patch clamp technique at a holding potential of −65 mV. Increasing concentrations of the agonist were locally superfused for 2 s with 5- or 7-min intervals as indicated. Panel b, increases in the intracellular calcium concentration ([Ca2+]i) were induced by α,β-meATP (0.3–300 μm). Increasing concentrations of the agonist were locally superfused for 5 s with 15-min intervals. The cells were labeled with the calcium-sensitive fluorescent dye Fura-2, and fluorescence ratio (FR340/380) measurements were made with a dual wavelength spectrometer (alternating excitation at 340 and 380 nm). The changes in FR were used as a measure of [Ca2+]i. Representative tracings are shown in both panels a and b. C, panel a, α,β-meATP (30 μm)-induced charge transfer measured by the patch clamp technique and fluorescence ratio determined by Ca2+ imaging as a function of time. The time courses of these responses were similar. Two representative experiments are shown out of a total of three (current response) and four ([Ca2+]i transients) similar ones (2-s application time). pC, picocoulombs. Panel b, the current response to α,β-meATP (30 μm) and the differentiated F340/380/dt also have similar time courses. The recordings from panel a were replotted in panel b.
P2X1 and P2X3 receptors show, in contrast to all other P2X receptor subtypes, a rapidly desensitizing behavior; this may be due to differences in either the AA composition/length of the N or C terminus (24–27) or the AA composition/length of the second transmembrane domain (27). Moreover, the phosphorylation of consensus protein kinase C sites at the extracellular loop of the P2X3 receptor might also modify the agonist-induced desensitization (28, 29). Eventually, rapid desensitization may also depend on agonist binding to a non-conserved AA at the extracellular loop, which is absent in the slowly desensitizing receptor types. Thus, patch clamp and two-electrode voltage clamp measurements, as well as the Ca2+ imaging technique, were used to investigate the role of all conserved and some non-conserved AA residues arranged in NBSs and located at the interface of two subunits for determining the amplitude and time course of the agonist-induced responses.
EXPERIMENTAL PROCEDURES
Culturing of HEK293-hP2X3 Cells
HEK293 cells were kept in Dulbecco's modified Eagle's medium also containing 4.5 mg/ml d-glucose (Invitrogen), 2 mm l-glutamine (Sigma-Aldrich), 10% fetal bovine serum (Invitrogen) at 37 °C and 10% CO2 in humidified air.
Site-directed Mutagenesis and Transfection Procedures
The human P2X3 receptor (hP2X3) cDNA (GenBankTM accession number NM-002559.2) was subcloned per PstI and EcoRI restriction sites into pIRES2-EGFP vector from Clontech Laboratories for independent expression of P2X3 and EGFP, creating the pIR-P2 plasmid. All P2X3 receptor mutants were generated by introducing replacement mutations into the pIR-P2 construct using the QuikChange site-directed mutagenesis protocol from Stratagene according to the instruction manual. HEK293 cells were plated in plastic dishes (electrophysiology) or onto coverslips (Ca2+ imaging) 1 day before transient transfection. 0.5 μg of plasmid DNA per dish was combined with 10 μl of PolyFect reagent from Qiagen and 100 μl of Opti-MEM (Invitrogen). After 10 min of incubation, the lipid-DNA complexes were introduced to the cells. Approximately 18 h after transfection, the medium was replaced with Opti-MEM to remove residual plasmid DNA.
Whole-cell Patch Clamp Recordings
Whole-cell patch clamp recordings were performed 2–3 days after the transient transfection of HEK293 cells, at room temperature (20–22 °C), using an Axopatch 200 B patch clamp amplifier (Molecular Devices). The pipette solution contained (in mm): 140 CsCl, 1 CaCl2, 2 MgCl2, 10 HEPES, and 11 EGTA, pH adjusted to 7.4 using CsOH. The external physiological solution contained (in mm): 135 NaCl, 4.5 KCl, 2 CaCl2, 2 MgCl2, 10 HEPES, and 10 glucose, pH adjusted to 7.4 using NaOH. The pipette resistances were 3–6 megaohms. The liquid junction potential (VLJ) between the bath and pipette solution at 21 °C was calculated and was found to be 4.5 mV. Holding potential values given in this study were corrected for VLJ. All recordings were made at a holding potential of −65 mV. Data were filtered at 2 kHz with the inbuilt filter of the amplifier, digitized at 5 kHz, and stored on a laboratory computer using a Digidata 1440 interface and pClamp 10.2 software (Molecular Devices).
Drugs were dissolved in the external solution and locally superfused to single cells (detected by their EGFP fluorescence), using a rapid solution change system (SF-77B Perfusion Fast-Step, Warner Instruments; 10–90% rise time of the junction potential at an open pipette tip was 1–4 ms; but see below). Concentration-response curves were established by applying increasing concentrations of α,β-methylene ATP (α,β-meATP; Sigma-Aldrich) for 2 s. The intervals between applications were 5 min for 0.03–1 μm and 7 min for 3–300 μm. Under these conditions, agonist responses were reproducible at the given concentrations (30).
In experiments investigating the kinetics of P2X3 currents, α,β-meATP (100 μm) was applied for 10 s with 7-min intervals three times in total. The current induced by the second application was used for calculations. The decay phases of the curves were fitted by the following biexponential equation
using the in-built function of the pClamp 10.2 software (Molecular Devices), where A1 and A2 are the relative amplitudes of the first and second exponential, τdes1 and τdes2 are the desensitization time constants, and P is the plateau. The onset time constants (τon(10–90%)) were calculated from the individual recordings under the assumption that despite the relatively slow local application, they give a rough approximation of the kinetics of channel opening.
Macroscopic Conductance Kinetics
Macroscopic conductance kinetics were analyzed by a hidden Markow model (see supplemental Fig. 2A, panel a; derived from Ref. 14) that includes binding, gating, and desensitization. Kinetic modeling and fitting were performed by the QuB software (31). To estimate solution exchange times of the rapid superfusion system used, 150 mm KCl was applied to the cell. The time constant of this test pulse (∼140 ms) was determined by a single exponential fit and used for modeling the wash in and wash out of α,β-meATP.
High α,β-meATP concentrations induce large and rapidly activating currents, leading to a reduced membrane potential. Hence, for kinetic fits, the whole-cell conductance σ was calculated from the measured current I, the access resistance Ra, the membrane resistance Rm, and the holding potential Uh, using the following equation.
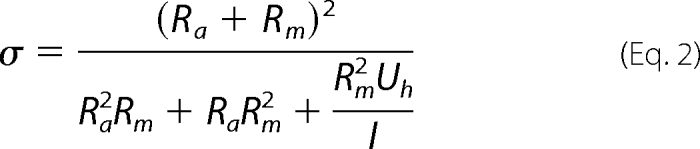 |
Ca2+ Microfluorometry
HEK293 cells were loaded 2–3 days after transient transfection with the Ca2+-sensitive fluorescent dye Fura-2 acetoxymethyl ester (2.5 μm; Sigma-Aldrich) at 37 °C for 30 min in culture medium. To remove extracellular traces of the dye, the cells were then washed in physiological solution of the same composition as that used for patch clamp measurements. Cells plated onto coverslips were mounted into a perfusion chamber and placed on the stage of an inverted microscope (IX-70; Olympus) with epifluorescence optics and a cooled CCD camera (IMAGO; Till Photonics). Throughout the experiments, cells were continuously superfused at 0.8 ml/min by means of a roller pump with external solution. Intracellular Fura-2 was alternately excited at 340 and 380 nm, and the emitted light was measured at a wavelength of 510 nm. The TILL vision software (3.3 Till Photonics) was used for data acquisition, system control, and later, off-line analysis. The fluorescence ratio (FR; 340/380 nm) provides a relative measure of the cytosolic free Ca2+ concentration ([Ca2+]i).
For the determination of concentration-response relationships, α,β-meATP was pressure-injected locally, by means of a computer-controlled DAD12 superfusion system (ALA Scientific Instruments, Inc.). The application time was 5 s, and the intervals between two subsequent agonist applications were kept, independent of the concentration used, at 15 min.
Expression of P2X3 Receptors and Their Mutants in X. laevis Oocytes
An oocyte expression plasmid harboring the cDNA for an N-terminally hexahistidine-tagged (His-tagged) hP2X3 subunit was available from a previous study. Replacement mutations were introduced by QuikChange site directed-mutagenesis (Stratagene). All constructs were verified by restriction analysis and nucleotide sequencing. Capped cRNAs were synthesized and injected into collagenase-defolliculated X. laevis oocytes using a Nanoliter 2000 injector (World Precision Instruments) as described previously (2, 32). Oocytes were cultured at 19 °C in sterile oocyte Ringer's solution (ORi: 90 mm NaCl, 1 mm KCl, 1 mm CaCl2, 1 mm MgCl2, and 10 mm Hepes, pH 7.4) supplemented with 50 μg/ml gentamycin.
Two-electrode Voltage Clamp Electrophysiology
2–3 days after cRNA injection, current responses were evoked by α,β-meATP as indicated, at ambient temperature (21–24 °C), and recorded by conventional two-electrode voltage clamp with a Turbo TEC-05 amplifier (npi Electronics) at a holding potential of −60 mV as described previously (33). Oocytes were continuously perfused by gravity (5–10 ml/min) in a small flow-through chamber with a nominally calcium-free ORi solution (designated Mg-ORi), in which CaCl2 was replaced by equimolar MgCl2 to avoid a possible contribution of endogenous Ca2+-dependent Cl− channels to the α,β-meATP response.
Dilutions of agonists and antagonists in Mg-ORi were prepared daily and applied by bath perfusion. Switching between bath solutions was controlled by a set of magnetic valves, enabling computer-controlled applications of compounds (CellWork Lite 5.1 software; npi Electronics). For concentration-response analysis, rapidly desensitizing hP2X3 receptors were first repetitively activated in 1-min intervals by 10-s applications of 100 μm α,β-meATP (which is maximally effective at the wild-type (WT) hP2X3 receptor) until constant current responses were obtained (for further experimental details, see Ref. 33).
Protein Labeling, Purification, and PAGE
cRNA-injected oocytes were metabolically labeled by overnight incubation with l-[35S]methionine and, just before protein extraction, additionally surface-labeled with Cy5 NHS ester, an amine-reactive, membrane-impermeant fluorescent dye (34). His-tagged proteins were purified by nickel-nitrilotriacetic acid agarose (Qiagen) chromatography from digitonin (1%, w/v) extracts of oocytes and analyzed by blue native PAGE as described previously (2, 3). Where indicated, samples were treated before blue native PAGE for 1 h at 37 °C with 0.1% (w/v) SDS or a combination of 0.1% (w/v) SDS and 100 mm DTT, to induce partial dissociation of hP2X3 complexes.
For SDS-urea-PAGE, proteins were denatured by incubation with reducing SDS sample buffer for 15 min at 56 °C and electrophoresed in parallel with 14C-labeled molecular mass markers (Rainbow, Amersham Biosciences) on SDS-urea-PAGE gels (10% acrylamide). SDS-urea-PAGE gels were scanned wet with a fluorescence scanner (Typhoon, GE Healthcare) for visualization of fluorescently labeled plasma membrane-bound proteins and then dried and exposed to a phosphor screen for subsequent PhosphorImager (Storm 820, GE Healthcare) detection of 35S incorporation. The figures were prepared by using ImageQuant TL v2005 (Amersham Biosciences) for contrast adjustments and Adobe Photoshop CS 8.0 for level adjustment and cropping.
Homology Modeling
We modeled, based on the published crystal structure of the zfP2X4 channel in its closed state (18), the extracellular loop and transmembrane areas of the hP2X3 receptor. The software used was Modeler 9, version 7 (35). The alignment was determined by the align2D function, which also takes the secondary structure of the template into consideration. Homology modeling was made with the loopmodel function with high optimization settings. Visualization of the results was by VMD (36).
Data Analysis
Concentration-response curves for α,β-meATP were fitted by using a three-parametric Hill plot (SigmaPlot; SPSS). The figures show mean ± S.E. values of n experiments. One-way analysis of variance followed by Holm-Sidak post hoc test was used for statistical analysis. We compared the various current and [Ca2+]i parameters (amplitude and/or time course) of the mutants within NBS1–4 with the WT data. A probability level of 0.05 or less was considered to reflect a statistically significant difference.
RESULTS
Agonist Sensitivity of hP2X3 Receptor Mutants
Patch Clamp Investigations
The underlined, conserved AA residues in NBS1–4 of hP2X3 were sequentially replaced by Ala, one or two at a time (Fig. 1A). In addition, the conserved Ala-283 was substituted by Asp or Arg. We have also chosen non-conserved AA residues in each NBS and replaced them by Ala (Fig. 1A). The functional significance of AAs was checked by using the P2X1,3-selective α,β-meATP as an agonist.
The hP2X3 receptor or its mutants were transiently expressed either in HEK293 cells or in X. laevis oocytes. Fig. 1B documents the agonist application protocols in WT HEK293-hP2X3 cells. When recorded by the whole-cell variant of the patch clamp technique, at a holding potential of −65 mV, α,β-meATP had already caused a prominent desensitization of the inward current during its 2-s superfusion period (Fig. 1B, panel a). We kept a 5–7-min interval between the application of successively increasing α,β-meATP concentrations to allow recovery of agonist sensitivity. α,β-meATP caused a concentration-dependent increase of the intracellular [Ca2+]i transients in HEK293-hP2X3 cells as well, with a slow decline to the pre-drug level. In these experiments, we superfused α,β-meATP for 5 s and correspondingly prolonged the application intervals from 5–7 to 15 min (Fig. 1B, panel b). It is noteworthy that extracellular Ca2+ appeared to enter the cells via the P2X3 receptor channels only because a Ca2+-free bath medium almost abolished the effect of α,β-meATP (37). Finally, the α,β-meATP-induced inward currents and [Ca2+]i transients were strongly depressed by the P2X1–3 antagonist TNP-ATP or the P2X3-selective antagonist A317491 (37).
In the following experiments, we singly or doubly replaced all conserved AA residues within NBS1–4 of the hP2X3 subunit by Ala (Fig. 2); the only exception was the neutral Ala-283 itself, which was substituted by the negatively charged Asp or the positively charged Arg. Then, we transfected both the WT receptor and its NBS mutants into HEK293 cells and compared the current responses measured by the patch clamp technique. The concentration-response curve for α,β-meATP at the WT receptor yielded an EC50 of 2.66 ± 0.67 μm, an Imax of 4,110 ± 310 pA, and a Hill coefficient of 1.47 ± 0.47 (n = 8–12). It is noteworthy that the EC50 values correlated well with those reported previously, both by ourselves (30) and by other authors (38).
FIGURE 2.

Current responses to α,β-meATP in HEK293 cells transfected with the WT hP2X3 receptor and its mutants. Whole-cell patch clamp recordings were made as described in the legend for Fig. 1. Concentration-response curves for α,β-meATP were constructed both for the WT hP2X3 receptor and for its point mutants, where the indicated AAs in their nucleotide binding segments were replaced by Ala (in Fig. 1A, see underlined one-letter coding of AAs). Ala was sequentially introduced to substitute individual AAs in NBS1 (a), NBS2 (b), NBS3 (c), and NBS4 (d). Each symbol indicates the mean ± S.E. of 5–13 cells.
When concentration-response curves were determined for α,β-meATP at the mutant receptors, it became evident that several AA substitutions interfered with the agonist effect. First of all, replacement of Ala-283 by Asn or Arg caused a decrease in the activity of α,β-meATP. It was not possible to determine EC50 or Imax values at the A283D and A283R mutants because no clear maximum of the concentration-response curve was reached up to 300 μm. The current amplitudes at this α,β-meATP concentration were 380.7 ± 95.9 pA (A283D; n = 6) and 2,996 ± 1,553 pA (A283R; n = 5), respectively; a statistically significant inhibition was observed only when the Imax value at the WT receptor (4,110 ± 310 pA; see above) was compared with effect of α,β-meATP (300 μm) at the A283D mutant. Thus, AAs carrying a negative or positive charge at position 283 perturbed the ability of the receptor channel to open.
In NBS1, the amino acid residues Lys-63 and Gly-66, in NBS2, the residues Thr-172, Lys-176, and Asn-177, in NBS3, the residues Asn-279, Arg-281, and Lys-284, and eventually in NBS4, the residues Lys-299 and Arg-295 were essential for the agonist response. Although of less importance, modifications at Lys-65 (NBS1), Phe-174 (NBS2), Phe-280 and Phe-282 (NBS3), and Gly-302 (NBS4) also caused moderate changes. Replacements of Thr-62 (NBS1), Phe-171 (NBS2), and Leu-297 or F301A (NBS4) by Ala had no effect. There was no obligatory relationship between an AA being conserved or non-conserved and the magnitude of inhibition. Some conserved (e.g. Lys-63) and non-conserved (e.g. Lys-284) AAs were both of great importance for the agonist effect, whereas other non-conserved (e.g. Thr-62) and conserved (e.g. Phe-171) AAs were of minor significance. It turned out to be especially interesting that although some single mutations of adjacent, conserved AAs in NBS1, -2, and -3 failed to abolish the current response, the respective double mutations (K65A/G66A, F171A/T172A, N279A/F280A, F280A/R281A) caused complete inhibition (supplemental Fig. 1). However, the double mutation of two non-adjacent, conserved AAs (F171A/N177A) within NBS2 did not decrease the α,β-meATP response further when compared with F171A alone.
Ca2+ Imaging Studies
The evaluation of the α,β-meATP concentration-response curves for [Ca2+]i transients in HEK293 cells transfected with the WT hP2X3 receptor yielded an EC50 value of 1.86 ± 0.21 μm, an ΔFRmax of 0.45 ± 0.01, and a Hill coefficient of 3.16 ± 0.64 (n = 14–19) (Fig. 3). The agonist effects were modified by mutations of individual AAs within NBS1–4 to Ala. Moreover, the replacement of Ala-283 by Asp or Arg decreased the α,β-meATP-induced increase of [Ca2+]i. It was not possible to determine EC50 or Imax values at the A283D and A283R mutants because no clear maximum of the concentration-response curve was reached up to 300 μm. The [Ca2+]i transients at this agonist concentration were 0.15 ± 0.01 (A283D; n = 32) and 0.35 ± 0.04 (A283R; n = 35), respectively; a statistically significant inhibition was observed when the ΔFRmax value at the WT receptor (0.45 ± 0.01; see above) was compared with the effect of α,β-meATP (300 μm) at both mutants. Thus, AAs carrying a negative or positive charge at position 283 perturbed the ability of the receptor to interact with its agonist.
FIGURE 3.

Increases of intracellular calcium by α,β-meATP in HEK293 cells transfected with the WT hP2X3 receptor and its mutants. FR measurements were made as described in the legend for Fig. 1 and were taken as a measure of [Ca2+]i. Concentration-response curves for α,β-meATP were constructed both for the WT hP2X3 receptor and for its point mutants, where the indicated AAs in their nucleotide binding segments were replaced by Ala (in Fig. 1A, see underlined one-letter coding of AAs). Ala was sequentially introduced to substitute individual AAs in NBS1 (a), NBS2 (b), NBS3 (c), and NBS4 (d). Each symbol indicates the mean ± S.E. of 9–20 cells.
All these changes were basically similar to the situation when current responses were used as a measure of agonist potency. However, in contrast to patch clamp measurements, where T62A, F172A, L297A, and F301A did not considerably modify the α,β-meATP sensitivity, Ca2+ imaging also demonstrated small changes with these mutants. It should be kept in mind that because of the possibility to measure [Ca2+]i simultaneously in many cells, the number of experiments was in this case higher than with patch clamp recordings, where each cell had to be patched separately. We assume that the combination of these two methods allows a more reliable observation of subtle changes than the measurement of current responses or [Ca2+]i transients alone (39, 40).
It is certainly true that electrophysiology directly determines the cationic fluxes through the P2X3 receptor channel, whereas [Ca2+]i transients are only a consequence of the entry of Ca2+ via this receptor channel into the intracellular space. However, the two methods equally well describe the same phenomenon. In representative experiments, we integrated the α,β-meATP (30 μm) currents through the WT P2X3 receptor to obtain the total amount of transferred charge (n = 3) and found its time course similar to that of the [Ca2+]i transients (measured as fluorescence ratio; ΔFR) (n = 4; Fig. 1C, panel a). Then, the shape of the current response to α,β-meATP was compared with that of the differentiated [Ca2+]i response and was found to perfectly correlate (Fig. 1C, panel b) (41); rapid desensitization was a characteristic feature of the receptor when either method was used for recording.
Comparison of Data Obtained by Patch Clamp Measurements and Ca2+ Imaging Studies
Fig. 4 summarizes the data obtained by electrophysiology and Ca2+ imaging. The EC50 and the maximal effect Emax (Imax and ΔFRmax, respectively) values calculated from the concentration-response curves are shown both for the WT receptor and for its Ala-substituted single or double mutants. As already mentioned above, qualitatively identical results were obtained by the two techniques, although quantitative differences exist. With some of the mutants, no clear maximum of the concentration-response curve (and as a consequence EC50 or Emax values) could be determined with one or both of these techniques. With these limitations in mind, there was no response to α,β-meATP at the K63A, K176A, R295A, and K299A mutants, in agreement with the suggestion that certain positively charged AAs are associated with the binding of the negatively charged phosphate groups of ATP (5–7). The changes in EC50 and Emax with the additional mutants, as well as the experiments with mutating Ala-283 to Asp or Arg, confirmed our assumption that all conserved AAs in the NBSs play some role in agonist binding, the stabilization of the secondary protein structure, or the transduction of receptor binding to channel gating. A comparable function of at least some of the non-conserved AAs was also evident.
FIGURE 4.

Summary of α,β-meATP concentration-response curves for the hP2X3 receptor and its NBS mutants in HEK293 cells. Curves presented in Figs. 2 and 3, and supplemental Fig. 1 were fitted as described under “Experimental Procedures” to obtain the EC50 and Emax (Imax or ΔFRmax) values. On the left-side graph, the EC50 values of the indicated mutants are expressed in μm. On the right-side graph, the Emax values of the same mutants are expressed in pA and ΔFR, respectively. Current (a) and FR (b) measurements are indicated for each single and double mutant. Each symbol indicates mean ± S.E. of 4–13 (a) and 9–20 (b) cells. With several mutants, no clear maximum of the concentration-response curve was reached, and therefore neither the EC50 nor the Emax values could be reliably determined. In such cases, the EC50 values were not indicated, and the Emax values were replaced with the effect of the highest agonist concentration tested (300 μm; designated by a thick line). *, p < 0.05; statistically significant difference from the respective value measured with the WT receptor.
Activation, Gating, and Desensitization of hP2X3 Receptor Mutants
A further question to be answered was whether some of the mutations altered the shape of the current response by interfering with channel activation or desensitization. Fig. 5a shows original tracings of α,β-meATP (100 μm) responses on mutants, where the current amplitude, its activation time, or the rate of desensitization appeared to change in comparison with the WT receptor. It is noteworthy that a slower rate of desensitization (higher τdes1, τdes2 values; see below) may also be caused by a slower gating of the P2X3 receptor channel. In these experiments, α,β-meATP was applied for only 2 s; the rate constants were calculated from similar experiments with 10-s application times (not shown; see “Experimental Procedures”). According to expectations, WT P2X3 exhibited a rapid activation time constant (τon, 38 ± 4 ms) and an extremely rapid fading of the current amplitude with the two desensitization time constants τdes1 (935 ± 128 ms) and τdes2 (133 ± 12 ms; n = 8 each). The T62A, F171A, and L297A mutants exhibited current amplitudes similar to those of the WT receptor (Figs. 2 and 4); neither their τon nor their τdes1/τdes2 values differed in a statistically significant manner from the WT controls. The mutation of Lys-65 to Ala did not change the current amplitude but prolonged the onset time constant τon (270 ± 50 ms; p < 0.05) and increased both desensitization time constants (τdes1, 4,121 ± 945 ms; τdes2, 690 ± 95 ms; n = 7; p < 0.05). The G66A mutant exhibited smaller current responses than the WT receptor, with a reduction of the rise and decay times (τon, 310 ± 45 ms; τdes1, 5,477 ± 1,480 ms; τdes2, 740 ± 105 ms; n = 10; p < 0.05). The current responses at the T172A and N177A mutants were also smaller than those at the WT receptor, although the rate of desensitization was unaltered. Eventually, smaller amplitudes were accompanied either by decelerated (N279A, τon, 487 ± 60 ms; τdes1, 21,830 ± 7,060 ms; τdes2, 2,168 ± 501 ms; n = 9; p < 0.05) or by practically non-existent desensitization (R281A), at least during the 2–10-s application times of the present experiments. In the case of K284A, the τon values increased (151 ± 18 ms; p < 0.05), whereas the τdes1 (2,376 ± 133 ms) and τdes2 values (418 ± 30 ms; n = 10 and p > 0.05 each) did not alter.
FIGURE 5.

Original recordings of α,β-meATP-induced currents at hP2X3 receptors or its NBS mutants. The expression systems of the HEK293 cell (a, left panel; experimental conditions were as described in the legend for Fig. 1) or the Xenopus leavis oocyte (b, right panel; holding potential, −60 mV; agonist application was for 10 s every 1 min) were used. a, α,β-meATP (100 μm) effects are shown at those mutants only, where either the amplitude or the time course of the current responses appeared to be modified in comparison with the WT receptor. b, α,β-meATP (100 μm) effects are shown at nine selected mutants only, where the amplitude and/or the time course of current responses appeared to be modified in comparison with the WT receptor. These mutants were tested for assembly and surface expression in the oocyte system in the following experiments (Fig. 6B). Representative recordings for 5–14 experiments are shown.
For the WT P2X3 receptor and a number of its mutants, we constructed kinetic fits of the α,β-meATP-induced currents by using a hidden Markow model obtained by simplification of the model of Karoly et al. (14). The rate constants characterizing transitions between the unbound, closed-state receptor (C1), and the receptor binding one- (C2), two (C3)-, or three (C4)-agonist molecules, as well as the two open-state receptors (O5, O6) and the two desensitized receptors (C7, C8) are shown for WT P2X3 on the supplemental Fig. 2A, panel a. By using the on- and off-rate constants, the shape and amplitude of the α,β-meATP (0.3–300 μm)-induced currents could be computer-modeled; the quality of the fits can be judged by the close parallelism of the black lines (original tracings) and the current traces (orange lines) calculated with the indicated rate constants for binding (C1-C4), gating (C3-O5; C4-O6), and desensitization (C3-C7 and O5-C7; C4-C8 and O6-C8). Best fits for the α,β-meATP currents were computed by modifying the rate constants as indicated in the individual panels of supplemental Fig. 2. By comparing these constants with those of the WT receptor, it appears that in the case of K65A (B) and F280A (D), binding was altered, whereas in the case of F174A (C), both binding and gating were altered. Thus, selected mutations within NBS1–3 are suggested to modify agonist binding to a variable degree, although in some cases, gating may also be affected. The quality of the best fit for R281A (E) was moderate, indicating on the one hand changes in binding, but on the other hand raising the possibility of additional complicating factors such as the interruption of hydrogen bounds formed between Arg-281 and Glu-156 on the same subunit and/or Asp-76 on the neighboring subunit (see “Homology Modeling of the hP2X3 Receptor” below). Similarly, the modification of the rate constants failed to produce a good fit for agonist currents at Lys-284 (not shown). This may be due to the fact that Lys-284 is situated at the entry of the ion pore region and is not directed toward the binding groove. We simplified the model of Karoly et al. (14) by omitting the kinetic constants determining high affinity desensitization and the recovery from desensitization but maintained those involved in the early phase of desensitization. Of course, this simplification means a loss of quality, but the obtained fits should be sufficient to decide whether binding and/or gating are responsible for the modified amplitudes and time courses of the current responses.
Assembly and Plasma Membrane Trafficking of hP2X3 Receptor Mutants
To check for expression system-specific differences and also to assess their assembly capacitance, we expressed selected mutants (K63A, G66A, T172A, K176A, N279A, R281A, K284A, R295A, and K299A), which responded in HEK cells with rather small or even no current amplitudes to α,β-meATP (100 μm) in X. laevis oocytes. The α,β-meATP concentration-response curve of oocyte-expressed WT hP2X3 receptors exhibited EC50 and Emax values of 3.14 ± 0.75 μm and 3.68 ± 0.41 μA, respectively; the Hill coefficient was 1.28 ± 0.49 (n = 6 each). In agreement with the patch clamp data in HEK293 cells, the α,β-meATP (100 μm)-induced current responses were markedly depressed or even abolished on the selected mutants in comparison with WT hP2X3 receptor currents (Fig. 6A). In addition, changes in the speed of activation and desensitization were also comparable in recordings from oocytes and HEK293 cells (compare Fig. 5b with 5a). It should be noted, however, that because of the relatively slow application speed and the short inter-application interval of α,β-meATP (100 μm) (see “Experimental Procedures”), no time constants for activation/desensitization were calculated for oocytes.
FIGURE 6.

Sensitivity to α,β-meATP and assembly and surface expression of hP2X3 mutants in X. laevis oocytes. A, typical two-electrode voltage clamp current traces recorded from oocytes expressing the hP2X3 receptor or its selected NBS mutants as indicated. α,β-meATP (100 μm) caused smaller current amplitudes at all nine mutants tested than at the WT receptor. Mutants K63A, K276A, and K299A were unable to mediate any current response. Each symbol indicates mean ± S.E. of 5–6 oocytes. *, p < 0.05; statistically significant difference from the WT receptor. B, [35S]methionine-labeled oocytes were chased for 24 h and surface-labeled with the membrane-impermeant fluorescent Cy5 dye prior to protein purification by non-denaturing nickel-nitrilotriacetic acid chromatography. B, panel a, oligomeric state of the P2X3 proteins as visualized by blue native PAGE and 35S phosphorimaging. The ovals schematically illustrate the migration positions of the non-denatured trimeric state and dimeric and monomeric states produced by partial or complete denaturation with SDS treatment, respectively. Panel b, aliquots of the same samples shown in panel a were denatured with reducing SDS-PAGE sample buffer, resolved by SDS-urea-PAGE, and visualized in their Cy5-labeled surface form by Typhoon fluorescence scanning. Each mutant was analyzed at least twice with identical results.
The mutations may affect the assembly and cell surface expression of the hP2X3 mutants. To address this issue, we used the nine single mutants with impaired function in the oocyte expression system, which has the strong advantage that the cell integrity needed for reliable cell surface labeling can be easily assessed by visual inspection. Assembly (Fig. 6B, panel a) and cell surface expression (Fig. 6B, panel b) were investigated by blue native PAGE in the [35S]methionine-labeled form and by SDS-PAGE in the Cy5 cell surface-labeled form, respectively. Like the WT hP2X3 receptor subunit, all P2X3 mutants with impaired function were also capable of assembling to homotrimers (Fig. 6B, panel b). All mutants appeared at the cell surface, albeit at different levels (note for example the rather weak surface expression of R295A and K299A). Thus, with these two mutants, the failure of α,β-meATP (100 μm) to induce a current response (Fig. 6A) may be due at least partly to the low degree of plasma membrane expression. However, in the case of all other mutants investigated in the oocyte system, the trafficking to the cell membrane was roughly equal with that of the WT receptor.
Homology Modeling of the hP2X3 Receptor
Eventually, based on the published crystal structure of the zfP2X4 (18), we modeled the hP2X3 receptor. The NBSs shown to be involved in agonist binding were situated at opposite sites of the same subunit (Fig. 7B) and were therefore able to form a binding pocket only at the interface of two adjacent subunits (Fig. 7A, panels a and b). Of the conserved residues investigated, many were oriented toward the groove of the pocket, indicating that they may bind ATP directly (Lys-63, Lys-65, Lys-176, Asn-279, Arg-281, Arg-295, Lys-299); our experiments confirm that Ala substitution of these AA residues causes marked changes in the amplitude and/or gating and possibly desensitization kinetics of the current responses. In contrast, some of the conserved AA residues, such as Thr-172, Asn-177, and Phe-280, were oriented away from the groove, although their replacement with Ala caused pronounced changes, suggesting that they may participate in transducting conformational information changes from the binding pocket to the ion channel. Ala-283 is located relatively far from the binding pocket; however, the substitution of Ala by negatively (Asn) or positively (Arg) charged AAs had prominent effects. Ala substitution of the non-conserved AAs Thr-62, Phe-174, Phe-282, and Phe-301 caused only minor changes, irrespective of their orientation toward (Phe-174, Phe-301) or away (Thr-62, Phe-282) from the binding pocket. Replacement of the non-conserved Lys-284 by Ala had a marked effect both on the current amplitude and on its time course. However, structural considerations in conjunction with our poor kinetic fits make the involvement of this AA in agonist binding unlikely (see “Activation, Gating, and Desensitization of hP2X3 Receptor Mutants”).
FIGURE 7.

Model of the hP2X3 receptor. A, panel a, extracellular loop of the hP2X3 trimer. The individual subunits are labeled by different colors. Panel b, detailed view of the supposed binding site at the interface of two neighboring subunits containing four binding segments (NBSs). Color coding of the amino acid residues is: blue, NBS1; red, NBS2; yellow, NBS3; green, NBS4. B, NBS1–2 and NBS3–4 are located at opposite sites of a single subunit.
DISCUSSION
P2X3 receptors are mostly limited to the neuronal pathways involved in the perception and conduction of painful stimuli (20, 21). This highly circumscribed distribution in the peripheral and central nervous system is a prerequisite to develop new drugs for the selective treatment of pain. The peripheral terminals of sensory neurons, situated for example in dorsal root ganglia, possess P2X3 receptors, which react to ATP released by all types of nociceptive stimuli. Antagonists at these receptors have been shown to effectively block both hyperalgesia and allodynia in different models of pathological pain (42).
In view of the great significance of P2X3 receptors for future therapeutic strategies to medicate various pain states, we set out to investigate the AA residues involved in agonist binding, the more so because in contrast to most P2X receptor types, in the case of P2X3, we dispose of some selective agonists and antagonists (22). Our purpose was to characterize the ATP binding site of the P2X3 receptor to alleviate the computer-assisted design of new antagonists for therapeutic purposes. Although mutagenesis studies at P2X1 (6, 8, 43, 44), P2X2 (7, 45), and P2X4 (39, 40) have identified several AA residues of the respective receptors, which are indispensable for agonist binding, similar information for P2X3 receptors is scarce (45) (Table 1). Bioinformatics and receptor modeling suggested the existence of four putative ATP binding sites per each subunit (19, 46). The possibility of there being more than one ATP binding site per monomer cannot be ruled out at the present (17) but is rather unlikely. More importantly, instead of individual amino acids, groups of AAs organized in four nucleotide binding segments were proposed to mediate the nucleotide effects (19).
TABLE 1.
Nucleotide binding segments of P2X receptors
Closed circle, major decrease in activity; open circle, slight decrease in activity or change only with Ca2+ imaging; h, human receptor; r, rat receptor; zf, zebrafish receptor mutant; conserved amino acids are indicated with bold lettering.

3 Replacement of alanine-283 by aspartate or arginine, or replacement of all residual investigated amino acids by alanine with α,β-meATP as the agonist (present study).
In the present study, we systematically replaced all conserved AAs in the NBSs of the hP2X3 subunit (plus 1–2 non-conserved AAs in each NBS) and searched for changes in agonist potency by means of electrophysiology and Ca2+ imaging in two expression systems (HEK293 cells, X. laevis oocytes). In the first place, we confirmed our previous results relating to the critical importance of a few positively charged AAs (K63A, K65A, K176A, R281A, R295A, K299A (37, 45)). Then, the involvement of a range of further AAs in agonist binding, agreeing with a comparable role of these AAs in the hP2X1, rP2X2, and rP2X4, was also documented (Table 1 and references cited therein). However, we report in addition three key findings. 1) Unequivocal, although sometimes minor, changes occurred in the amplitude of the current and/or [Ca2+]i response when further conserved (Phe-171, Leu-297) or non-conserved (Thr-62, Phe-174, Lys-284, Phe-301) AAs were replaced by Ala or Ala itself was substituted by other AAs (A283D, A283R). 2) The agonist potency decrease was additive when two adjacent AAs were replaced simultaneously by Ala (Lys-65/Gly-66, Phe-171/Thr-172, Asn-279/Phe-280, Phe-280/Arg-281) but was not altered after Ala substitution of two non-adjacent AAs of the same NBS (Phe-171/Asn-177). 3) The decrease in current amplitude was accompanied in many cases by a pronounced decrease in the activation and/or desensitization rate of the receptor mutants (K65A, G66A, N279A). With R281A, a depression of the current amplitude was not accompanied by a concomitant change in the speed of activation or desensitization.
Signals that regulate intracellular trafficking of P2X receptors and thereby their membrane expression are usually associated with the N (47) or C terminus of these receptors (48, 49). Disrupting some of the conserved disulfide bridges of the extracellular loop of P2X subunits also markedly depresses their trafficking to the cell surface (50, 51). However, in this case, the normal folding of the protein appears to be altered, and the trafficking defects might be due to a failure to pass the quality check test that takes place in the endoplasmic reticulum rather than due to a trafficking defect per se. Thus, it was not astonishing that the present mutations in the NBSs in general did not modify the insertion of the P2X3 receptor mutants into the cell membrane of oocytes. A major change occurred only with R295A and K299A, which were expressed at a lower quantity, partially explaining the abolition of current amplitudes in the voltage clamp recordings. In the case of all other mutants, the decrease of the current response was certainly not the consequence of a disturbed trafficking behavior.
An inventive approach demonstrated by co-expression of wild-type P2X3 and a mutant P2X2, where Lys-69 or -308 was mutated to Ala, that the resulting P2X2/3 receptor functioned normally but not when both Lys residues were mutated to Ala (52). However, co-expression of wild-type P2X2 with a correspondingly mutated P2X3 subunit (K63A or K299A) produced non-functional heteromers. Thus, the failure to rescue function in the P2X2 subunit with both Lys residues mutated, by wild-type P2X3, suggests that residues from two different subunits interact in agonist binding. Similarly, the replacement of two conserved residues, Lys-68 and Phe-291 (Lys-63, Phe-280; P2X3 numbering), by cysteine led to disulfide cross-linking between neighboring P2X1 subunits (53). Because mutation of these residues results in a decreased ATP potency and cysteine cross-linking is prevented in the presence of ATP, an intersubunit ATP binding site was proposed to operate. In agreement with this idea, our P2X3 receptor model, developed on the basis of the crystal structure of the P2X4 receptor (18), suggested in conjunction with the mutagenesis results that NBS1–2 and NBS3–4 as a whole shape the binding pocket for ATP. These findings lend support to our previous hypothesis (19, 46) that instead of a few amino acid residues as generally believed, at least four NBSs are needed for the docking of ATP to the P2X3 receptor. The kinetic modeling of the agonist-induced currents on some of the receptor mutants suggested the involvement of AA residues (Lys-65, Phe-174, Phe-280, Arg-281) in ligand binding, although a gating function could also be attributed to Phe-174. In accordance with these results, the use of the full agonist ATP and the partial agonist BzATP for P2X1 suggested that certain AAs of the extracellular loop have a gating function (8). The homology modeling of the receptor structure documented that a few conserved AA residues, such as Thr-172, Asn-177, and Phe-280, were in the closed state oriented away from the groove, although their replacement with Ala caused marked changes, suggesting that they may participate in transducting conformational information changes from the binding pocket to the ion channel. In addition, the replacement of Gly-66 by Ala markedly depressed both the current and the [Ca2+]i responses. It is quite possible that the flexible nature of this AA would allow conformational changes to occur, as suggested for Gly-250 in P2X1 receptors (43).
In conclusion, polypeptide clusters, rather than individual AAs, might be responsible for agonist binding, gating, and desensitization of P2X3 receptors.
Supplementary Material
Acknowledgments
We are grateful to Sara Wiese, Nanette Messemer, and Martin Fuchs for methodological help. We thank Dr. Kerstin Wirkner for useful discussions.
This work was supported by grants from the Deutsche Forschungsgemeinschaft (Grants IL 20/11-3; WI 1674/4-1; and IL20/18-2) and the Volkswagen Foundation (Grant I/82 940).

The on-line version of this article (available at http://www.jbc.org) contains supplemental Figs. 1 and 2.
- AA
- amino acids
- NBS
- nucleotide binding segment
- h
- human
- r
- rat
- zf
- zebrafish
- ORi
- oocyte Ringer's solution
- α,β-meATP
- α,β-methylene ATP
- FR
- fluorescence ratio
- TNP-ATP
- 2′(3′)-O-(2,4,6-trinitrophenyl)adenosine 5′-triphosphate
- BzATP
- dibenzoyl-ATP.
REFERENCES
- 1. Khakh B. S., North R. A. (2006) Nature 442, 527–532 [DOI] [PubMed] [Google Scholar]
- 2. Nicke A., Bäumert H. G., Rettinger J., Eichele A., Lambrecht G., Mutschler E., Schmalzing G. (1998) EMBO J. 17, 3016–3028 [DOI] [PMC free article] [PubMed] [Google Scholar]
- 3. Aschrafi A., Sadtler S., Niculescu C., Rettinger J., Schmalzing G. (2004) J. Mol. Biol. 342, 333–343 [DOI] [PubMed] [Google Scholar]
- 4. Illes P., Alexandre Ribeiro J. (2004) Eur. J. Pharmacol. 483, 5–17 [DOI] [PubMed] [Google Scholar]
- 5. Freist W., Verhey J. F., Stühmer W., Gauss D. H. (1998) FEBS Lett. 434, 61–65 [DOI] [PubMed] [Google Scholar]
- 6. Ennion S., Hagan S., Evans R. J. (2000) J. Biol. Chem. 275, 29361–29367 [DOI] [PubMed] [Google Scholar]
- 7. Jiang L. H., Rassendren F., Surprenant A., North R. A. (2000) J. Biol. Chem. 275, 34190–34196 [DOI] [PubMed] [Google Scholar]
- 8. Roberts J. A., Evans R. J. (2004) J. Biol. Chem. 279, 9043–9055 [DOI] [PubMed] [Google Scholar]
- 9. Vial C., Roberts J. A., Evans R. J. (2004) Trends Pharmacol. Sci. 25, 487–493 [DOI] [PubMed] [Google Scholar]
- 10. Evans R. J. (2009) Eur. Biophys. J. 38, 319–327 [DOI] [PubMed] [Google Scholar]
- 11. Ding S., Sachs F. (1999) J. Gen. Physiol. 113, 695–720 [DOI] [PMC free article] [PubMed] [Google Scholar]
- 12. Riedel T., Lozinsky I., Schmalzing G., Markwardt F. (2007) Biophys. J. 92, 2377–2391 [DOI] [PMC free article] [PubMed] [Google Scholar]
- 13. Sokolova E., Skorinkin A., Fabbretti E., Masten L., Nistri A., Giniatullin R. (2004) Br. J. Pharmacol. 141, 1048–1058 [DOI] [PMC free article] [PubMed] [Google Scholar]
- 14. Karoly R., Mike A., Illes P., Gerevich Z. (2008) Mol. Pharmacol. 73, 224–234 [DOI] [PubMed] [Google Scholar]
- 15. Nakazawa K., Yamakoshi Y., Tsuchiya T., Ohno Y. (2005) Eur. J. Pharmacol. 518, 107–110 [DOI] [PubMed] [Google Scholar]
- 16. Shinozaki Y., Sumitomo K., Tsuda M., Koizumi S., Inoue K., Torimitsu K. (2009) PLoS. Biol. 7, e103. [DOI] [PMC free article] [PubMed] [Google Scholar]
- 17. Young M. T. (2010) Trends Biochem. Sci. 35, 83–90 [DOI] [PMC free article] [PubMed] [Google Scholar]
- 18. Kawate T., Michel J. C., Birdsong W. T., Gouaux E. (2009) Nature 460, 592–598 [DOI] [PMC free article] [PubMed] [Google Scholar]
- 19. Mager P. P., Weber A., Illes P. (2004) Curr. Top Med. Chem. 4, 1657–1705 [DOI] [PubMed] [Google Scholar]
- 20. Chizh B. A., Illes P. (2001) Pharmacol. Rev. 53, 553–568 [PubMed] [Google Scholar]
- 21. Wirkner K., Sperlagh B., Illes P. (2007) Mol. Neurobiol. 36, 165–183 [DOI] [PubMed] [Google Scholar]
- 22. Jarvis M. F., Khakh B. S. (2009) Neuropharmacology 56, 208–215 [DOI] [PubMed] [Google Scholar]
- 23. Gerevich Z., Zadori Z., Müller C., Wirkner K., Schröder W., Rubini P., Illes P. (2007) Br. J. Pharmacol. 151, 226–236 [DOI] [PMC free article] [PubMed] [Google Scholar]
- 24. Koshimizu T., Koshimizu M., Stojilkovic S. S. (1999) J. Biol. Chem. 274, 37651–37767 [DOI] [PubMed] [Google Scholar]
- 25. He M. L., Koshimizu T. A., Tomić M., Stojilkovic S. S. (2002) Mol. Pharmacol. 62, 1187–1197 [DOI] [PubMed] [Google Scholar]
- 26. Fountain S. J., North R. A. (2006) J. Biol. Chem. 281, 15044–15049 [DOI] [PubMed] [Google Scholar]
- 27. Zhou Z., Monsma L. R., Hume R. I. (1998) Biochem. Biophys. Res. Commun. 252, 541–545 [DOI] [PubMed] [Google Scholar]
- 28. Wirkner K., Stanchev D., Köles L., Klebingat M., Dihazi H., Flehmig G., Vial C., Evans R. J., Fürst S., Mager P. P., Eschrich K., Illes P. (2005) J. Neurosci. 25, 7734–7742 [DOI] [PMC free article] [PubMed] [Google Scholar]
- 29. Stanchev D., Flehmig G., Gerevich Z., Nörenberg W., Dihazi H., Fürst S., Eschrich K., Illes P., Wirkner K. (2006) Neurosci. Lett 393, 78–83 [DOI] [PubMed] [Google Scholar]
- 30. Gerevich Z., Zadori Z. S., Köles L., Kopp L., Milius D., Wirkner K., Gyires K., Illes P. (2007) J. Biol. Chem. 282, 33949–33957 [DOI] [PubMed] [Google Scholar]
- 31. Milescu L. S., Akk G., Sachs F. (2005) Biophys. J. 88, 2494–2515 [DOI] [PMC free article] [PubMed] [Google Scholar]
- 32. Schmalzing G., Gloor S., Omay H., Kröner S., Appelhans H., Schwarz W. (1991) Biochem. J. 279, 329–336 [DOI] [PMC free article] [PubMed] [Google Scholar]
- 33. Hausmann R., Rettinger J., Gerevich Z., Meis S., Kassack M. U., Illes P., Lambrecht G., Schmalzing G. (2006) Mol. Pharmacol. 69, 2058–2067 [DOI] [PubMed] [Google Scholar]
- 34. Becker D., Woltersdorf R., Boldt W., Schmitz S., Braam U., Schmalzing G., Markwardt F. (2008) J. Biol. Chem. 283, 25725–25734 [DOI] [PubMed] [Google Scholar]
- 35. Fiser A., Sali A. (2003) Methods Enzymol. 374, 461–491 [DOI] [PubMed] [Google Scholar]
- 36. Humphrey W., Dalke A., Schulten K. (1996) J. Mol. Graph. 14, 33–38 [DOI] [PubMed] [Google Scholar]
- 37. Fischer W., Zadori Z., Kullnick Y., Gröger-Arndt H., Franke H., Wirkner K., Illes P., Mager P. P. (2007) Eur. J. Pharmacol. 576, 7–17 [DOI] [PubMed] [Google Scholar]
- 38. North R. A., Surprenant A. (2000) Annu. Rev. Pharmacol. Toxicol. 40, 563–580 [DOI] [PubMed] [Google Scholar]
- 39. Yan Z., Liang Z., Tomic M., Obsil T., Stojilkovic S. S. (2005) Mol. Pharmacol. 67, 1078–1088 [DOI] [PubMed] [Google Scholar]
- 40. Zemkova H., Yan Z., Liang Z., Jelinkova I., Tomic M., Stojilkovic S. S. (2007) J. Neurochem. 102, 1139–1150 [DOI] [PubMed] [Google Scholar]
- 41. Egan T. M., Khakh B. S. (2004) J. Neurosci. 24, 3413–3420 [DOI] [PMC free article] [PubMed] [Google Scholar]
- 42. Donnelly-Roberts D., McGaraughty S., Shieh C. C., Honore P., Jarvis M. F. (2008) J. Pharmacol. Exp. Ther. 324, 409–415 [DOI] [PubMed] [Google Scholar]
- 43. Digby H. R., Roberts J. A., Sutcliffe M. J., Evans R. J. (2005) J. Neurochem. 95, 1746–1754 [DOI] [PubMed] [Google Scholar]
- 44. Roberts J. A., Digby H. R., Kara M., El Ajouz S., Sutcliffe M. J., Evans R. J. (2008) J. Biol. Chem. 283, 20126–20136 [DOI] [PMC free article] [PubMed] [Google Scholar]
- 45. Browne L. E., Jiang L. H., North R. A. (2010) Trends Pharmacol. Sci. 31, 229–237 [DOI] [PMC free article] [PubMed] [Google Scholar]
- 46. Mager P. P., Illes P. (2006) Expert Opin. Drug Discov. 1, 202–309 [DOI] [PubMed] [Google Scholar]
- 47. Ormond S. J., Barrera N. P., Qureshi O. S., Henderson R. M., Edwardson J. M., Murrell-Lagnado R. D. (2006) Mol. Pharmacol. 69, 1692–1700 [DOI] [PubMed] [Google Scholar]
- 48. Chaumont S., Jiang L. H., Penna A., North R. A., Rassendren F. (2004) J. Biol. Chem. 279, 29628–29638 [DOI] [PubMed] [Google Scholar]
- 49. Murrell-Lagnado R. D., Qureshi O. S. (2008) Mol. Membr. Biol. 25, 321–331 [DOI] [PubMed] [Google Scholar]
- 50. Newbolt A., Stoop R., Virginio C., Surprenant A., North R. A., Buell G., Rassendren F. (1998) J. Biol. Chem. 273, 15177–15182 [DOI] [PubMed] [Google Scholar]
- 51. Ennion S. J., Evans R. J. (2002) Mol. Pharmacol. 61, 303–311 [DOI] [PubMed] [Google Scholar]
- 52. Wilkinson W. J., Jiang L. H., Surprenant A., North R. A. (2006) Mol. Pharmacol. 70, 1159–1163 [DOI] [PubMed] [Google Scholar]
- 53. Marquez-Klaka B., Rettinger J., Bhargava Y., Eisele T., Nicke A. (2007) J. Neurosci. 27, 1456–1466 [DOI] [PMC free article] [PubMed] [Google Scholar]
Associated Data
This section collects any data citations, data availability statements, or supplementary materials included in this article.