Abstract
Chirality is an important feature of three-dimensional objects and a key concept in chemistry, biology and many other disciplines. However, it has been difficult to quantify, largely owing to computational complications. Here we present a general chirality measure, called the chiral invariant (CI), which is applicable to any three-dimensional object containing a large amount of data. The CI distinguishes the hand of the object and quantifies the degree of its handedness. It is invariant to the translation, rotation and scale of the object, and tolerant to a modest amount of noise in the experimental data. The invariant is expressed in terms of moments and can be computed in almost no time. Because of its universality and computational efficiency, the CI is suitable for a wide range of pattern-recognition problems. We demonstrate its applicability to molecular atomic models and their electron density maps. We show that the occurrence of the conformations of the macromolecular polypeptide backbone is related to the value of the CI of the constituting peptide fragments. We also illustrate how the CI can be used to assess the quality of a crystallographic electron density map.
Keywords: computational chemistry, pattern recognition, structural biology
1. Introduction
1.1. Chirality of three-dimensional objects
Deviations from what is often perceived as harmonious symmetry have long fascinated philosophers, artists and scientists. The effects of breaking symmetry are often far-reaching and can be observed almost everywhere around us. One immediate consequence of asymmetry manifests itself in what is referred to as chirality. Chirality is an important feature of many objects in the real world, perhaps best illustrated by the human hands. Generally, three-dimensional objects, such as the left or right hand, are called chiral if they cannot be superimposed on their mirror image. Conversely, objects possessing mirror planes, inversion axes or a centre of symmetry are identical to their mirror image and are said to be achiral [1].
Chirality is a key concept and an intuitive and discriminative descriptor for many objects, particularly in the biological realm. For example, the twisting that provides mechanical stability to spiral leafs is proposed to arise from chirality at the molecular level [2,3]. In many biochemical processes, a chiral arrangement of atoms behaves differently from its mirror image, or enantiomer. For instance, the enantiomers of serine have different roles in the mammalian brain, and specialized enzymes are needed for the in vivo interconversion of one form to the other [4]. Throughout evolution, the biological world has acquired very efficient means to discriminate the enantiomers. Some enantiomers are distinguished by smell [5] or taste [6], and their perception may induce completely different responses. One example is the female sex pheromone in the scarab beetle, which is highly attractive to the males, whereas its enantiomer entirely inhibits the response [7].
From a pharmaceutical perspective, a failure to distinguish a drug from its enantiomer can have dire consequences. For example, several barbiturates show a depressant activity in one chiral form but are excitatory in the other [8]. (R)-Albuterol, a bronchodilator that increases the bronchial-airway diameter without raising the heart rate, is indirectly antagonized by its enantiomer, (S)-albuterol. Since (S)-albuterol is degraded slower than (R)-albuterol, the potentially harmful enantiomer tends to accumulate [9]. Because there is no reason to assume that the enantiomer of a therapeutically active component is free from undesirable effects [10], development of new stereoisomeric drugs has been tightly regulated [11].
1.2. Chirality and pattern recognition
The investigation of three-dimensional objects, whether chiral or achiral, is largely based on the use of pattern recognition. This is perhaps the most important process in the acquisition of knowledge and the driving force behind the development of any scientific discipline. Recognizing differences and similarities within and between species or expressing the patterns observed in experimental data in the form of rules and equations are examples of applied pattern recognition. As biology becomes increasingly amenable to quantification, there is an emerging need for dedicated pattern-recognition tools. Indeed, the human brain is considered the most sophisticated and powerful pattern-recognition machine in existence. One primary goal of pattern recognition is to reduce a wealth of information to a manageable set of characteristics (features) that map patterns to predefined classes, and thus assign a meaning to a signal. Chirality is one such feature.
In chemistry, molecules are classified as either chiral or achiral, and there are well-established conventions defining the handedness of each chiral centre. However, chirality has been difficult to quantify, and different chirality measures have been proposed in different fields [12,13]. A suitable numerical chirality measure should ideally address two basic questions: (i) is the object left- or right-handed (e.g. the most common form of the DNA double helix has a twist that is conventionally called right-handed), and (ii) what is the degree of its handedness. Additionally, it should be continuous, invariant under rotation, translation and scaling, and it should change its sign when the object is mirrored. Preferably, a chiral feature for pattern recognition should be tolerant to a modest amount of noise, which is inevitable in experimental data. Finally, in order to be of practical use, it must be efficiently computable even for the large amount of data commonly encountered in life science-related problems.
One can view a chirality measure as a tool for quantifying the difference in shape between an object and its mirror image [14]. Indeed, many approaches have been based on a comparison of the two enantiomorphs. Although the question of whether an object is symmetric about a given plane is straightforward to answer, the problem becomes hard when the location of the potential mirror plane is unknown. The associated computational complexity largely prohibits the use of such comparative methods in pattern-recognition applications. Osipov et al. [15] addressed the problem differently and derived chirality measures by analogy with the theory of optical activity, which quantifies the physical property of rotating the plane of plane-polarized light [16,17]. For a density distribution ρ(r), which for a body consisting of point atoms is a set of delta functions, Osipov et al. [15] arrived at the so-called universal chirality index G0 by integration over all possible combinations of sets of four points in space, r1, r2, r3 and r4,
 |
1.1 |
where ri = [xi, yi, zi]T, rij = ri − rj, rij = ‖ rij ‖, and a and b are arbitrary integers, defining a set of differently scaled chirality indices. They proposed a = 2, b = 1, for which equation (1.1) yields a scale-invariant quantity. It may be shown that equation (1.1) integrates to zero for a = b = 0. If ρ(r) is normalized to be a probability density function, G0 becomes independent of the unit of ρ(r). The index G0, computed locally from the atomic coordinates of short amino acid sequences in crystal structures, has been used in the classification of protein secondary structure [18,19]. Although an analytical expression of G0 can be derived for simple three-dimensional shapes [15], the numerical evaluation of equation (1.1) has a complexity O(N4) for objects sampled at N points, which becomes computationally intractable once N exceeds a few hundred.
An attractive alternative is the use of moment invariants, which can be computed in time proportional to the size of the object. Moments that are invariant under rotation for two-dimensional objects were first studied by Hu [20], and in three-dimensional space by Sadjadi & Hall [21]. Several publications on three-dimensional moment invariants have appeared since then, but there is still no equivalent of the two-dimensional ‘skew invariant’ in three dimensions [22–25], which would be able to distinguish the two mirror images of the same object. In this paper, we present a way to solve this problem by evaluating equation (1.1) in O(N) time using moment invariants. This offers a means of fast computation of an object's chirality, since the size of the object is no longer a limiting factor. Applications of the method to various three-dimensional objects and biological problems are presented and discussed.
2. Results and discussion
2.1. The chirality index as a three-dimensional moment invariant
For any non-negative integers, l, m and n, the raw moments (Mlmn) of order l + m + n of a three-dimensional density distribution function ρ(x, y, z) are defined by
| 2.1 |
If ρ(x, y, z) is a piecewise continuous and bounded function which is non-zero only in a finite part of R3, moments of all orders exist and their sequence {Mlmn} is uniquely determined by ρ(x, y, z). In the same way ρ(x, y, z) is uniquely determined by {Mlmn} [21].
The central moments (μlmn), which are invariant under translation, are taken about the mean of the object,
 |
2.2 |
where the components of the mean are defined by
By choosing a = 0, b = −2, the denominator in equation (1.1) is eliminated and the integral can be expressed in the form
 |
2.3 |
where li, mi and ni are non-negative integer powers. Integrating equation (2.3) over R3 allows the chirality index to be expressed as a sum of products of four moments
| 2.4 |
This is the simplest, but not the only way to eliminate the fraction in equation (1.1). One can, in principle, use higher absolute powers but since they are increasingly sensitive to noise, the application to practical cases with experimental data would become difficult if not impossible. Setting a = 0 and b = −2 reflects a trade-off between computational efficiency and robustness.
For central moments, equation (2.4) is invariant under translation. Invariance under rotation follows the rotation invariance of equation (1.1) itself. We note that to make the chirality index dimensionless and invariant to the size of the object, each central moment μlmn of order l + m + n should be multiplied by the factor
| 2.5 |
where s is a suitable rotation-invariant linear metric, e.g. the radius of gyration of the object
 |
2.6 |
or the cubic root of the volume of the approximating ellipsoid
 |
2.7 |
As the volume of the approximating ellipsoid approaches zero for near-planar objects, it may be of limited use for scaling purposes. In contrast, the radius of gyration works well in practical applications (see equation (A 5)).
Equation (2.4) yields one particular chiral invariant (hereafter denoted as CI) of the general form of equation (1.1), which has the attractive property of O(N) complexity. The fully expanded expression in terms of central moments is given in equations (A 1)–(A 5) of appendix A.
2.2. Representative applications
2.2.1. Biphenyl
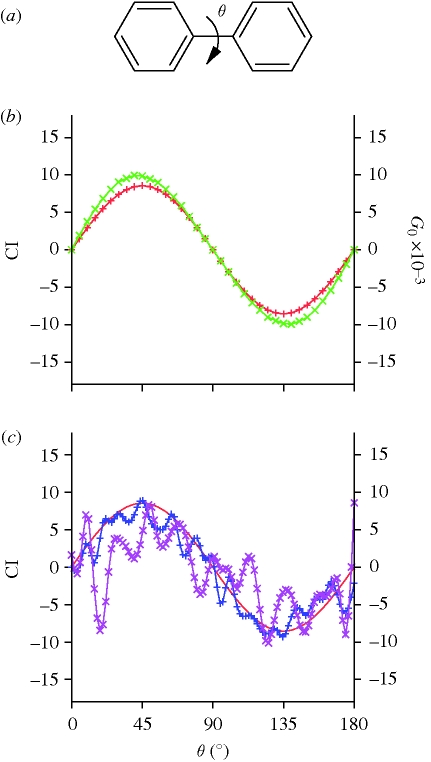
Biphenyl (figure 1a) is an achiral planar molecule [26]. However, as the torsion angle θ around the central C–C bond between two phenyl rings departs from zero, the molecule becomes chiral. At an angle of 90°, the molecule possesses two mirror planes, and is again achiral. For torsion angles higher than 90°, the chirality of biphenyl is reversed. Osipov et al. [15] used the biphenyl molecule to illustrate their general chirality index G0. In figure 1b we compare the values of CI, equation (A 4) (red curve) with the corresponding values of G0, where a = 2 and b = 1 (green curve). The density distribution ρ(r) is zero everywhere except at the atomic centres of the biphenyl molecule, where it takes the value of the atomic number of the corresponding atom (hydrogen atoms do not significantly affect the results and were excluded for the sake of simplicity). The curves for both CI and the index of Osipov et al. behave similarly. In the case of CI, the curve is perfectly sinusoidal and the index assumes its highest absolute values at θ = 45° and θ = 135°. This correlates nicely with the expected dependence of the chirality on the value of the biphenyl torsion angle. The behaviour of CI when applied to data with moderate amount of noise is illustrated in figure 1c, where a normally distributed random shift is applied to the coordinates of the biphenyl molecule. While the CI tolerates a coordinate error of 0.40 Å reasonably well (blue curve), an error of 1.0 Å (purple curve) results in essentially random values.
Figure 1.
The CI for biphenyl as a function of the inter-ring torsion angle. (a) A chemical formula for the biphenyl molecule with inter-ring torsion angle θ indicated. (b) The CI of the biphenyl molecule as a function of θ (red curve). Unlike G0 (green curve), the values of CI, obtained with equations (A 4) and (A 5), exhibit a perfectly sinusoidal dependence on the inter-ring torsion angle. (c) The effect of noise on the values of CI. The blue and purple curves show the CI when a normally distributed error of 0.4 Å and 1.0 Å, respectively, is applied to the coordinates of biphenyl after each rotation. For reference, the red curve is the undisturbed CI from (b).
2.2.2. Tartaric acid
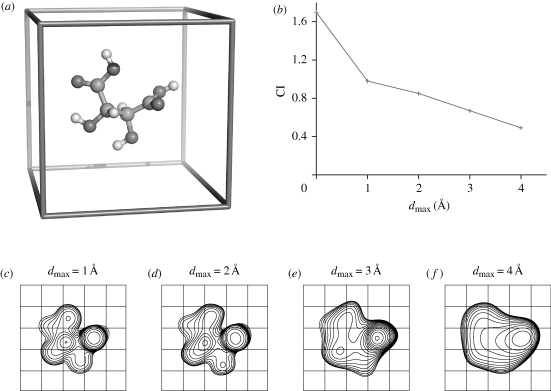
Tartaric acid (figure 2a) is one of the earliest known chiral molecules. Here, we use it to assess the sensitivity of CI to the smoothness of the distribution ρ(r). We computed electron density maps from the coordinates of l-tartaric acid at successively lower resolutions (figure 2c–f). Here the values of ρ(r) correspond to the electron density height at each point r on a cubic grid. At high resolution (dmax = 1.0 Å), the electron density closely resembles the atomic structure. As resolution decreases, the electron density becomes less detailed, until it eventually appears as an almost achiral ellipsoidal blob (dmax = 4.0 Å). The magnitude of CI follows the resolvability of the electron density and reflects the gradual drop in the degree of its chirality as resolution decreases (figure 2b).
Figure 2.
The CI for l-tartaric acid. (a) A tartaric acid molecule placed in a 10 × 10 × 10 Å3 cubic unit cell, viewed approximately along the z-axis. (b) The CI for the tartaric acid electron density (values higher than 1σ above the mean) as a function of the upper resolution limit, dmax. As a reference, the value of CI computed from the tartaric acid xyz coordinates weighted by the corresponding atomic numbers is 1.7. (c–f) Overlapped two-dimensional projections of the electron density along the z-axis. The contours are drawn at 1σ above the mean. The upper resolution limit, dmax, is indicated.
2.2.3. Monellin
To date, most crystal structures of racemic mixtures have been determined in the centrosymmetric space group,  [27–29]. Under these conditions, the enantiomers are constrained to be exact mirror images of each other within the crystal. For monellin, a potently sweet protein consisting of a 44-residue A chain and a 50-residue B chain, separate crystal structures of the chemically synthesized d-form at 1.8 Å resolution (PDB code 2q33; [6]) and the natural l-form at 1.9 Å resolution (PDB code 1krl; [30]) are available. Even though d-monellin closely resembles the mirror image of l-monellin, their alignment is not exact: the A and B chains of the l-form superpose on their mirror images in the d-form with an all-atom root mean square deviation of 1.25 and 1.31 Å, respectively. We use these structural differences to assess the behaviour of CI in the presence of the experimentally observed differences.
We computed CI for the two forms of monellin from the deposited xyz coordinates. The density distribution, ρ(r), was equal to the value of the corresponding atomic number at atomic centres, and was zero elsewhere. As expected, the sign of CI differs for the l- and the d-forms, while the magnitude remains approximately the same (table 1). Some difference in the absolute values of CI for the A chain is caused by structural differences at the protein surface, in particular an N-terminal arginine, which is not modelled in the d-form. Recomputing the CI for l-monellin without the arginine side-chain atoms brings the value of its CI down to 5.2, close to its absolute value for the d-form. This Arg1 residue of chain A extends from the otherwise almost cylindrical molecule in a radial direction. In addition, the arginine residue is poorly ordered in the crystal structure.
Table 1.
The values of the CI, as well as G0 computed with a = 2 and b = 1, for the two enantiomers of monellin.
| l-monellin, chain A | l-monellin, chain B | d-monellin, chain A | d-monellin, chain B | |
|---|---|---|---|---|
| CI | 6.6 | 11.2 | −5.3 | −12.0 |
| G0 | 2.2 × 10¹⁰ | 3.3 × 10¹⁰ | −2.0 × 10¹⁰ | −3.3 × 10¹⁰ |
Such sensitivity (a change from 6.6 to 5.2) to one out of 44 residues is a reflection of a fundamental property of the CI—it is an index of the whole object based on the central moments. Changes at an object's periphery will affect its value to a higher extent than a rearrangement at the centre. Such effects are frequently observed in pattern recognition, particularly with the use of higher order moments.
We also used the structure of monellin to verify the rotation invariance of the chirality measure. Indeed, the deviations of the CI value as the protein chains were arbitrarily rotated are of the order of the computational rounding error.
2.2.4. Alanine di-peptide fragment
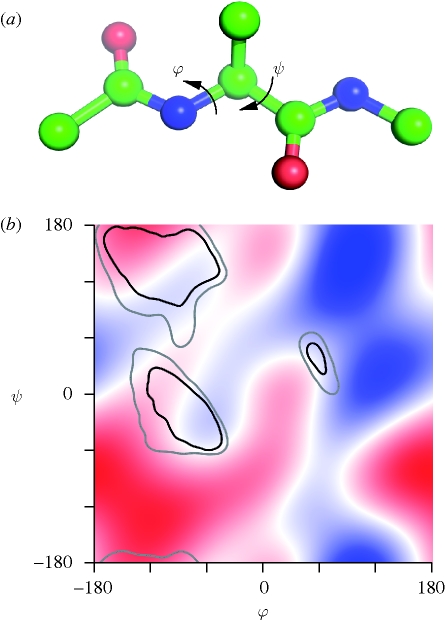
As was noted above, the CI is a property of the whole object, and therefore it reflects the total contribution of all chiral constituents. For instance, the value of the CI for an alanine fragment, N-(Cα-Cβ)-C, is marginally positive, while the sign of the invariant for an alanine di-peptide fragment, Cα-CO-N-(Cα-Cβ)-CO-N-Cα (figure 3a) alternates as the dihedral angles φ and ψ change (figure 3b). The absolute value of the CI also changes. Although we do not attempt to assess the full complexity of the protein chain arrangement and folding with this simple di-peptide fragment alone, there is an apparent relationship between the obtained distribution and the well-known Ramachandran plot of polypeptide stereochemistry [31]. The preferred polypeptide conformations are those for which the chirality of the di-peptide fragment is close to zero. We note that there are several other regions of low chirality of the di-peptide fragment in figure 3b. Thus, while CI must be close to zero in all polypeptides, this condition alone is insufficient to fully define the general distribution of peptides in φ, ψ-space. In any case, it is clear that the polypeptide conformations do not occur in φ, ψ-space, where the chirality is high (either positive or negative).
Figure 3.
The CI and the protein backbone conformations. (a) The structure of an alanine di-peptide fragment, Cα-CO-N-(Cα-Cβ)-CO-N-Cα, in the conformation with φ = −180°, ψ = −180°. (b) The CI for the alanine di-peptide fragment as a function of its backbone torsion angles φ and ψ. The value of CI is computed by taking ρ(r) equal to the atomic number at atomic centres, and zero elsewhere. The sign of the value of CI is represented by colour (blue is negative and red is positive) and the magnitude by the brightness of the colour. The inner contours include 90% of the non-glycine, non-proline and non-pre-proline residues in the Top500 database [35]; the outer contours cover 98% of the residues. The regions with high absolute values of the CI (bright colour in bottom left, top right and bottom right) do not normally occur in proteins.
There is also a noticeable difference in the value of the CI between α-helices, which have a marginally negative chirality, and β-sheets where the chirality is, overall, slightly positive (figure 3b). These results concur with those obtained in circular dichroism experiments, where the difference in the interaction of a molecule with a circularly polarized light is measured; the two enantiomeric forms of a chiral compound exhibit optical activities of opposite sign, echoing the specific nature of their interactions with oscillating electric and magnetic fields [32,33].
2.2.5. Phase quality in crystallographic electron density maps
The above examples demonstrate the descriptive power of the CI. Here, we present a case that also illustrates its discriminative power. Figure 4a–c displays the same region of a crystallographic electron density map computed with the same structure factor amplitudes but different, gradually improving, phases. For each grid point of each map, the value of the CI was computed from the non-negative electron density inside a sphere with 3 Å radius. The distribution of the values of CI is different for the three maps (figure 4d). For example, the value of the kurtosis, the fourth central moment, is 1.57, 0.58 and −0.14 for the initial, intermediate and final map, respectively. This indicates that the maps computed with progressively better crystallographic phases have lower peakedness of their local CI distribution. In other words, the maps with better phases contain fewer regions where CI is close to zero, the expected value for a featureless object. These results are very preliminary and thorough elaboration on the use of the discriminative power of the CI will be undertaken and published elsewhere.
Figure 4.
The CI for an electron density map. The map was computed for lysozyme measured to 1.54 Å resolution, using observed structure factor amplitudes and (a) phases obtained using anomalous dispersion from intrinsic sulphur atoms (red curve), (b) phases subsequently improved by density modification (blue curve) and (c) phases computed from the refined, final model (purple curve). The correlation coefficient to the map corresponding to the final model is 0.51, 0.81 and 1.0, respectively. (d) Distribution of the local value of the CI, computed from all non-negative density values within a sphere of 3 Å radius centred at each grid point of the map.
3. Conclusions
The CI presented here combines two important properties: its sign indicates the handedness of the object, and the magnitude represents the degree of its chirality. The value of CI is rotation-, translation- and scale-invariant. In addition, the CI is robust towards experimental uncertainties present in the data. For a random or featureless three-dimensional distribution of any size, the value of CI approaches zero, within the computational rounding error. As a result of its rapid and straightforward computation, the CI is suitable for the analysis and comparison of large datasets, such as macromolecular structures or, potentially, complex probability density distributions—volume images from clinical tomography are a typical example. Indeed, for an object consisting of one million points, the CPU requirements to compute the CI (equations (A 4) and (A 5)) are of the order of milliseconds on modern desktop computers.
Many pattern-recognition tasks may benefit from taking chirality into account. For instance, a recently developed tool for searching three-dimensional secondary structural patterns attributes some of its improved performance to the use of chirality [34]. Another example is the automated recognition of structural fragments in macromolecular X-ray crystallography, where the CI computed for a local region of the electron density (§2.2.5) can add information that is not provided by other shape descriptors. Shape-recognition approaches based on, for example, distance matrices or variance–covariance matrices are insensitive to the handedness of the object, and complementary use of the CI has the potential to increase the power of such methods.
Acknowledgements
We thank Drs Jan Flusser, Dong Xu, Richard J. Morris, Anastassis Perrakis, Matthew Groves and Ciaran Carolan for stimulating discussions. This work was supported by an EMBL pre-doctoral fellowship to J.H.
Appendix A. The CI
Let αi denote linear combinations of second-order central moments,
 |
A 1 |
βi linear combinations of third-order central moments,
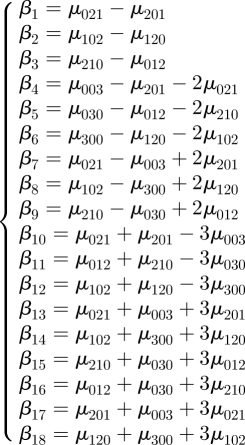 |
A 2 |
and γi linear combinations of fourth-order central moments,
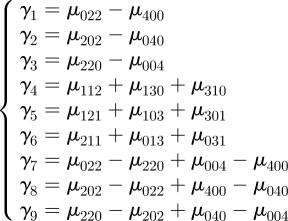 |
A 3 |
Then CI (equation (2.4)) can be written as
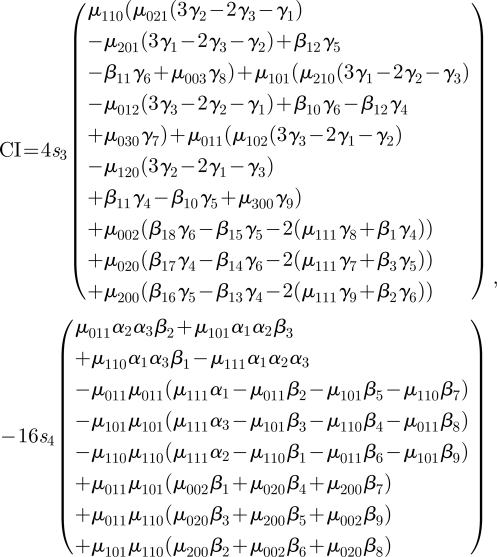 |
A 4 |
where s3 and s4 are scale factors,
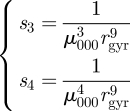 |
A 5 |
and rgyr is the radius of gyration of the object as defined in §2.1.
References
- 1.Ruch E. 1977. Chiral derivatives of achiral molecules: standard classes and the problem of a right–left classification. Angew. Chem. Int. Ed. Engl. 16, 65–72 10.1002/anie.197700653 (doi:10.1002/anie.197700653) [DOI] [Google Scholar]
- 2.Schulgasser K., Witztum A. 2004. Spiralling upward. J. Theor. Biol. 230, 275–280 10.1016/j.jtbi.2004.05.018 (doi:10.1016/j.jtbi.2004.05.018) [DOI] [PubMed] [Google Scholar]
- 3.Schulgasser K., Witztum A. 2004. The hierarchy of chirality. J. Theor. Biol. 230, 281–288 10.1016/j.jtbi.2004.05.012 (doi:10.1016/j.jtbi.2004.05.012) [DOI] [PubMed] [Google Scholar]
- 4.Wolosker H., Blackshaw S., Snyder S. H. 1999. Serine racemase: a glial enzyme synthesizing d-serine to regulate glutamate-N-methyl-d-aspartate neurotransmission. Proc. Natl Acad. Sci. USA 96, 13 409–13 414 10.1073/pnas.96.23.13409 (doi:10.1073/pnas.96.23.13409) [DOI] [PMC free article] [PubMed] [Google Scholar]
- 5.Laska M., Liesen A., Teubner P. 1999. Enantioselectivity of odor perception in squirrel monkeys and humans. Am. J. Physiol. Regul. Integr. Comp. Physiol. 277, R1098–R1103 [DOI] [PubMed] [Google Scholar]
- 6.Hung L.-W., Kohmura M., Ariyoshi Y., Kim H. 1998. Structure of an enantiomeric protein, d-monellin at 1.8 Å resolution. Acta Crystallogr. D Biol. Crystallogr. 54, 494–500 10.1107/S0907444997012225 (doi:10.1107/S0907444997012225) [DOI] [PubMed] [Google Scholar]
- 7.Leal W. S. 1996. Chemical communication in scarab beetles: reciprocal behavioral agonist–antagonist activities of chiral pheromones. Proc. Natl Acad. Sci. USA 93, 12 112–12 115 10.1073/pnas.93.22.12112 (doi:10.1073/pnas.93.22.12112) [DOI] [PMC free article] [PubMed] [Google Scholar]
- 8.Bentley R. 2004. Chirality in biology. In Encyclopedia of molecular cell biology and molecular medicine, vol. 2 (ed. Meyers R.), pp. 579–618 2nd ed. Weinheim: Wiley-VCH [Google Scholar]
- 9.Agranat I., Caner H., Caldwell J. 2002. Putting chirality to work: the strategy of chiral switches. Nat. Rev. Drug Discov. 1, 753–768 10.1038/nrd915 (doi:10.1038/nrd915) [DOI] [PubMed] [Google Scholar]
- 10.Ariëns E. J. 1984. Stereochemistry, a basis for sophisticated nonsense in pharmacokinetics and clinical pharmacology. Eur. J. Clin. Pharmacol. 26, 663–668 10.1007/BF00541922 (doi:10.1007/BF00541922) [DOI] [PubMed] [Google Scholar]
- 11.FDA 1992. FDA's policy statement for the development of new stereoisomeric drugs. Chirality 4, 338–340 10.1002/chir.530040513 (doi:10.1002/chir.530040513) [DOI] [PubMed] [Google Scholar]
- 12.Buda A. B., Auf der Heyde T., Mislow K. 1992. On quantifying chirality. Angew. Chem. Int. Ed. Engl. 31, 989–1007 10.1002/anie.199209891 (doi:10.1002/anie.199209891) [DOI] [Google Scholar]
- 13.Petitjean M. 2003. Chirality and symmetry measures: a transdisciplinary review. Entropy 5, 271–312 10.3390/e5030271 (doi:10.3390/e5030271) [DOI] [Google Scholar]
- 14.Buda A. B., Mislow K. 1992. A Hausdorff chirality measure. J. Am. Chem. Soc. 114, 6006–6012 10.1021/ja00041a016 (doi:10.1021/ja00041a016) [DOI] [Google Scholar]
- 15.Osipov M. A., Pickup B. T., Dunmur D. A. 1995. A new twist to molecular chirality: intrinsic chirality indices. Mol. Phys. 84, 1193–1206 10.1080/00268979500100831 (doi:10.1080/00268979500100831) [DOI] [Google Scholar]
- 16.Boys S. F. 1934. Optical rotatory power. I. A theoretical calculation for a molecule containing only isotropic refractive centres. Proc. R. Soc. Lond. A 144, 655–675 10.1098/rspa.1934.0075 (doi:10.1098/rspa.1934.0075) [DOI] [Google Scholar]
- 17.Kirkwood J. G. 1937. On the theory of optical rotatory power. J. Chem. Phys. 5, 479–491 10.1063/1.1750060 (doi:10.1063/1.1750060) [DOI] [Google Scholar]
- 18.Pietropaola A., Muccioli L., Berardi R., Zannoni C. 2008. A chirality index for investigating protein secondary structures and their time evolution. Proteins 70, 667–677 10.1002/(ISSN)1097-0134 (doi:10.1002/(ISSN)1097-0134) [DOI] [PubMed] [Google Scholar]
- 19.Solymosi M., Low R. J., Grayson M., Neal M. P. 2002. A generalized scaling of a chiral index for molecules. J. Chem. Phys. 116, 9875–9881 10.1063/1.1476321 (doi:10.1063/1.1476321) [DOI] [Google Scholar]
- 20.Hu K. 1962. Visual pattern recognition by moment invariants. IEEE Trans. Inf. Theory. 8, 179–187 10.1109/TIT.1962.1057692 (doi:10.1109/TIT.1962.1057692) [DOI] [Google Scholar]
- 21.Sadjadi F. A., Hall E. L. 1980. Three-dimensional moment invariants. IEEE Trans. Pattern Anal. Mach. Intell. 2, 127–136 10.1109/TPAMI.1980.4766990 (doi:10.1109/TPAMI.1980.4766990) [DOI] [PubMed] [Google Scholar]
- 22.Flusser J., Boldyš J., Zitová B. 2003. Moment forms invariant to rotation and blur in arbitrary number of dimensions. IEEE Trans. Pattern Anal. Mach. Intell. 25, 234–246 10.1109/TPAMI.2003.1177154 (doi:10.1109/TPAMI.2003.1177154) [DOI] [Google Scholar]
- 23.Lo C.-H., Don S. 1989. 3-D moment forms: their construction and application to object identification and positioning. IEEE Trans. Pattern Anal. Mach. Intell. 11, 1053–1064 10.1109/34.42836 (doi:10.1109/34.42836) [DOI] [Google Scholar]
- 24.Xu D., Li H. 2006. 3-D affine moment invariants generated by geometric primitives. The 18th Int. Conf. on Pattern Recognition, Hong Kong, 20–24 August 2006, pp. 544–547 10.1109/ICPR.2006.21 (doi:10.1109/ICPR.2006.21) [DOI] [Google Scholar]
- 25.Xu D., Li H. 2008. Geometric moment invariants. Pattern Recogn. 41, 240–249 10.1016/j.patcog.2007.05.001 (doi:10.1016/j.patcog.2007.05.001) [DOI] [Google Scholar]
- 26.Trotter J. 1961. The crystal and molecular structure of biphenyl. Acta Crystallogr. 14, 1135. 10.1107/S0365110X6100334X (doi:10.1107/S0365110X6100334X) [DOI] [Google Scholar]
- 27.Doi M., Inoue M., Tomoo K., Ishida T., Ueda Y., Akagi M., Urata H. 1993. Structural characteristics of enantiomorphic DNA: crystal analysis of racemates of the d(CGCGCG) duplex. J. Am. Chem. Soc. 115, 10 432–10 433 10.1021/ja00075a098 (doi:10.1021/ja00075a098) [DOI] [Google Scholar]
- 28.Toniolo C., Peggion C., Crisma M., Formaggio F., Shui X., Eggleston D. S. 1994. Structure determination of racemic trichogin A IV using centrosymmetric crystals. Nat. Struct. Biol. 1, 908–914 10.1038/nsb1294-908 (doi:10.1038/nsb1294-908) [DOI] [PubMed] [Google Scholar]
- 29.Zawadzke L. E., Berg J. M. 1993. The structure of a centrosymmetric protein crystal. Protein Struct. Funct. Genet. 16, 301–305 10.1002/prot.340160308 (doi:10.1002/prot.340160308) [DOI] [PubMed] [Google Scholar]
- 30.Hung L.-W., Kohmura M., Ariyoshi Y., Kim H. 1999. Structural differences in d and l-monellin in the crystals of racemic mixture. J. Mol. Biol. 285, 311–321 10.1006/jmbi.1998.2308 (doi:10.1006/jmbi.1998.2308) [DOI] [PubMed] [Google Scholar]
- 31.Ramakrishnan C., Ramachandran G. N. 1965. Stereochemical criteria for polypeptide and protein chain conformations. II. Allowed conformations for a pair of peptide units. Biophys. J. 5, 909–933 10.1016/S0006-3495(65)86759-5 (doi:10.1016/S0006-3495(65)86759-5) [DOI] [PMC free article] [PubMed] [Google Scholar]
- 32.Rhee H., June Y.-G., Lee J.-S., Lee K.-K., Ha J.-H., Kim H. Z., Jeon S.-J., Cho M. 2009. Femtosecond characterization of vibrational optical activity of chiral molecules. Nature 458, 310–313 10.1038/nature07846 (doi:10.1038/nature07846) [DOI] [PubMed] [Google Scholar]
- 33.Sreerama N., Woody R. W. 2004. Computation and analysis of protein circular dichroism spectra. Meth. Enzymol. 383, 318–351 10.1016/S0076-6879(04)83013-1 (doi:10.1016/S0076-6879(04)83013-1) [DOI] [PubMed] [Google Scholar]
- 34.Shi S., Zhong Y., Majumdar I., Krishna S. S., Grishin N. V. 2007. Searching for three-dimensional secondary structural patterns in proteins with ProSMos. Bioinformatics 23, 1331–1338 10.1093/bioinformatics/btm121 (doi:10.1093/bioinformatics/btm121) [DOI] [PubMed] [Google Scholar]
- 35.Lovell S. C., Davis I. W., Arendall W. B., III, de Bakker P. I. W., Word J. M., Prisant M. G., Richardson J. S., Richardson D. C. 2003. Structure validation by Cα geometry: ϕ, ψ and Cβ deviation. Proteins: Struct. Funct. Genet. 50, 437–450 10.1002/prot.10286 (doi:10.1002/prot.10286) [DOI] [PubMed] [Google Scholar]


