

Abstract
OBJECTIVE
To use social network analysis to design more effective strategies for vaccinating healthcare workers against influenza.
DESIGN
An agent-based simulation.
SETTING
A simulation based on a 700-bed hospital.
METHODS
We first observed human contacts (defined as approach within approximately 0.9 m) performed by 15 categories of healthcare workers (eg, floor nurses, intensive care unit nurses, staff physicians, phlebotomists, and respiratory therapists). We then constructed a series of contact graphs to represent the social network of the hospital and used these graphs to run agent-based simulations to model the spread of influenza. A targeted vaccination strategy that preferentially vaccinated more “connected” healthcare workers was compared with other vaccination strategies during simulations with various base vaccination rates, vaccine effectiveness, probability of transmission, duration of infection, and patient length of stay.
RESULTS
We recorded 6,654 contacts by 148 workers during 606 hours of observations from January through December 2006. Unit clerks, X-ray technicians, residents and fellows, transporters, and physical and occupational therapists had the most contacts. When repeated contacts with the same individual were excluded, transporters, unit clerks, X-ray technicians, physical and occupational therapists, and social workers had the most contacts. Preferentially vaccinating healthcare workers in more connected job categories yielded a substantially lower attack rate and fewer infections than a random vaccination strategy for all simulation parameters.
CONCLUSIONS
Social network models can be used to derive more effective vaccination policies, which are crucial during vaccine shortages or in facilities with low vaccination rates. Local vaccination priorities can be determined in any healthcare facility with only a modest investment in collection of observational data on different types of healthcare workers. Our findings and methods (ie, social network analysis and computational simulation) have implications for the design of effective interventions to control a broad range of healthcare-associated infections.
Healthcare workers (HCWs) are at high risk of contracting influenza1 and, once infected, can spread it to patients under their care.2–4 Two features of influenza make it difficult to control in hospitals. First, not all infected people develop classic symptoms;1,5 thus, restricting symptomatic HCWs from patient care will not completely prevent transmission. Second, HCWs often work when they are ill and return to work before they are well.6,7
One of the most effective measures for preventing nosocomial spread of influenza is the vaccination of HCWs,8,9 and the Centers for Disease Control and Prevention recommends annual vaccination for all HCWs.5 Yet, in the United States, only 36% of workers with direct patient contact are immunized against influenza annually.10 Hospitals can increase rates of influenza vaccination among their employees if they are committed to this goal and if adequate financial resources are provided,3 but there are no data to help identify which HCWs should be the primary focus of efforts to improve influenza vaccination rates.
Because the number of influenza cases attributable to an infected HCW is related to the number of close contacts this person has with patients or other staff members, social network theory (a set of quantitative methods for measuring and understanding the complex, interdependent relationships between persons) can be used to study influenza vaccination strategies.11–16 Thus far, only preliminary social networking studies have been performed in a hospital environment,17,18 complementing a few studies based on compartmentalized epidemiological models.19,20 However, understanding these issues becomes particularly important when vaccine shortages occur, such as the 2004–2005 influenza vaccine shortage (attributed to manufacturing problems) or possible shortages of appropriate vaccine due to the introduction of unexpected strains (eg, 2009 influenza A [H1N1]).
In this article, we use data on person-to-person contacts collected in a hospital to develop a network model that describes the interactions of HCWs and patients. We then explore, using agent-based simulations based on this model, the effects of different disease parameters and vaccination strategies on the spread of influenza in a hospital. Finally, we introduce a targeted vaccination strategy that preferentially vaccinates those HCWs who are more influential in spreading influenza and use simulations to evaluate the effectiveness of the strategy in a hospital setting.
METHODS
The University of Iowa Hospitals and Clinics (UIHC) is an approximately 700-bed comprehensive academic medical center and regional referral center in Iowa City, Iowa. We sorted UIHC HCWs into 15 job categories with inpatient care responsibilities, excluding employees without direct and routine contact with patients (eg, telephone operators and accountants), resulting in a total of approximately 3,000 employees.
Data Collection
With approval from our institutional review board, data were collected by selecting a sample of workers from each of the 15 job categories and assigning an infection control research assistant to “shadow” the 148 selected employees, recording their every human contact for 606 hours of direct observation (approximately 40 hours per job category in 30-minute blocks; see Table 1). A total of 6,654 contacts were observed during January through December 2006 (during the 2006–2007 “influenza season”), where a contact is defined as 2 individuals coming within approximately 0.9 m of each other, a convenient approximation of the respiratory droplet range. For each contact, the research assistant recorded the type of agents involved, location, duration, whether physical contact was made, whether hand washing or sanitizing occurred, and whether the contact was a repeated contact (ie, the same individual within the 30-minute block).
TABLE 1.
Summary of Healthcare Worker Contacts According to Job Category
| Job category | N | Hours of Observation | Contacts |
||||
|---|---|---|---|---|---|---|---|
| Within category, no. (%) | Across categories, no. (%) | With patients, no. (%) | With others, no. (%) | Total, no. | |||
| Staff physicians | 11 | 41.5 | 22 (4.4) | 374 (75.1) | 88 (17.7) | 14 (2.8) | 498 |
| Residents and fellows | 8 | 40.0 | 168 (32.0) | 252 (48.0) | 91 (17.3) | 14 (2.7) | 525 |
| Floor nurses | 8 | 40.5 | 105 (19.8) | 204 (38.6) | 182 (34.4) | 38 (7.2) | 529 |
| Intensive care nurses | 8 | 41.0 | 169 (29.5) | 176 (30.8) | 185 (32.3) | 42 (7.3) | 572 |
| Nurse assistants | 12 | 40.0 | 30 (6.4) | 226 (48.4) | 198 (42.4) | 13 (2.8) | 467 |
| Physical and occupational therapists | 10 | 41.5 | 36 (8.5) | 242 (56.8) | 123 (28.9) | 25 (5.9) | 426 |
| Respiratory therapists | 11 | 40.0 | 129 (22.3) | 297 (51.4) | 98 (17.0) | 54 (9.3) | 578 |
| Phlebotomists | 12 | 40.0 | 19 (4.9) | 45 (11.6) | 323 (83.5) | 0 (0.0) | 387 |
| Social workers | 8 | 42.5 | 18 (3.9) | 367 (78.6) | 38 (8.1) | 44 (9.4) | 467 |
| Unit clerks | 10 | 40.5 | 18 (2.5) | 620 (86.5) | 25 (3.5) | 54 (7.5) | 717 |
| X-ray technicians | 15 | 40.0 | 146 (29.7) | 100 (20.4) | 153 (31.2) | 92 (18.7) | 491 |
| Pharmacists | 8 | 39.5 | 15 (4.9) | 216 (69.9) | 23 (7.4) | 55 (17.8) | 309 |
| Transporters | 7 | 39.5 | 32 (14.2) | 79 (35.0) | 111 (49.1) | 4 (1.8) | 226 |
| Food service personnel | 12 | 39.5 | 46 (13.4) | 161 (46.9) | 110 (32.1) | 26 (7.6) | 343 |
| Housekeepers | 8 | 40.0 | 28 (23.5) | 73 (61.3) | 14 (11.8) | 4 (3.4) | 119 |
| Total | 148 | 606.0 | 981 (14.7) | 3,432 (51.6) | 1,762 (26.5) | 479 (7.2) | 6,654 |
The data are aggregated to produce a 16 × 16 contact matrix C, where each entry cjk represents the average number of contacts observed per unit time period (here, 30 minutes) between a shadowed HCW of type j and another individual of type k for 15 job categories and 1 category comprising all patients. Note that alternative contact matrices can be constructed by considering only a subset of the observed contacts (eg, discarding all repeated contacts or only considering physical contacts). From a contact matrix and the number of people present of each type, we compute Pjk = Pkj, the probability that, given a person of type j and a person of type k, there will be a contact between them during a unit of time. Note that this does not mean that a person of type j (eg, a doctor) is as likely to contact a person of type k (eg, a nurse) as a person of type k is likely to contact a person of type j, because this also depends on the relative population sizes of the 2 agent types. Because there are many more nurses than doctors, a random contact by a doctor is much more likely to be a nurse than vice versa.
Generation of Contact Networks
To generate HCW/patient contact networks, we use hospital staffing and admission records to determine the total number of agents N = Σj nj with which to populate the simulation, where each nj corresponds to the count for agent type j. We then generate a contact network representative of the interactions of these simulated agents by randomly placing edges between each pair of agents with appropriate probability Pjk and with weight reflecting the expected number of contacts between 2 such agents during the course of a typical 8-hour work day. This method is a generalization of the well-known Erdős-Rènyi model for random graphs21,22 and assumes that HCWs of the same type have the same contact probabilities and that edges between different pairs of agents are placed independently. We confirmed empirically that contact networks generated in this fashion are consistent with the observed data.
Simulations
Our simulations use a susceptible/infected/recovered model operating on the contact network described above (see Table 2 for a summary of available simulation parameters). Initially, some number of agents are set to the infected state I, with unvaccinated agents assigned to state S, and vaccinated agents assigned to state R with probability ej, the vaccine effectiveness (the presence of a subscript on a simulation parameter indicates that this parameter can be set separately for each agent type; lack of subscript indicates that the values are set uniformly across all agent types). Infected agents recover (ie, move from state I to state R) w + t simulation time periods after infection, where w represents the incubation period after which symptoms emerge and t represents the duration of the illness.
TABLE 2.
Simulation Parameters
| Symbol | Description | Range |
|---|---|---|
| ej | Vaccine effectiveness (probability) | 0 ≤ ej ≤ 1 |
| w | Incubation period, days | 0 ≤ w |
| t | Duration of symptoms, days | 0 ≤ t |
| d | Average length of stay, days (0 is infinite) | 0 ≤ d |
| ij | Infectivity (probability) | 0 ≤ ij ≤ 1 |
| sj | Susceptibility (probability) | 0 ≤ sj ≤1 |
| p | Edge persistence | 0 ≤ p ≤ 1 |
| c | Shedding coefficient | 0 ≤ c |
All simulations reported here assume that patient beds in the hospital are always filled; patients may remain hospitalized for the duration of the simulation, or the simulation can be configured to discharge (and immediately replace) patients each day with probability 1/d, where d represents the average length of stay. The simulation terminates once no agents remain in state I.
For each unit time step (ie, 1 day) and each edge in the contact network that connects an agent of type j in state I with an agent of type k in state S, we change the state of the second agent from S to I with probability ij sk, where ij is the first agent’s infectivity and sk is the second agent’s susceptibility. This random draw is repeated edge-weight times, that is, a number of repetitions corresponding to the expected number of contacts between these agents per day. Because it has been well established that viral shedding varies during the course of an infection, we scale the product by a shedding coefficient c that ramps up exponentially to produce peak infectivity on day w and then decays exponentially through day w + t.23,24 Our simulations also support dynamic contact networks, in which edges change during the simulation in accordance with persistence parameter p: when p = 1, all edges are fixed; as p approaches 0, the contact network mutates more rapidly.
We next describe a series of simulations designed to explore the hypothesis that preferential vaccination policies targeting particular types of HCWs outperform random vaccination policies. We explore this hypothesis over a broad range of simulation parameters, including differing (1) base vaccination rates, (2) effectiveness of the vaccine, (3) transmissibility, (4) infection durations, (5) values for expected patient length of stay, and so on.
RESULTS
Simulation results are reported in terms of average attack rates, the percentages of the population in the simulation who are infected during the course of the simulation; or average case counts, the numbers of people infected during the course of the simulation. Note that these values are not conditioned on an outbreak occurring but are instead averaged over all trials; thus, average attack rate values will be substantially higher than shown in the event of an outbreak.
Baseline Simulations
Figure 1 shows the results for a series of baseline simulations, where the x-axis indicates the percentage of vaccinated HCWs and the y-axis represents the attack rate. Each data point corresponds to 5 replicates of each of 200 different (static) models (ie, contact networks with p = 1) generated using identical simulation parameters (multiple replications are performed, because the simulations are nondeterministic and vary in their initial conditions). A single individual is drawn at random from a population of N = 1,000 (with HCW types and patient proportions like those of UIHC) and is initially infected, HCWs continue to work without regard to infection status, and patients (who are all unvaccinated) are hospitalized for the duration of the simulation (ie, there is no patient turnover). The disease parameters used mimic generally accepted parameters for influenza—namely, w = 2 days and t = 7 days.
FIGURE 1.
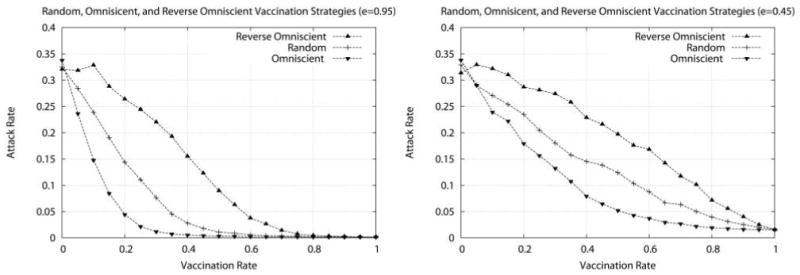
Attack rate as a function of vaccination rate for 3 different vaccination strategies using (left) a highly effective vaccine (e =0.95) and (right) a less effective vaccine (e =0.45). The 3 vaccination strategies are a random vaccination strategy, an omniscient vaccination strategy, and a reverse omniscient vaccination strategy. Each data point represents the average attack rate over 1,000 simulations (5 replicates for each of 200 randomly generated models); on average, about 375 infections are observed when no vaccinations are given.
We compare the performance of several vaccination strategies with differing vaccine effectiveness; results are shown here for highly effective vaccine (e = 0.95), as well as for less effective vaccine (e = 0.45). The 3 strategies are a random vaccination strategy (where the available vaccine doses are distributed to HCWs selected at random with uniform probability), an omniscient vaccination strategy, and a reverse omniscient vaccination strategy. For the omniscient strategies, we assume that the actual number and type of contacts that an individual will have during the course of the day can be fully known a priori (in practice, this assumption is quite unreasonable). The omniscient strategy greedily vaccinates HCWs with the largest number of contacts first, ensuring that each additional dose maximally “fragments” the contact network, thereby reducing the potential for the infection to spread. In contrast, the reverse omniscient strategy vaccinates HCWs in precisely the opposite order, ensuring that each additional dose has a minimal effect on the spread of infection. These 2 strategies serve to delimit the expected performance range, with the random vaccination strategy lying squarely in the middle. A good vaccination strategy would be one that performs better than the random strategy and nearly as well as or better than the omniscient strategy. Note that, for all strategies, the attack rate decreases steadily as a larger number of HCWs are vaccinated or as the effectiveness of the vaccine increases. Other vaccine effectiveness rates and strategies, although not shown here, behave as expected.
Targeted Vaccination
The omniscient vaccination strategies assume that we can have perfect advance knowledge of an individual HCW’s number and type of contacts. Although we cannot possibly know these quantities in practice, it is possible to estimate them on the basis of an agent’s job category and to use the estimates to construct a practical vaccination policy.
Figure 2 shows the results obtained with 2 variants of such a targeted vaccination strategy. First, we rank job categories from most to least densely connected on the basis of the observational data, using Σk nk Pjk as a measure of the connectivity of group j (see Table 3). Second, we administer vaccine to workers from each category in order until the target vaccination rate is attained. When the vaccination budget does not suffice to vaccinate all workers in the next job category, agents in that category are selected for vaccination at random until the vaccination budget is exhausted.
FIGURE 2.

Attack rate as a function of vaccination rate for all 3 vaccination strategies. Top left, Simulations with healthcare workers vaccinated (e =0.70) on the basis of the expected number of contacts with patients or other healthcare workers as defined by their job classification: workers belonging to densely connected job categories are preferentially selected to receive the vaccine. Top right, Similar set of simulations relying on an alternate contact model that excludes repeated contacts, in which the contact matrix C excludes all but the first contact observed between an agent of type j and an agent of type k within each observation session. Bottom, Results for analogous simulations performed on dynamic contact networks, with persistence p =0.98 (ie, edges are retained between unit time steps with probability 0.98). Each data point represents the average attack rate over 1,000 simulations (5 replicates for each of 200 randomly generated models).
TABLE 3.
Healthcare Worker Job Group Ordering According to Expected Connectivity
| Rank | Including repeated contacts | Disregarding repeated contacts |
|---|---|---|
| 1 | Unit clerks | Transporters |
| 2 | X-ray technicians | Unit clerks |
| 3 | Residents and fellows | X-ray technicians |
| 4 | Transporters | Physical and occupational therapists |
| 5 | Physical and occupational therapists | Social workers |
| 6 | Respiratory therapists | Respiratory therapists |
| 7 | Nurse assistants | Phlebotomists |
| 8 | Phlebotomists | Food service personnel |
| 9 | Intensive care nurses | Residents and fellows |
| 10 | Floor nurses | Nurse assistants |
| 11 | Social workers | Floor nurses |
| 12 | Food service personnel | Staff physicians |
| 13 | Pharmacists | Pharmacists |
| 14 | Staff physicians | Intensive care nurses |
| 15 | Housekeepers | Housekeepers |
The first simulation (Figure 2, top left) compares the performance of the targeted vaccination strategy with that of the random and omniscient vaccination strategies using the same simulation parameters as the baseline experiments and a moderately effective vaccine, e = 0.70 (again, other values of e behave as expected). The second simulation (Figure 2, top right) uses an alternate contact model that excludes repeated contacts but weights edges accordingly to account for qualitative differences between, for example, intensive care nurses (lots of patient contact, but typically with only 1 or 2 patients) and social workers (fewer contacts per person but with a larger set of people). The second and third simulations (Figure 2, bottom) show results obtained in simulations performed on dynamic contact networks, with persistence p = 0.98.
First, we note that, in all 4 simulation studies, the performance of the targeted vaccination strategy exceeds that of the random vaccination strategy and approaches that of the omniscient strategy while remaining practical and feasible from an implementation perspective. The relative performance ordering and shape of the attack rate curves are conserved in both contact models (ie, with and without repeated contacts) and for all vaccination effectiveness parameters, although the attack rates themselves may differ substantially. And although the rank order may change slightly depending on the contact model (because the corresponding cjk values will differ) and even from trial to trial (because each nj may itself vary slightly even as N, the total population, remains fixed), workers such as unit clerks and X-ray technicians are typically highly connected, whereas pharmacists and housekeepers are typically not as well connected. Note that ignoring repeated contacts in the input data increases the ranking of, for example, social workers, food service workers, transporters, and staff physicians (who tend to have diverse contacts with few repeats) and decreases the ranking of, for example, intensive care nurses and residents or fellows (who tend to have repeated contacts but with fewer people).
Although they are dependent on the model and simulation parameters used, our results are well behaved. Identical effects are observed over a broad range of parameters for all tested vaccination strategies, and, although the magnitude of these effects may change, the relative performance ordering of the strategies is conserved. For example, Figure 3 shows the results obtained for the targeted vaccination strategy (e = 0.70) when parameters governing the ease of agent-to-agent transmission (top left; 0.01 ≤ ij sk ≤ 0.04) and the duration of the subsequent infection (top right; 3 days ≤ t ≤ 11 days) are modified. As expected, increasing transmissibility and the duration of infections increases the attack rates. Figure 3 also explores the effect of dynamic populations, in which patients are discharged and replaced with average length-of-stay values in the range d = 3–7 days. In general, the shorter the length of stay, the more effective the vaccination policy, because discharging infected patients has an attenuating effect on disease spread within the institution (note that the number of agents in these simulations will grow concomitantly, artificially reducing the attack rate, yet the total number of cases remains stable, limited in part by the structure of interactions between HCWs and patients).
FIGURE 3.
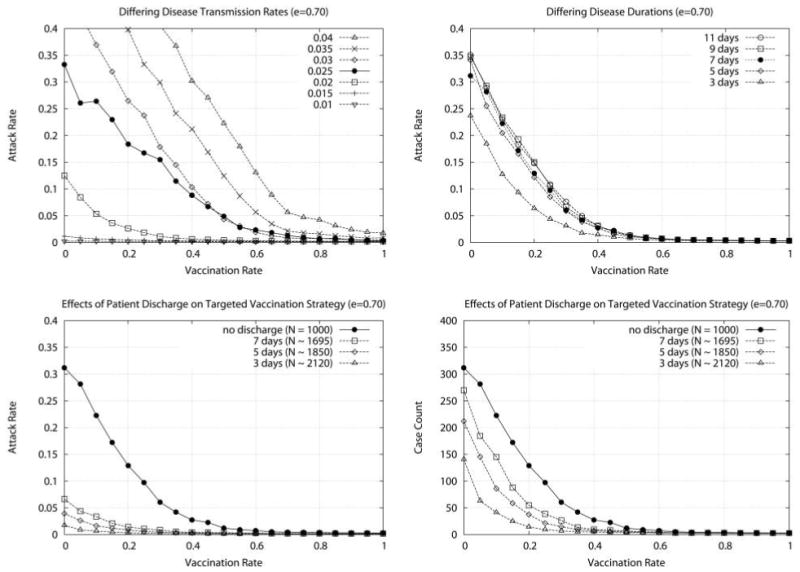
Attack rate as a function of vaccination rate as a function of other simulation parameters. Top left, Each curve represents a different probability of transmission from an infected agent to a susceptible agent 0.01 ≤ij sk ≤0.04, where the ij sk =0.025 curve also corresponds to the targeted vaccination curve in Figure 2, left. Top right, Each curve represents a different duration of infection (3 days ≤t ≤11 days, where t =7 days also corresponds to the targeted vaccination curve in Figure 2, left). Bottom, Attack rate (bottom left) and case counts (bottom right) as a function of vaccination rate for the targeted vaccination strategy and different values for patient expected length of stay (the “no discharge” curve corresponds to the targeted vaccination curve in Figure 2, left). Because patient discharge and replacement increases the size of the simulation population, attack rates will appear artificially low; case counts are given for ease of comparison with previous figures, where population sizes are fixed at N =1,000. Each data point represents the average attack rate over 1,000 simulations (5 replicates for each of 200 randomly generated models).
Finally, we address the question of how best to put our results into practice without collecting hundreds of hours of contact data. Figure 4 shows the results obtained when randomly selected subsets of observations are used to order job types for targeted vaccination. A number of different-sized observation sets are used, ranging from 1 hour per job type (a total of only 15 hours of observation) to the complete 606-hour observation set. The results show that even small observational data sets suffice to capture much of the requisite job-type ordering information underlying the targeted vaccination strategy; thus, small investments in data collection can yield large gains in vaccine performance.
FIGURE 4.

Results obtained using varying-sized subsets of the original observation data for all 3 vaccination strategies with moderately effective vaccine (e =0.70). Each data point represents the average attack rate over 1,000 simulations (5 replicates for each of 20 randomly generated models based on 10 randomly selected subsets of the observation data).
DISCUSSION
Nosocomial influenza can have devastating outcomes for patients, and outbreaks in healthcare settings can cause serious staff shortages.1,25–29 But despite years of recommendations, vaccination rates among HCWs remain low. At UIHC, prior to this study, we noticed that vaccination rates for different groups of HCWs varied greatly, and the groups of HCWs with higher vaccination rates were not necessarily those with close contact with patients: in fact, the rate of influenza vaccination among maintenance and engineering staff was higher than that among internal medicine residents.30 Conversely, the vaccination rate of transporters (employees who take patients from one area of the hospital to another) was only 10%, yet transporters had not previously been considered as a target of vaccination compliance campaigns. Some hospitals have recently resorted to employer-mandated vaccination programs, but such efforts are often met with resistance from HCWs, including lawsuits.
The message of this article is that social network analysis can be used to induce a priority vaccination ordering of HCWs and that the resulting targeted vaccination strategy outperforms (ie, results in fewer infections than) the traditional random vaccination policy. We view any healthcare facility as a social network and postulate that people within a hospital do not interact randomly but instead are likely to interact with some groups of HCWs more than others. Using simulations, we show that certain types of workers were more likely to affect the spread of infection than others and thus, all else being equal, should be considered a vaccination priority. Furthermore, we show how even just a few hours of data collection can provide sufficient information to attain much of this observed performance advantage. Finally, we show that our results are stable across a broad range of disease and other simulation parameters, including, for example, the use of dynamic contact networks. We are currently working to integrate data from additional sources (eg, contacts inferred from electronic medical record logs, as well as small, wearable, radio-frequency devices) into our simulation framework, which will allow our simulations to incorporate spatial constraints, such as those imposed by hospital architecture, as well as reducing any effects of observational bias.
There are several limitations to our study. First, as noted, observational data may be biased, because the observation of HCWs may affect their behavior. However, because our simulations rely on relative (and not exact) numbers of contacts observed, if we assume that any bias introduced will tend in the same direction and be of roughly the same magnitude across groups, we do not believe that it will alter the relative performance rankings of the vaccination strategies studied here. Second, we did not observe all groups of HCWs, nor was it possible to observe all workers from every group; furthermore, our institutional review board required consent from all shadowed HCWs, as well as approval from group supervisors, which led to less-than-random selection. Finally, this study was performed at only 1 institution; however, the job descriptions that we chose are similar to those of other acute care facilities, and, as is evident from Figure 4, even modest observational efforts will permit other institutions to account for local context. Despite these limitations, we believe that the insights gained from our results can be used to aid the design of more effective influenza vaccination campaigns that target the HCWs most likely to transmit influenza virus. Moreover, these same insights can be used to help effectively allocate vaccine when it is in limited supply. In 2004, US hospitals struggled to ration influenza vaccine, and recommendations were made to prioritize workers with direct patient care responsibilities.31 Yet, as we have shown, even among HCWs who work directly with patients, some have a much greater effect on the spread of disease.
Simulations are used in fields where experiments are not possible; healthcare epidemiology is such a discipline. In this article, we address ways to optimize vaccination strategies using observational data, social network analysis, and computational modeling. Our findings also have broader implications in the application of other infection control interventions—for example, hand hygiene, isolation, and contact precautions.
Acknowledgments
We thank Jennifer Kuntz and Shobha Kazinka for their contributions to data collection and data management, along with the hospital epidemiologists (Loreen Herwaldt and Daniel Diekema) and infection control professionals at UIHC.
Financial support. The University of Iowa College of Medicine Translational Research Pilot Grant (P.M.P., T.L.T., S.V.P., and A.M.S.), National Institutes of Health Young Investigator Award (P.P.), and National Institutes of Health grant NIAID-R21-AI081164 (A.M.S., S.P., and P.P.).
Footnotes
Potential conflicts of interest. All authors report no conflicts of interest relevant to this article.
References
- 1.Elder AG, O’Donnell B, McCruden EA, Symington IS, Carman WF. Incidence and recall of influenza in a cohort of Glasgow healthcare workers during the 1993–4 epidemic: results of serum testing and questionnaire. BMJ. 1996;313:1241–1242. doi: 10.1136/bmj.313.7067.1241. [DOI] [PMC free article] [PubMed] [Google Scholar]
- 2.Horcajada JP, Pumarola T, Martinez JA. A nosocomial outbreak of influenza during a period without influenza epidemic activity. Eur Respir J. 2003;21:303–307. doi: 10.1183/09031936.03.00040503. [DOI] [PubMed] [Google Scholar]
- 3.Salgado CD, Giannetta ET, Hayden FG, Farr BM. Preventing nosocomial influenza by improving the vaccine acceptance rate of clinicians. Infect Control Hosp Epidemiol. 2004;25:923–928. doi: 10.1086/502321. [DOI] [PubMed] [Google Scholar]
- 4.Harrison J, Abbott P. Vaccination against influenza: UK health care workers not on-message. Occup Med (Lond) 2002;52:277–279. doi: 10.1093/occmed/52.5.277. [DOI] [PubMed] [Google Scholar]
- 5.Centers for Disease Control and Prevention. Epidemiology and Prevention of Vaccine-Preventable Diseases. Washington, DC: Public Health Foundation; 2006. [Google Scholar]
- 6.Weingarten S, Riedinger M, Bolton LB, Miles P, Ault M. Barriers to influenza vaccine acceptance: a survey of physicians and nurses. Am J Infect Control. 1989;17:202–207. doi: 10.1016/0196-6553(89)90129-6. [DOI] [PubMed] [Google Scholar]
- 7.Lester RT, McGeer A, Tomlinson G, Detsky AS. Use of, effectiveness of, and attitudes regarding influenza vaccine among house staff. Infect Control Hosp Epidemiol. 2003;24:839–844. doi: 10.1086/502146. [DOI] [PubMed] [Google Scholar]
- 8.Dash GP, Fauerbach L, Pfeiffer J, et al. Improving health care worker influenza immunization rates. Am J Infect Control. 2004;32:123–125. doi: 10.1016/j.ajic.2004.03.001. [DOI] [PubMed] [Google Scholar]
- 9.Call to action: influenza immunization among health care personnel. National Foundation for Infectious Diseases Web site. [Accessed July 6, 2010]; http://www.nfid.org/publications/fluhealthcarecta08.pdf. Published 2008.
- 10.Smith NM, Bresee JS Centers for Disease Control and Prevention. Prevention and control of influenza: recommendations of the advisory committee on immunization practices. MMWR Morb Mortal Wkly Rep. 2006;55:1–42. [PubMed] [Google Scholar]
- 11.Meyers LA. Contact network epidemiology: bond percolation applied to infectious disease prediction and control. Bull New Ser Am Math Soc. 2007;44:63–86. [Google Scholar]
- 12.Newman MEJ. The spread of epidemic disease on networks. Phys Rev E Stat Nonlin Soft Matter Phys. 2002;66:016128. doi: 10.1103/PhysRevE.66.016128. [DOI] [PubMed] [Google Scholar]
- 13.Christley RM, Pinchbeck GL, Bowers RG, et al. Infection in social networks: using network analysis to identify high risk individuals. Am J Epidemiol. 2005;162:1–8. doi: 10.1093/aje/kwi308. [DOI] [PubMed] [Google Scholar]
- 14.Keeling MJ. The implications of network structure for epidemic dynamics. Theor Popul Biol. 2005;67:1–8. doi: 10.1016/j.tpb.2004.08.002. [DOI] [PubMed] [Google Scholar]
- 15.Keeling MJ, Eames ETD. Networks and epidemic models. J R Soc Interface. 2005;2:295–307. doi: 10.1098/rsif.2005.0051. [DOI] [PMC free article] [PubMed] [Google Scholar]
- 16.Read JM, Keeling MJ. Disease evolution on networks: the role of contact structure. Proc R Soc Lond B Biol Sci. 2003;270:699–708. doi: 10.1098/rspb.2002.2305. [DOI] [PMC free article] [PubMed] [Google Scholar]
- 17.Meyers L, Newman M, Martin M, Schrag S. Applying network theory to epidemics: control measures for Mycoplasma pneumoniae outbreaks. Emerg Infect Dis. 2003;9:204–210. doi: 10.3201/eid0902.020188. [DOI] [PMC free article] [PubMed] [Google Scholar]
- 18.Ueno T, Masuda N. Controlling nosocomial infection based on the structure of hospital social networks. J Theor Biol. 2008;254:655–666. doi: 10.1016/j.jtbi.2008.07.001. [DOI] [PMC free article] [PubMed] [Google Scholar]
- 19.Van Den Dool C, Bonten MJM, Haka E, Walling J. Modeling the effects of influenza vaccination of health care workers in hospital departments. Vaccine. 2009;27:6261–6267. doi: 10.1016/j.vaccine.2009.07.104. [DOI] [PubMed] [Google Scholar]
- 20.Nuño M, Reichert TA, Chowell G, Gumel AB. Protecting residential care facilities from pandemic influenza. Proc Natl Acad Sci U S A. 2008;105:10625–10630. doi: 10.1073/pnas.0712014105. [DOI] [PMC free article] [PubMed] [Google Scholar]
- 21.Erdős P, Rènyi A. On random graphs I. Publ Math. 1959;6:290–297. [Google Scholar]
- 22.Erdős P, Rènyi A. On the evolution of random graphs. Publ Math Inst Hung Acad Sci. 1960;5:17–61. [Google Scholar]
- 23.Carrat F, Vergu E, Ferguson NM, et al. Time lines of infection and disease in human influenza: a review of volunteer challenge studies. Am J Epidemiol. 2008;167:775–785. doi: 10.1093/aje/kwm375. [DOI] [PubMed] [Google Scholar]
- 24.Bridges CB, Kuenhnert MJ, Hall CB. Transmission of influenza: implications for control in health care settings. Clin Infect Dis. 2003;37:1094–1101. doi: 10.1086/378292. [DOI] [PubMed] [Google Scholar]
- 25.Ferguson NM, Mallett S, Jackson H, Roberts N, Ward P. A population-dynamic model for evaluating the potential spread of drug-reistant influenza virus infections during community-based use of antivirals. J Antimicrob Chemother. 2003;51:977–990. doi: 10.1093/jac/dkg136. [DOI] [PubMed] [Google Scholar]
- 26.Everts R, Hanger H, Jennings L, Hawkins A, Sainsbury R. Outbreaks of influenza A among elderly hospital inpatients. N Z Med J. 1996;109:272–274. [PubMed] [Google Scholar]
- 27.Evans M, Hall K, Berry S. Influenza control in acute care hospitals. Am J Infect Control. 1997;25:357–362. doi: 10.1016/s0196-6553(97)90029-8. [DOI] [PubMed] [Google Scholar]
- 28.Serwint J, Miller R. Why diagnose influenza infections in hospitalized pediatric patients? Pediatr Infect Dis J. 1993;12:200–204. doi: 10.1097/00006454-199303000-00005. [DOI] [PubMed] [Google Scholar]
- 29.Saxen H, Virtanen M. Randomized, placebo-controlled double blind study on the efficacy of influenza immunization on absenteeism of health care workers. Pediatr Infect Dis J. 1999;18:779–783. doi: 10.1097/00006454-199909000-00007. [DOI] [PubMed] [Google Scholar]
- 30.Polgreen PM, Pottinger J, Polgreen LA, Diekema DF, Herwaldt LA. Influenza vaccination rates, feedback, and the Hawthorne effect. Infect Control Hosp Epidemiol. 2006;27:98–99. doi: 10.1086/499393. [DOI] [PubMed] [Google Scholar]
- 31.Talbot TR, Bradley SF, Cosgrove SE, Ruef C, Siegel JD, Weber DJ. Influenza vaccination of healthcare workers and vaccine allocation for healthcare workers during vaccine shortages. Infect Control Hosp Epidemiol. 2005;26:882–890. doi: 10.1086/502512. [DOI] [PubMed] [Google Scholar]