Abstract
One fundamental difference between plants and animals is the existence of a germ-line in animals and its absence in plants. In flowering plants the sexual organs (stamens and carpels) are composed almost entirely of somatic cells, a small subset of which switch to meiosis, however, the mechanism of meiotic cell fate acquisition is a long-standing botanical mystery. In the maize (Zea mays) anther microsporangium the somatic tissues consist of four concentric cell layers which surround and support reproductive cells as they progress through meiosis and pollen maturation. Male sterility, defined as the absence of viable pollen, is a common phenotype in flowering plants, and many male sterile mutants have defects in somatic and reproductive cell fate acquisition. However, without a robust model of anther cell fate acquisition based on careful observation of wild type anther ontogeny, interpretation of cell fate mutants is limited. To address this, the pattern of cell proliferation, expansion, and differentiation was tracked in three dimensions over thirty days of wild type (W23) anther development, using anthers stained with propidium iodide (PI) and/or 5-ethynyl-2′-deoxyuridine (EdU) (S-phase label) and imaged by confocal microscopy. The pervading lineage model of anther development claims that new cell layers are generated by coordinated, oriented cell divisions in transient precursor cell types. In reconstructing anther cell division patterns, however, we can only confirm this for the origin of the middle layer (ml) and tapetum, while young anther development appears more complex. We find that each anther cell type undergoes a burst of cell division after specification with a characteristic pattern of both cell expansion and division. Comparisons between two inbreds lines and between ab- and adaxial anther florets indicated near identity: anther development is highly canalized and synchronized. Three classical models of plant organ development are tested and ruled out; however, local clustering of developmental events was identified for several processes, including the first evidence for a direct relationship between the development of ml and tapetal cells. We speculate that small groups of ml and tapetum cells function as a developmental unit dedicated to the development of a single pollen grain.
Introduction
Germ cells arise early in animal embryos, but in plants they are the final type of cells to differentiate within reproductive structures (Walbot, 1985; Walbot and Evans, 2003). During animal embryogenesis germ-line cells are specified through inheritance of maternal factors, cell-cell interaction and/or cell movement, but are always a recognizable embryonic feature (Ewen-Campen et al., 2009; Saffman and Lasko, 1999). In contrast to animals, plant morphogenesis depends on continuous growth of totipotent meristems, undifferentiated tissue from which new organs are formed. Plants proceed through juvenile and adult life phases, making leaves, stems, branches, roots and other structures without demarcating reproductive cells. Flowers terminate shoot apical meristems by causing differentiation of the entire stem cell population into floral organs, nearly all of which are somatic tissues such as sepals, petals, stamens, and carpels. Ultimately, small populations of meiotic-competent cells are specified within developing stamens and carpels, well after the rudimentary organs are defined (Bhatt et al., 2001). In anthers, after multiple mitotic cell cycles, all of these reproductive cells switch to meiosis and proceed through the meiotic stages synchronously (Boavida et al., 2005). Indeed, a plant-specific somatic to meiotic switch has been postulated (Chaubal et al., 2003) to explain the late specification of meiotic competence. The somatic tissues provide developmental cues (Wilson, 2009), structural and biochemical support for the meiocytes, and nutrition and coatings to the subsequent haploid microspores, which mature as pollen grains (Canales et al., 2002).
In maize (Zea mays), anthers reside in a large inflorescence, the apically-positioned tassel, consisting of hundreds of paired spikelets, each containing six stamens separated into two florets (Figure 1A). Unusual among angiosperms, the carpel aborts in each floret, making the tassel male only (Boavida et al., 2005; Cheng, 1983). Stamens consist of pollen-producing anthers subtended by filaments, which supply nutrients and water to the growing anther. The anther is composed of four microsporangia (from now on called locules) flanking connective tissue and vascular elements, which are continuous with the filament (Figure 1B). In transverse-section the mature anther locule resembles a dartboard, with an outer layer of epidermis enclosing three somatic layers, each one cell thick, which in turn surround the centrally located, globose reproductive cells (Figure 1B,C,D) (Albrecht et al., 2005). Reproductive cells originate from pluripotent precursors and share common ancestory with somatic neighbors (Dawe and Freeling, 1990; Dawe and Freeling, 1992). They are known as archesporial (ar) cells during a short period of mitotic proliferation. They then re-differentiate as pollen mother cells (pmc) competent for meiosis. The pmc are positioned in the central column of each locule (Figure 1D) completely enclosed by the tapetum (t), which in turn is surrounded by the ml, which nests inside the endothecium (en). Finally, encircling the endothecium is the epidermis (epi), which is exposed to a small pocket of air inside developing florets (Figure 1C). Modern work on Arabidopsis anther development usually starts after all of these tissues have been established; even in maize where the anthers are large most studies have started at the 1 mm stage, after all of this patterning has taken place. We sought to better understand the origin and development of these reproductive and somatic tissues starting with the initiation of anther primordia.
Figure 1. Maize anther anatomy and the proposed origin of the cell types.

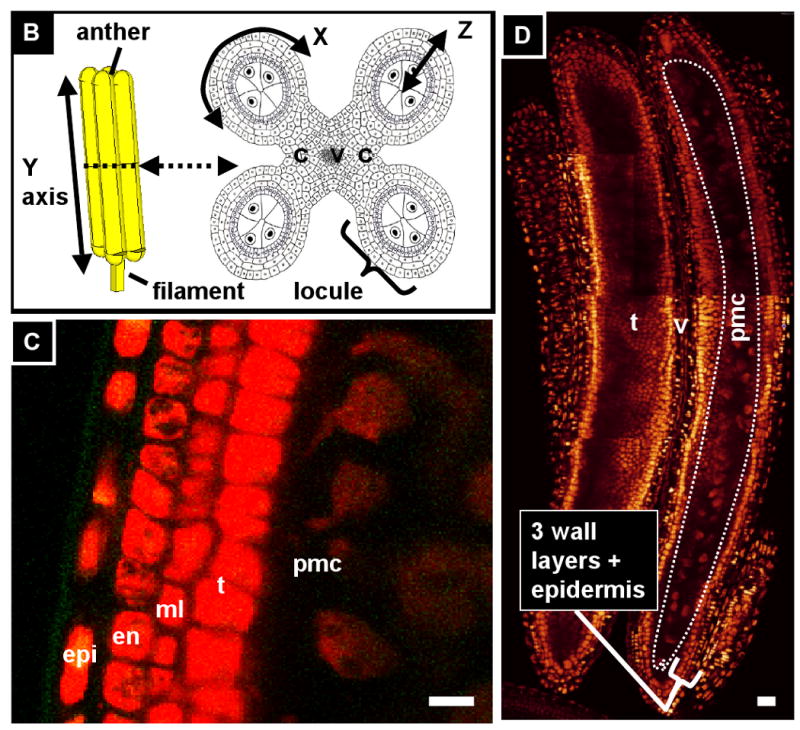
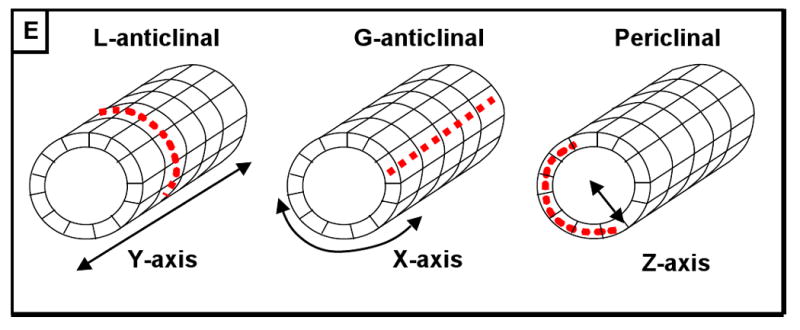
(A) Maize is a monoecious plant. The male inflorescence, the tassel, is positioned apically and consists of a central spike with several lateral branches which together support hundreds of paired spikelets containing two florets of three stamens each. (B) Left: A stamen consists of an anther supported by a filament. Right: In cross-section, the anther is composed of four locules surrounding central connective and vascular tissue, which are continuous with the filament. In each locule, four somatic cell types surround the central, reproductive cells that will undergo meiosis and become pollen. The X, Y, and Z in this figure represent the circumference axis, the apical-basal axis, and the radial axis, respectively (see first section of results) (modified from Ma, et al. 2008). (C) Longitudinal optical section of propidium iodide-stained anther 1000 μm long just after all five locular cell types are present (D) Composite longitudinal optical section of an 1100-μm anther stained with PI showing 2 locules just before meiosis. The column of pre-meiotic pollen mother cells (pmc) is circled in the right locule; the left locule shows a different optical plane so the pmc are out of focus, but the tapetum is visible. (E) In contrast to germ cells, which divide in non-stereotypical orientations, somatic cells belonging to the anther wall are restricted to one of three division orientations. In these diagrams the orientation of new cell walls after cytokinesis are indicated with red dashed lines. Left: L-anticlinal divisions add more cells to the Y-axis of the anther, and thus add to the length of the anther. Center: G-anticlinal divisions add cells to the X-axis, increasing girth. L- and G-anticlinal divisions are clonal because they add cells to an existing layer but do not create new cell types. Right: Periclinal divisions give rise to new cell layers. epi, epidermis; en, endothecium; ml, middle layer; t, tapetum; pmc, pollen mother cell; v, vasculature; ppl, primary parietal layer; spl, secondary parietal layer. (all scale bars = 15 μm).
Most anther developmental studies have employed transverse sections that transect all five locular cell types, ignoring the proximal-distal axis that runs from anther base to tip, which is assumed to be uniform except at the tapered tips. We have chosen to examine anthers using confocal microscopy to acquire whole-anther scans in three dimensions. Here we refer to the proximal-distal axis as the “Y-axis”, the path around the circumference of the anther as the “X-axis”, and the radial axis that transects the five locular cell layers as the “Z-axis” (Figure 1B). For any given cell in an anther locule, neighbors adjacent on the Y- or X-axes are the same cell type, while neighbors adjacent on the Z-axis are different cell types, suggesting that anther cells may be able to determine their position and orientation based on who their neighbors are. Cell divisions that add cells to an existing cell layer may be L- or G- anticlinal (for length and girth) depending on whether the new cell wall is parallel to the X- or Y- axis, respectively (see Figure 1E). In contrast to these clonal anticlinal divisions, new cell layers are generated by “periclinal” divisions, where the metaphase plate is aligned parallel to the Y-axis and the girth of the anther is increased along the Z-axis (Figure 1E). Periclinal divisions are also associated with the differentiation of new cell types in roots, another tissue with a dartboard-like cross-section (Benfey and Schiefelbein, 1994; Kessler et al., 2002).
Anthers are a superb model for the study of pattern formation because they contain a small number of unique tissues arranged in a regular pattern, they are readily dissected and staged by length, and the locules are accessible to direct observation (Bedinger, 2009; Feng and Dickinson, 2007; Scott et al., 2004; Zhao, 2009). The anther primordium contains cells derived from each inflorescence meristem layer -- L1, L2, and L3 -- but must form a much more complex organ than either roots or leaves. In the angiosperms analyzed, meiotic cells in stamens and carpels share a lineage with surrounding somatic tissues (Dawe and Freeling, 1990). Clonal analysis established that the epidermis arises from the L1-derived (L1-d) layer of the anther primordia, while small pools of multi-potent, sub-epidermal L2-derived (L2-d) cells generate the three somatic rings and the central pmc of maize anthers (Dawe and Freeling, 1990; Dawe and Freeling, 1992). As the somatic and reproductive tissues share the same lineage, pinning down exactly when and how the alternation of generations initiates is of great interest.
A strictly lineage hypothesis is the most popular model of anther development in rice, maize, and Arabidopsis; the concept is that the identity of individual cell layers depends on predictable, genetically controlled periclinal divisions that set up the bull's eye locule architecture. The model includes an emphasis on history and lineage, although positional information and cell-cell communication are also sometimes invoked (Feng and Dickinson, 2010; Kiesselbach, 1949; Sorensen et al., 2002). In the first step of this bifurcating model, a single initial L2-d hypodermal cell positioned just under the epidermis in each of the four corners of the anther primordium divide periclinally to give rise to an single ar cell and a primary parietal cell (ppc). The later is positioned adjacent the epidermis while the archesporial cell is internal. Next, the primary parietal cell divides clonally for a short period (using both L- and G-anticlinal divisions) to become a complete layer surrounding the ar cell. Each cell in this layer then makes a periclinal division to yield the endothecium and secondary parietal layer (spl), which later generates the ml and tapetum through a third periclinal division. The images of transverse sections do not match the clear cell layer distinctions implied in the cartoon lineage models, particularly during early anther development (Sheridan et al., 1999). That the spl makes a periclinal division to give rise to the ml and tapetum is well established by transverse section (Sheridan et al., 1999). But the early steps of anther cell fate specification have been inferred, without conclusive evidence, to work the same way. Although clear images of a monolayer of single subepidermal, possible primary parietal layer have been published for rice (Nonomura et al., 2003), even the best images from most publications do not provide clear evidence that the order and orientation of cell divisions invoked during early steps of this model are accurate.
Cell type specification is one of many developmental mysteries in anthers. With the exception of the tapetum, the functions of other internal cell layers are poorly understood. The tapetum is a transfer cell type that supplies nutrients to pmc and later synthesizes and secretes molecular constituents of the pollen wall into the locule after meiosis. Tapetum cells are binucleate after meiosis, perhaps to support the increased transcriptional load required for the synthesis of pollen wall constituents (Yang et al., 2003). In contrast to the tapetum, no role has been posited for the ml or spl (Cheng, 1979; Davis, 1966). The endothecium is notable for the presence of starch granules and cell wall secondary thickenings; the latter may account for anther strength and be responsible for initiating pollen release during anthesis (Bedinger, 2009).
Most publications on anthers have employed light or electron microscopic transverse sections to count the number of rings of cell types within a narrow section of a locule; analysis can be biased if anther cells are arranged in a helix or if sections are not precisely perpendicular to the long axis (Bedinger, 2009). Furthermore, almost all analyses have focused on the spl division, rather than starting with an anther primordium composed of the initial meristem derivatives and continuing through establishment of final anther size. A comprehensive examination of the ontogeny of the epidermis is possible with SEM, but this approach would not resolve issues in the interior. As a result, very little is understood about how overall anther form and size are achieved via cell proliferation, expansion, and differentiation in the L2-d tissues and how cell type emergence in rings occurs along the length of the anther over time. In this study, we investigated anther ontogeny in real time with temporal and spatial resolution. Wild type anthers were imaged in three dimensions using confocal microscopy to define the number, shape, size, and mitotic rate of the progenitor types and final cell types at 14 developmental stages. We first present a timeline with the origin and mitotic patterns of wild type tissues, then present on the ontogeny of each tissue over the 30 days from primordia to pollen shed. These data were used to investigate two questions: First, do cells in newly generated additional layers have distinctive and stereotyped patterns of division and expansion that distinguish them from progenitor and/or sister layers? Second, what coordinates anther growth – a meristem, a growth wave, or some other mechanism?
Materials and Methods
Plant Growth
W23 bz2 (deficient in anthocyanin accumulation in the vacuole) and B73 inbred lines maintained by the Walbot lab were grown in Stanford, CA, using weekly plantings, under field irrigation and fertilization to maintain robust growth. Greenhouse conditions achieve 40% of a balanced summer noon solar fluence in the absence of UV with 14 h day/10 h night lighting (Casati, 2004). No herbicide or insecticide treatments were used.
Dissection and Staining
Anthers were dissected from tassels between leaf stages V7:T12 to V13:T16 for W23 and V8:T13 to V11:T16 for B73 (Tranel, 2008). During this period tassels are still embedded in the leaf whorl; whole plants were sacrificed in most cases, and all anthers were incubated in fixative within half an hour of initial wounding, or else discarded. Spikelets were removed from the central tassel spike or side branches; upper and lower florets were staged by approximate length; pooled samples of each stage were kept at RT for up to one month in fixative. For propidium iodide staining (PI, Molecular Probes, Eugene, OR) (Feijo and Cox, 2001; Feijo and Moreno, 2004; Mamun et al., 2005), anthers were dissected into 100% ethanol, washed twice in PBS (pH 7.4) + 2% BSA, then transferred to one of two permeabilization solutions: 10% KOH (w/v in water) at 85 °C for 2 min or 1% Triton X-100 at room temperature for 20 min with rocking. After permeabilization, anthers were washed twice in PBS + 2% BSA then incubated in PI staining solution (20 μg/mL PI, 0.02% (v/v) Tween-20 in PBS (pH 7.4)). To saturate anthers with staining solution, anthers were vacuum-infiltrated (2′, 500 mBars ×3) during 30′ of incubation. Anthers were then washed twice in PBS (pH 7.4) + 2% BSA, transferred to PBS (pH 7.4), and kept at 4 °C in the dark for up to one month before imaging. KOH pretreatment permits both a cytoplasmic and nuclear PI stain and preserves pre-meiotic anther morphology, but it damages older anthers (>1500 μm). Triton treatment results in a nuclear stain and is compatible with EdU (5-ethynyl-2′-deoxyuridine) co-staining.
EdU Analysis of DNA Synthesis
Immature tassels were injected with 1 mL of 20 μg/mL EdU (Molecular Probes) in water with an 18-gauge hypodermic needle through the whorl of leaves surrounding the inflorescence apex approximately 30 days post germination (dpg). EdU seeps into spikelets through small air spaces between the external organs of the spikelet and florets and reaches anthers within five minutes after injection. Depending on the experiment, anthers were fixed in ethanol between five min and 50 h later. The anthers were processed in the same manner as for PI staining, except that they were vacuum infiltrated in the Click-It reaction solution with 20 μg/mL PI added to the solution (Kotogany et al., 2010; Salic and Mitchison, 2008). As a negative control, 10 mM hydroxyurea was co-injected with EdU to block DNA synthesis, preventing the labeling of nuclei in 0.5 – 1.0 mm anthers (data not shown).
Microscopy
Confocal images were taken with a Leica SP5 with excitation/emission spectra of 561/590-640 nm for PI and 488/505-520 nm for EdU. Images were processed in Volocity (Perkin Elmer, Waltham, Massachusetts). The line tool on the microscope software permitted an accurate measurement of anther length within 5% reproducibility.
Results
Overview of anther cell division patterns that establish the tissues
Correlating anther length with time
Arabidopsis and rice anthers are very small during the stages of cell fate acquisition; in contrast, maize anthers are macroscopic and hundreds can be readily dissected from a developing tassel. Anther development spans more than one month from primordium formation within developing spikelets on a tassel inflorescence to pollen shed, corresponding to anther lengths of 100 and 4000 μm (or more depending on genotype), respectively. Anther length is a reliable proxy for developmental stage, however, little is known about the duration of successive developmental stages. In general, neighboring spikelets exhibit highly synchronous upper floret anther development, with the lower florets about 1 day delayed (Cacharron, et al., 1999; Irish, 1999; Kiesselbach, 1949). To correlate length and time, immature anther spikelets were dissected from marked positions on wild type tassels, the dissection wounds were sealed, and neighboring spikelets were dissected from the same positions 24 h later. The data show that anthers double in length from 125 μm to 250 μm in 24 h in the passage from day 1 to 2, and double again to 500 μm by day 3, and then the elongation rate gradually diminishes over the subsequent 7 days to achieve 1500 μm (Figure 2A). Subsequent elongation is gradual until final length is reached more than 3 weeks later. The time line is reliable but varying field conditions influenced anther length by as much as 10%.
Figure 2. Timeline of anther development + representative confocal images.
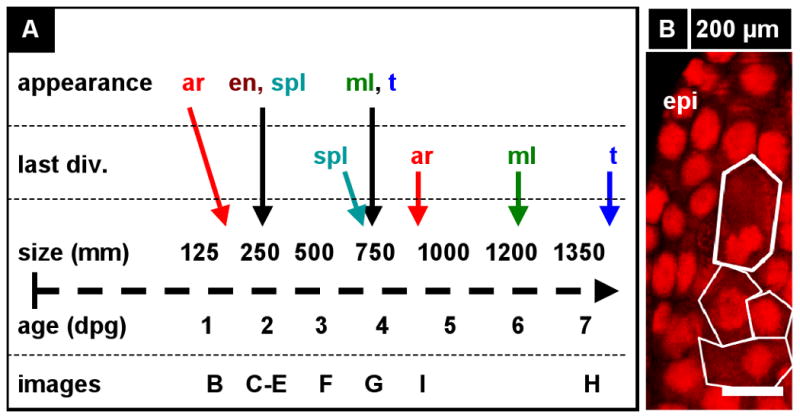
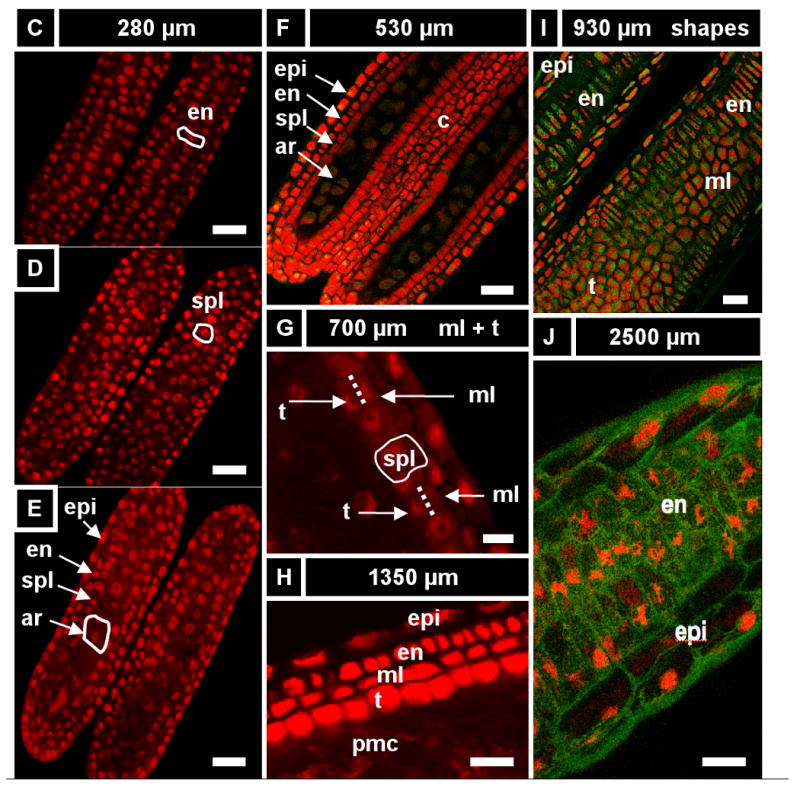
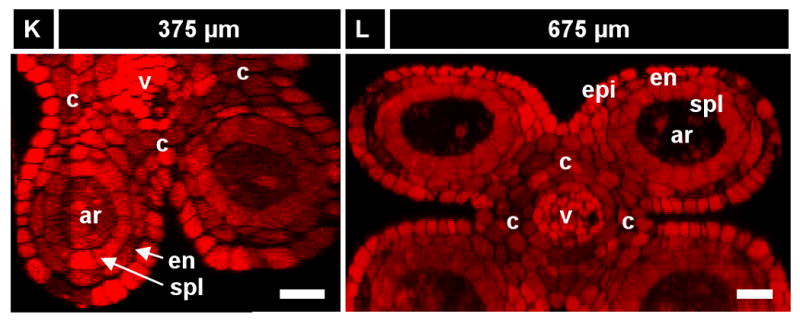
A) Anther development timeline based on our work including key developmental events, anther length and number of days after the primordial stage (dpg). The archesporial cells (ar) differentiate by size and morphology just before the spl and endothecium (en) are resolve into two distinct layers. These three layers amplify clonally for 2.5 days (anther sizes 250 - 750 μm) before the spl makes periclinal divisions to give the middle layer (Schnable et al.) and tapetum (t), which differentiate quickly thereafter. Archesporial cell mitoses stop at day five as they mature into pollen mother cells. Middle layer divisions stop a day later, followed by the epidermis and tapetum two days after that. The endothecium continues dividing for another 12-15 days, albeit slowly. Letters above the timeline correspond to images that follow. (B-J) Longitudinal optical sections using PI stain (536 nm / 605-640 nm, red) and UV auto-fluorescence (405 nm / 430-550 nm, green). The stage of each image can be determined by finding the corresponding letter on the timeline. Some cell types in the images are not labeled. (B) A 200 μm anther locule containing four archesporial cells (circled). These four cells are surrounded by dozens of somatic cells in and out of the visible plane. (C-E) One day after primordial formation, a 280 μm anther with four cell layers: epidermis, endothecium, secondary parietal layer, and archesporial cells. These cells can be identified by their morphology and position, as each cell belongs to a coherent layer. (C) Single cell layer view of the endothecium (surrounded by epidermis). A single endothecial cell is outlined. (D) Single cell layer view of the secondary parietal layer (surrounded by endothecium and epidermis). A single spl cell is outlined. (E) View of all four layers at once in two locules. (F) A 530 μm anther still has the same three L2-derived cell types. Connective tissue between the locules is seen in the center of the image. (G) A 700 μm anther with periclinal divisions occurring stochastically in the spl to yield the middle layer and tapetum. (H) All five locule cell types. (I) The endothecium, middle layer, and tapetum have distinct morphologies soon after their specification, as in this 930 μm anther. (J) Epidermis and endothecium showing their characteristic perpendicular lattice arrangement in a 2200 μm anther (nuclei are staining red; cell walls green). (K, L) Reconstruction of a Z-stack to give the X-Z plane (as in a transverse section) in a 375 (K) and a 675 μm anther (L). Four locule cell layers are visible (epi, en, spl, and ar), along with vascular elements and connective tissue. This image shows that confocal imaging can be just as good as transverse sections in getting transverse information. epi, epidermis; en, endothecium; ml, middle layer; t, tapetum; pmc, pollen mother cell; v, vasculature; spl, secondary parietal layer; c, connective; g, germ cell; L2, L2-derived multipotent cell; L1, L1-dervied epidermis precursor. Scale Bars = 25 μm.
Establishing a timeline of tissue appearance and mitotic activity
The time line was used to organize cell counts and dimension measurements from 3D reconstructions of ∼250 anthers spanning the 30 day period from the primordium to pollen shed. The appearance, differentiation, and period of mitotic proliferation for locular cells were determined, and key events are listed on the timeline (Figure 2A) and shown in images below the timeline (Figure 2B-J). A minimum of 10 anthers for each of these designated stages was analyzed, with additional anthers within the 100–900 μm size range during which cell fates are established and archesporial cells proliferate.
In anthers smaller than 170 μm no archesporial (ar) cells are visible; instead, dozens of L2-d cells similar in size, shape, and appearance are present in the locule, arranged in a disorganized manner. After examining dozens of 100-200 μm anthers, we have determined that ar cells are not visible using our techniques until 40-100 L2-d cells are present in each locule. In 170 – 200 μm anthers, these ar cells are visible as large spherical cells positioned in a central column of the locule (Figure 2B). The ar cells are larger and rounder than their rectangular neighbors. As few as 2 ar cells were observed in a 170 μm anther, and an average of 7 ar cells are seen in 170 – 230 μm anthers; 70-90 L2-d cells, arranged in 2 flanking rings, surround these ar cells. There is no evidence for a single founding hypodermal cell that divides to form a single primary parietal cell initial and an ar initial, directly contradicting the 1 ppc / 1 ar cell per locule theory in the lineage model. Also, the ar cells arise much later than postulated in the lineage model, raising the possibility that ar identity is acquired in a few central cells from a field of equivalent L2-d cells.
After ar specification, the somatic tissues are patterned. Some authors have suggested that the endothecium, ml, and tapetum differentiate simultaneously from a field of parietal cells (Goldberg et al., 1993; Koltunow et al., 1990). The alternative hypothesis, postulated by the lineage model, is that the endothecium is present early, along with the spl, which will later generate the tapetum and ml. Indeed, in 250 – 600 μm anthers, four concentric rings of cells are present, which we designate as the epidermis, endothecium, spl, and archesporial cells (Figure 2C-F,K,L). At 240 μm, the endothecium has initiated X-axis cell expansion while the spl remains cuboidal, indicative that these two layers have acquired distinct identities (Figure 2C,D, S1A). While the epidermis, endothecium, and ar cells are present for the rest of development, the spl is a transient, highly mitotic cell type with a 2-day lifespan. In agreement with the lineage model, the secondary parietal layer later makes periclinal divisions to produce the ml (external) and tapetum (internal) (Figure 2G). This occurs during a 12 h window in anthers ranging from 600-750 μm long. After these new layers are born, they differentiate as distinct tissues based on cell size and shape (Figure 2H, see more data below). In anthers 900 μm long, the four somatic wall layers all have distinctive shapes (Figure 2I), and the endothecium, and the surrounding epidermis have orthogonal long axes (Figure 2J). By the 1000 μm stage, the ar cells have ceased mitosis, and they become pmc as they prepare for meiosis. The pmc will reach mid-prophase 1 of meiosis 18 h after the 1500 μm stage in the W23 inbred line (Ma et al., 2008), and like all maize pmc, will proceed through meiosis synchronously (Scott et al., 2004).
Cell type characteristics just before the initiation of meiosis
Because the 1500 μm stage represents a turning point when the reproductive cells switch from mitotic proliferation to meiosis, it was chosen for the initial analysis of cell numbers in each locular tissue (Table 1). From initial counts in anther primordia it is clear that each tissue contributes a different number of cells to the 1500 μm locule. For instance, the epidermis is made up of ∼1900 cells per locule, derived over 8 days from an initial population of ∼75 founder cells in the 100 μm primordium. All ∼12,130 internal cells are derivatives of the initial ∼40 primordial L2-d and L3-d cells in the 100 μm primordium. Consequently, the average mitotic rate for internal cells is nearly twice that of the L1-d population. The ml and tapetum are born with the same number of cells during the 600–700 μm stage (more on this below), yet by 1500 μm there are almost twice as many tapetal as ml cells. These data refute the assumption in some models of a constant mitotic rate for all L2-derived cell types. The cell counts at 1500 μm indicate that from the initial cell population in each tissue – at the anther length when the tissue is recognized as present – there are either different mitotic rates among cells of that cell type, or cells have the same mitotic rate but that subsets cease mitosis precociously, or both factors contribute.
Table 1. Cellular parameters of anthers just before meiosis starts (1.5 mm).
Each entry in the table represents the average of dozens of counts and measurements made in each of at least five wild type anthers. The Y:X ratio represents the ratio of cell length to width. Note that the epidermis is four times as long as it is wide, while the endothecium is the opposite. The middle layer is about twice as long as it is wide, while the tapetum is relatively cuboidal, and the germ cell is spherical with thinner, curved cell walls.
| Cell Count | Cell Dimensions (μm) | |||||||
|---|---|---|---|---|---|---|---|---|
| Y | X | X*Y | Y | X | Z | Vol (μm)3 | Y/X | |
| epi | 52 +/- 9 | 36 +/- 2 | 1872 | 24.3 +/- 5.0 | 8.2 +/- 2.1 | 9.4 +/- 1.0 | 1870 | 3 |
| en | 200 +/- 23 | 15 +/- 1 | 3000 | 6.6 +/- 0.6 | 30.5 +/- 6.1 | 8.3 +/- 1.2 | 1670 | 0.2 |
| ml | 129 +/- 14 | 20 +/- 1 | 2580 | 10.9 +/- 1.5 | 14.8 +/- 2.9 | 6.0 +/- 1.0 | 760 | 0.7 |
| t | 146 +/- 18 | 31 +/- 2 | 4526 | 9.6 +/- 1.2 | 8.7 +/- 0.9 | 12.6+/- 1.5 | 1060 | 1.1 |
| pmc | 37 +/- 2 | 4.3 +/- 0.5 | 154 | 30 | 28 | 25 | 21,000 | 1 |
Cell-type specific programs of division and expansion
Overview of findings
The final form of an organ reflects the pattern of cell proliferation, expansion, and differentiation of the constituent tissues and their cell types. Are these patterns consistent among the locular tissues, or do individual cell types have signature programs? For each layer, cell sizes along the X-, Y-, and Z-axes (Figure 3A,C,E) and numbers along the X- and Y-axes (Figure 3B,D) were quantified from at least 5 anthers per stage with >20 replicate counts per anther, including the tapered basal and apical tips. These values were multiplied to derive the total number of cells per anther, resolved by tissue type (Table 2, Figure 3F). Average cell volumes were calculated as well (Figure 3G). The patterns of X- and Y-axis expansion and proliferation are shown in Figure 4A-P, with arrows representing the relative contribution of each growth parameter. These arrows overlay images of each locular cell type at four stages (250, 400, 750, and 1500 μm) (see the key between panels A and B - the thickness of the arrows represents a qualitative description of the relative contribution of each parameter). Diagrams representing the final cell shape are shown in Figure 4Q-U.
Figure 3. Charting cell expansion and division over anther development.
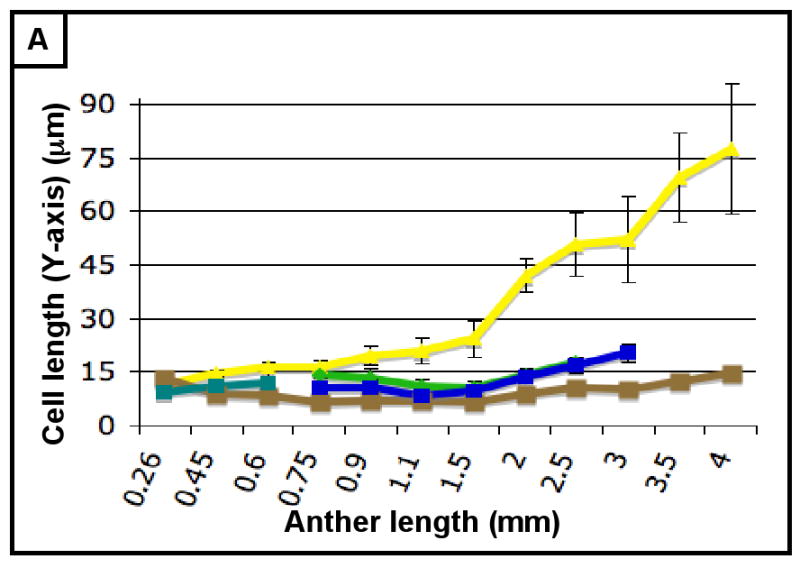
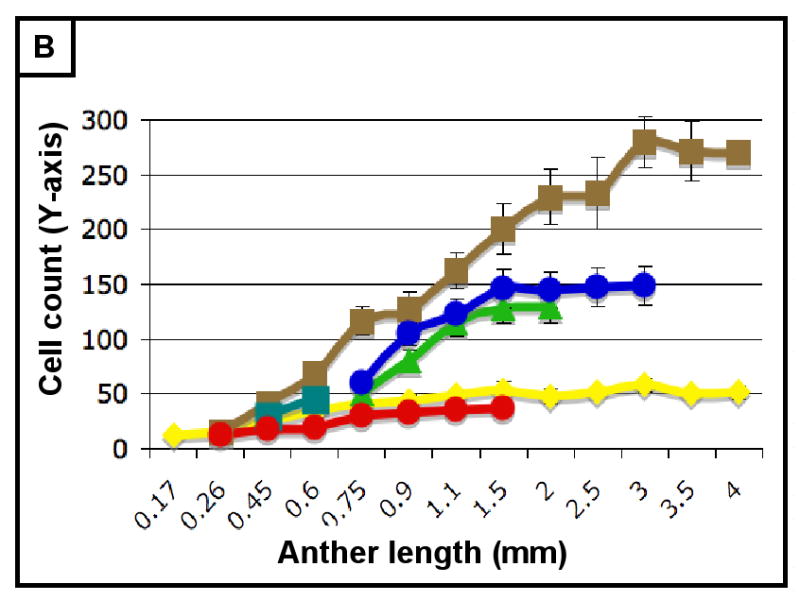
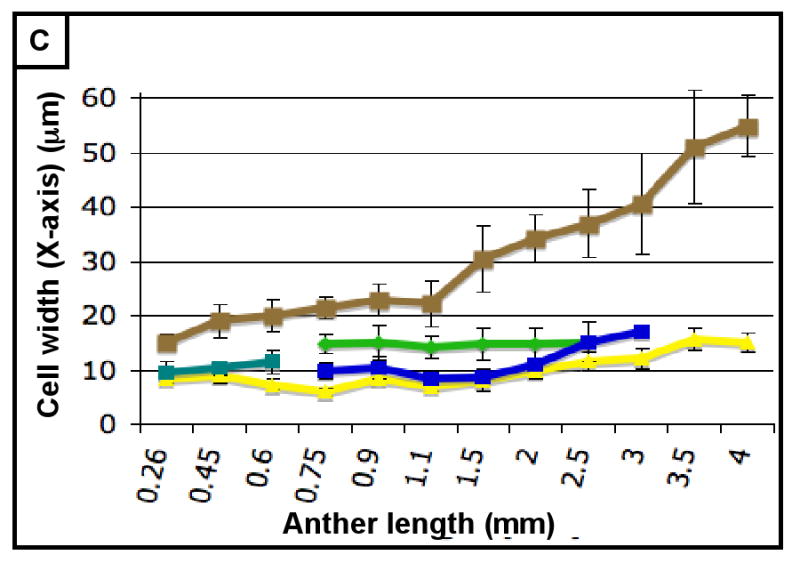
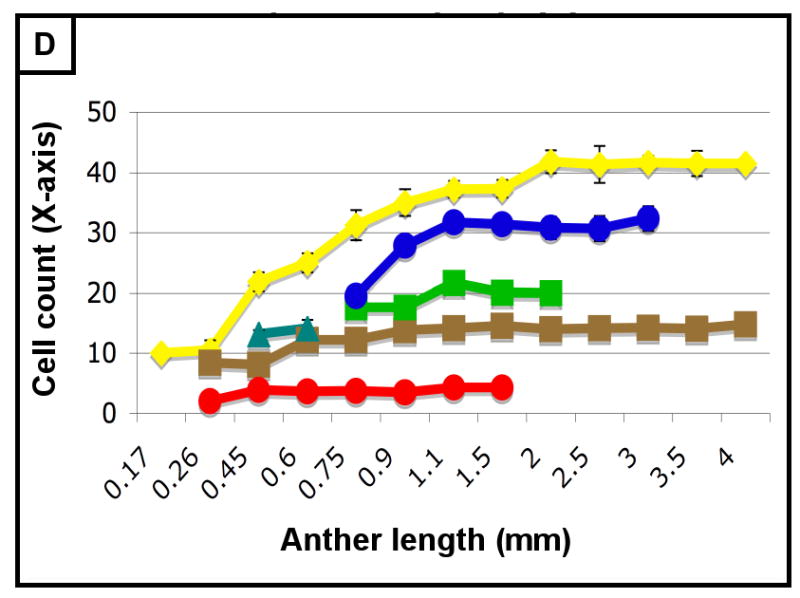
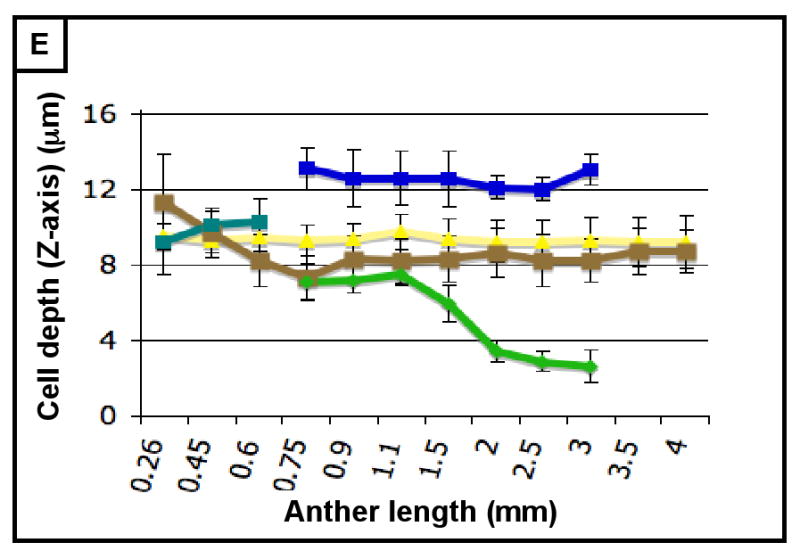
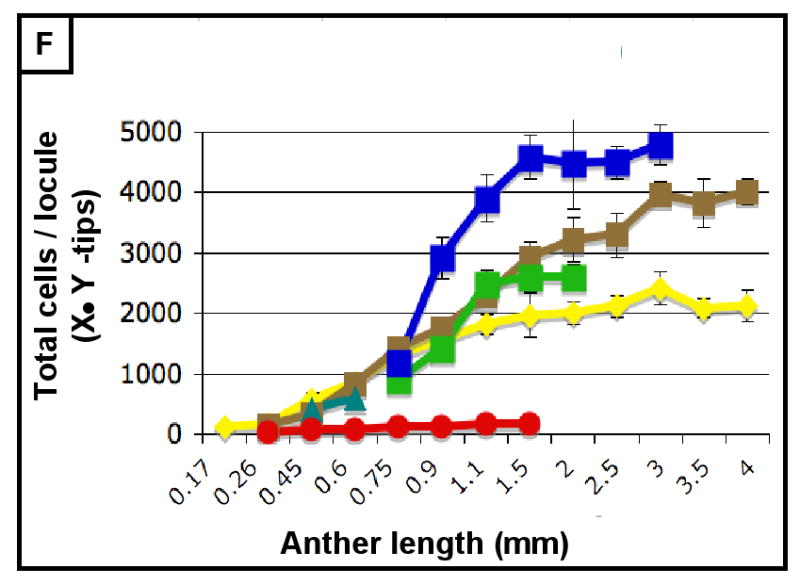
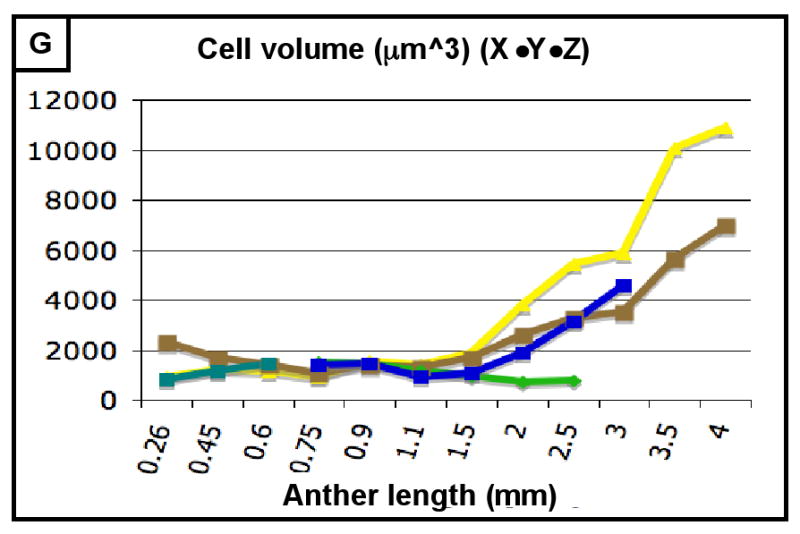
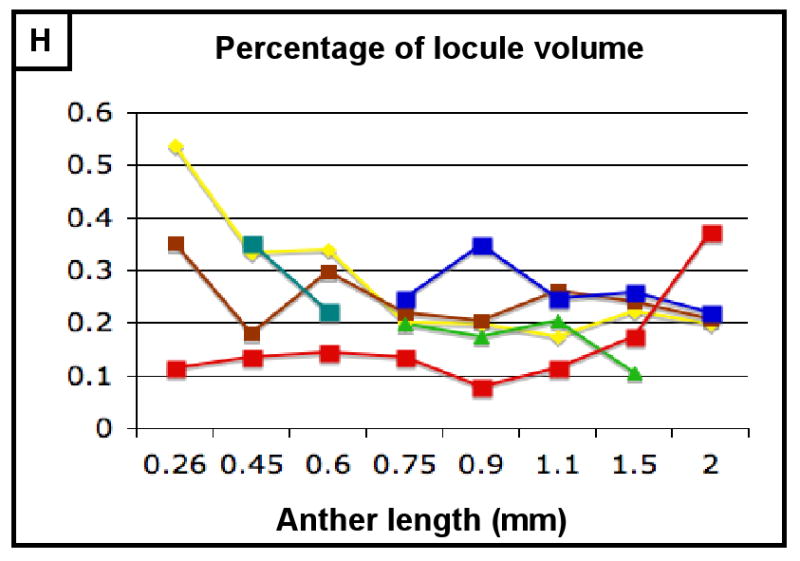
(A-H) Characterizing the development of each cell layer using 8 metrics: cell length along the Y-axis (A), cell count along the Y-axis (B), cell width along the X-axis (C), cell count along the X-axis (D), cell depth along the Z-axis (E), total number of cells per locule (F), calculated cell volume (G), and the cell layer volume as a percentage of total locule volume (H). Data only exists for the middle layer up until 2 mm because it degrades shortly thereafter, and for 3 mm in the tapetum for the same reason. (B,D) Cell division is tracked over all stages of anther development beginning with the emergence of the germ layer, the SPL, and the endothecium from L2-d precursors. Note that the SPL is shown in teal for 0.26, 0.45 and 0.6 mm anthers, and that the counts for the middle layer and tapetum always start out at 0.75 mm with relatively similar cell counts to the SPL at 0.6 mm. (B) L-anticlinal (length-adding) divisions are responsible for the trends here. The endothecium stands out in this chart for two reasons - it ends up with 100 more cells per column than any other cell type, and it keeps making L-anticlinal divisions days after all other cell division has ceased. (D) G-anticlinal (girth-adding) divisions are responsible for the trends here. These divisions are finished in the endothecium by 900 μm, yielding only ∼14 columns of endothecium cells. G-anticlinal divisions stop occurring in the middle layer and tapetum shortly thereafter (at 1100 μm), and there is a final burst in the epidermis just before meiosis. G- and L-anticlinal divisions account for all clonal cell division in the anther (F). It is clear in G that the tapetum has the most rapid cell division of all the cell types, particularly in 0.75 - 1.1 mm anthers. (A, C, E) Cell expansion is tracked. Note that cell expansion accounts for some, but not much, of anther growth leading up to meiosis (at 2.0 mm). Because cell division stops before meiosis (except in the endothecium), cell size increases are responsible for anther growth thereafter, as can be seen in H and I. (A) Cell size along the Y-axis, with the epidermis leading the way. (C) The endothecium clearly gets wider than the other cell types. (E) It is clear that the endothecium and middle layer get thinner over time, most likely to make room for the expanding meiotic column. (G) Cell volume increases drastically after meiosis in all somatic cells except the middle layer. Before meiosis, cell expansion seems to be suppressed by rapid cell proliferation, especially in the SPL, middle layer, and tapetum. (H) The somatic cell types of the anther make up most of the space early, but gradually give way to the enlarging meiotic cells and pollen grains.
Table 2. Cell count.
Each entry in the table represents the average of dozens of counts and measurements made in each of at least five wild type anthers. Most values have an s. d. of less than 10% of the give number of cells, though a couple values had standard deviations that were as high as 19%. The counts for the vascular + connective tissues are estimated based on multiplying the Y count with the number of cells per cross-section.
| Stage | Cell fate acquisition + mitotic proliferation | Meiosis | Post-meiotic | ||||||
|---|---|---|---|---|---|---|---|---|---|
| Anther length (mm) | 100 | 170 | 250 | 500 | 750 | 1000 | 1500 | 2000 | 4000 |
| Anther age (dap) | 0.5 | 1.2 | 2 | 3 | 4 | 5 | 8 | 9 | 30 |
| epi | 75 | 135 | 160 | 600 | 1295 | 1650 | 1872 | 1980 | 2300 |
| hypo | 43 | 100 | |||||||
| en | 130 | 490 | 1425 | 1800 | 3000 | 3220 | 3500 | ||
| ml | 900 | 1900 | 2580 | 2580 | degraded | ||||
| spl | 90 | 400 | |||||||
| t | 1180 | 2400 | 4525 | 4525 | degraded | ||||
| ar / pmc | 0 | 0-4 | 20 | 70 | 115 | 130 | 154 | 154 | 616 (pollen) |
| connective + vascular | 150 | 250 | 400 | 800 | 1500 | 3000 | 5000 | 7000 | 7000 |
| total cells per locule | 118 | 238 | 400 | 1560 | 4915 | 7880 | 12131 | 12459 | 6416 |
| per anther | 622 | 1202 | 2000 | 7040 | 21160 | 34520 | 53524 | 56836 | 32664 |
Figure 4. Cell layer – specific growth parameters change over developmental time.
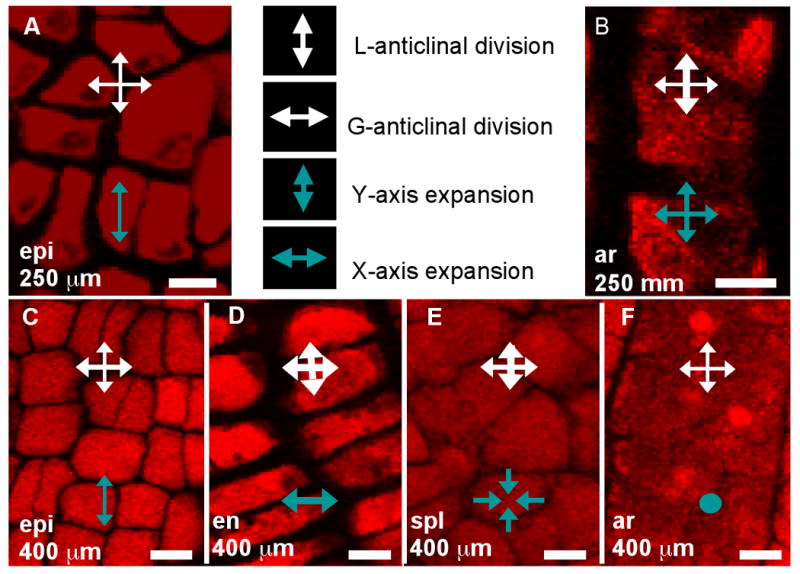
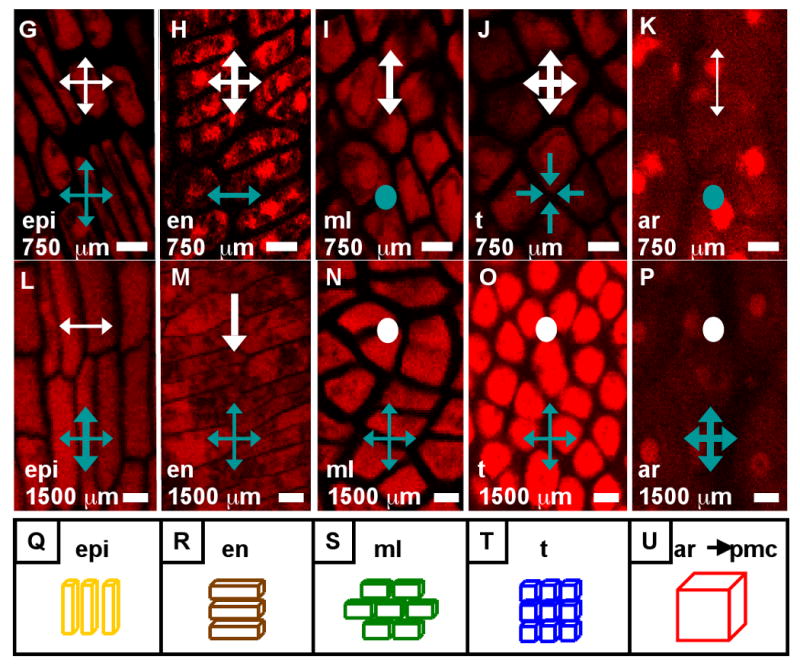
(A-P) Close-up images of locular cell types present at 250 μm (A, B), 400 μm (C-F), 750 μm (G-K), and 1400 μm (Sun et al.) with arrows indicating the relative contribution of directed cell expansion and division during that period (see key between A and B. Dots indicate that the parameter did not contribute to growth). (A, C, G, L) Epidermis. (B, F, K) Archesporial cells. (D, H, M) Endothecium. (E) Secondary parietal layer. (I, N) Middle layer. (J, O) Tapetum. (P) Pollen mother cells. Note that immediately after their birth in 750 μm anthers, the middle layer and tapetum cells are indistinguishable (I, J). (Q-U) Approximate shapes of the four wall cell types in 1500-μm anthers. Though the cells aren't perfect rectangular solids (especially in the case of the middle layer, which tends to look trapezoidal) their shapes are near enough to that of a brick to warrant this representation for simplification. The stereotyped L- and G- anticlinal divisions and strict axis – based cell expansion, without skewed or diagonal division planes is the basis for the division / expansion analysis in (A-P). The exception to this rule is in undifferentiated cell types: the parietal layers and the early middle layer and tapetum can have new cell walls built at slight diagonal angles. Scale bars = 10 μm.
As shown in Figure 3B, the endothecium has consistently more cells per column than other cell types, indicative of a greater contribution of L-anticlinal cell division. As girth is greatest at the perimeter it is not surprising that there are more epidermal columns (Figure 3B) than in other tissues, however, the subepidermal endothecial layer has fewer columns than the more internal middle or tapetal layers; therefore, cell expansion rather than substantial G-anticlinal division occurs in the endothecium to accommodate increased girth during anther growth. The last specified ml and tapetal tissues start with an equal number of similarly sized cells at 750 μm (Figures 2G, 3A,C,E,G) but tapetal cells undergo more G-anticlinal (Figure 3B) divisions after their specification and have greater Z-axis depth (Figure 3E) compared to ml cells. The archesporial cells proliferate primarily by L-anticlinal divisions forming 3-4 central columns of cells that are larger than the somatic cell types.
Therefore, from this assessment of cell numbers and volumes, it is clear that each cell type utilizes a specific and distinctive proportion of L- and G-anticlinal divisions to contribute to anther girth and length. Pairs of adjacent cell types (endothecium and spl or ml and tapetum) are distinguished readily by their growth parameters. As a result, the contribution of each cell type to total locule volume is neither correlated with cell numbers, nor with the relative position of a tissue ring within the near circular locule. Furthermore, immature anthers do not have enlarged, DNA-rich cells (data not shown), suggesting that cells expand to a typical size and then divide and that endopolyploidization is not a developmental feature of this organ. Another observation is that immediately after the first appearance of ar, ml, and tapetum, there is a burst of mitotic activity (Figure 3E).
Archesporial cells
Like gonialblasts in mice and flies, archesporial cells are committed “pre-meiotic” progenitor cells, which undergo a limited number of mitotic amplification divisions before entry into meiosis. Without knowing the initial number of ar cells, however, calculating the mitotic pace that results in the readily quantified number of pmc per locule has not been possible. Archesporial mitotic divisions have been quantified from cell counts in transverse sections and by calculation of metaphase nuclei in several species at the midpoint between the primordium and meiotic entry point stages (Bennett, 1971; Bennett, 1977; Ivanov, 1997; Kiesselbach, 1949). Bennett 1973 cataloged three rounds of division, averaging 3 days per division, during cabbage anther growth. Here, as few as 2 or as many as 12 (average 7) maize ar cells are initially observed in the 4 h growth period from 170 - 190 μm. By 250 μm there are ∼20 archesporial cells; if there are 5 cells initially and they all divide twice in 18 hr, the cell cycle during this period is 9 hours. These cells continue to amplify quickly between the 250-500 μm stages. During this ∼32 h interval, archesporial cell numbers increase 3.5 fold (Table 2); if all cells are proliferating, the average cell cycle lasts less than 15 h. Over the subsequent 2.5 days as the anther grows from 500 to about 1200 μm, ar cells enlarge and double in number, reaching ∼150 after the four wall layers have differentiated (about 3 days before meiosis) (Figure 3F; Table 2). To support inferences based on cell counts, immature tassels were injected with EdU, a thymidine analog that is incorporated into dividing cells and imaged with Click-It chemistry (Kotogany et al., 2010). EdU-labeled ar cells are found in 200-900 μm anthers (Figure S2A,B), but none are found after 1000 μm (Figure S2C-E).
When cell division ceases, ar cells enlarge. The average ar cell radius is ∼15 μm in young anthers (< 500 μm), 20 μm by the 600 μm anther length stage, and then constant until anthers reach 900 μm before pmc enlarge again to ∼45 μm before meiosis (Figure 3A,C,E,G; 4B,F,K,P; Table 3). Meiotic competence is presumably acquired during this maturation phase after cell division has ceased. Based on cell counts and EdU labeling, some ar cells must cease dividing while others are maturing, so there does not appear to be a global control mechanism that stops ar cell division and initiates pmc differentiation. Although the cessation of ar proliferation and switch to pmc maturation appear to be stochastic and scattered along the anther length, the initiation and progression of meiosis is completely synchronized along the length of the anther (Erickson, 1948). Meiotic synchrony is visible because the stages of prophase 1 are distinguished by distinctive chromosome dynamics (Hamant et al., 2006); we confirmed this by monitoring the dyad, tetrad, and quartet stages which are clearly visible and completely synchronous throughout the whole locule based on PI staining (Figure S3A-C). In conclusion, immediately after their specification ar cells undergo a burst of asynchronous proliferation that slows over time.
Table 3. Cell size.
Each entry in the table represents the average of dozens of counts and measurements made in each of at least five wild type anthers. Most values have an s.d. of less than 10% of the given value, though a couple values had standard deviations that were as high as 25%.
| Anther Length (μm) |
Age (dap) |
epi | hypo | en | ml | spl | t | ar / pmc | ||||||||||||||
|---|---|---|---|---|---|---|---|---|---|---|---|---|---|---|---|---|---|---|---|---|---|---|
| X | Y | Z | X | Y | Z | X | Y | Z | X | Y | Z | X | Y | Z | X | Y | Z | X | Y | Z | ||
| 100 | 0.5 | 8 | 8 | 7 | 12 | 12 | 12 | |||||||||||||||
| 170 | 1.2 | 8 | 10 | 10 | 12 | 12 | 12 | 15 | 15 | 15 | ||||||||||||
| 250 | 2 | 8 | 12 | 10 | 12 | 12 | 11 | 10 | 9 | 9 | 15 | 15 | 15 | |||||||||
| 500 | 3 | 8 | 15 | 9 | 19 | 9 | 10 | 10 | 11 | 10 | 20 | 20 | 20 | |||||||||
| 750 | 4 | 6 | 17 | 9 | 22 | 7 | 7 | 14 | 14 | 10 | 14 | 14 | 10 | 20 | 20 | 20 | ||||||
| 1000 | 5 | 7 | 21 | 8 | 22 | 7 | 8 | 14 | 11 | 7 | 8 | 9 | 13 | 28 | 30 | 25 | ||||||
| 1500 | 8 | 8 | 24 | 9 | 30 | 7 | 8 | 15 | 9 | 6 | 9 | 10 | 13 | 45 | 45 | 45 | ||||||
| 2000 | 9 | 10 | 42 | 9 | 35 | 9 | 9 | 15 | 8 | 4 | 13 | 14 | 12 | |||||||||
| 4000 | 30 | 15 | 77 | 9 | 55 | 15 | 8 | |||||||||||||||
Secondary parietal layer
In the anthers examined in the current study, about 12 h after ar cells are apparent, the outer column of L2-d cells acquires the distinctive morphological characteristics of the endothecium clearly evident by the 240 μm stage (Figure S1A,B). The ring of cells nested inside the endothecium retains approximately the same cellular dimensions as the original L2-d cells, despite continuing L- and G-anticlinal divisions to contribute to anther elongation and girth. These cell are designated the spl, and number about 9 rows of 10 cells in 250 μm anthers (Table 2). Half of these will make G-anticlinal divisions and all will make 2 L-anticlinal divisions to produce ∼14 rows of ∼ 40 cells each in 600 μm anthers (Figure 3B,D; 4E; Table 2). Cell size decreases during this period because expansion does not keep pace with the rapid rate of division. The spl initials are rectilinear with rounded edges, about ∼15 μm in both the X and Y dimensions and ∼10 μm in the Z. After a short burst of mitoses the average cell size shrinks to 12 μm in the X and Y. Calculations based on counts indicate that the spl is the most mitotically active cell layer of the anther during this period, with a cell cycle ∼10 - 12 h long.
During the 650 – 750 μm stage, each spl cell divides once periclinally to produce ml and tapetum initials (Figure 2G). After a 50 h in planta EdU incubation, in several 500-600 μm anthers every spl cell was labeled, as would be predicted if a periclinal spl division were required in every cell (Figure 5D). The uniform labeling also affirms the EdU reagent readily penetrates anthers – even traversing several cell layers. Spl periclinal divisions are not synchronized despite completion of these divisions within ∼12 h (Figure 2G).
Figure 5. Anthers do not develop from a meristem.
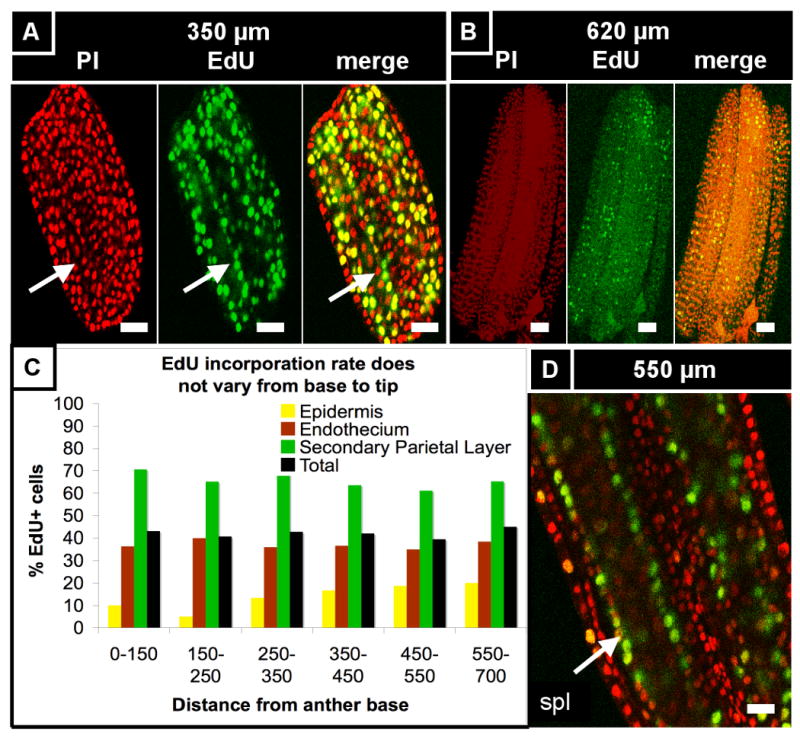
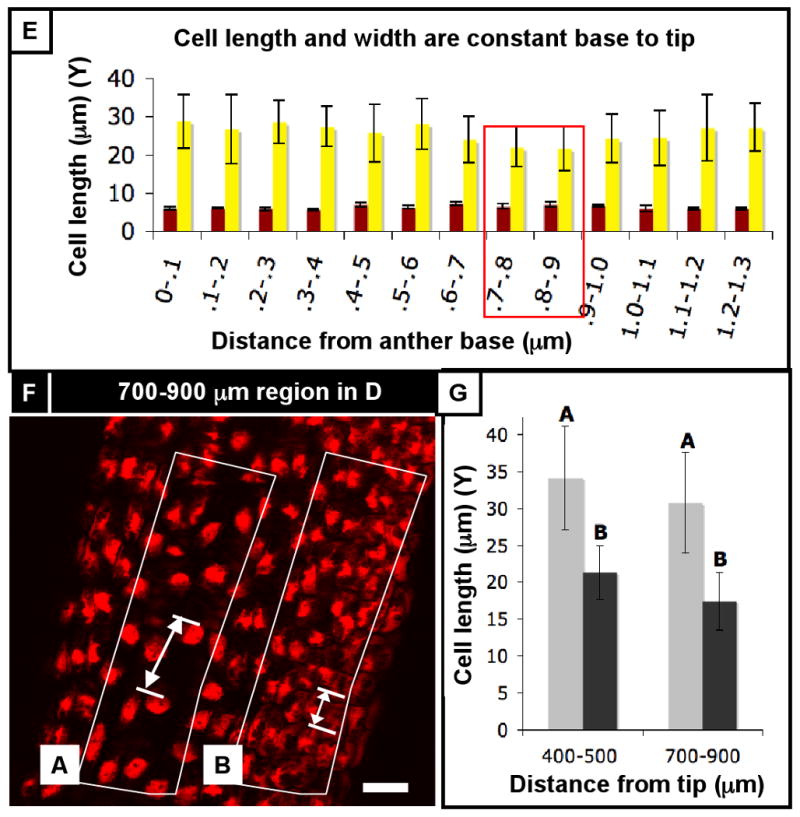
(A) 350 μm anther co-stained for PI and EdU (50 hr incubation). EdU-labeled cells are evenly distributed from base to tip, with almost every somatic endothecium and spl cell labeled. In contrast, there are zero EdU-labeled archesporial cells, leaving an obvious gap in EdU incorporation in the center of the locule (arrow), although other anthers had EdU-labeled germ cells (see Figure S1). The epidermis, connective, and vascular cells also had relatively low rates of EdU incorporation, suggesting that the somatic L2-d cells are highly mitotic at this stage. (B) A 620 μm anther co-stained for PI and EdU (5 minute incubation). The EdU marks cells that were in S phase during that brief incubation, and thus represent a snapshot of mitotic activity over the whole anther. EdU-labeled cells are found along the entire length of the anther, with no obvious distribution towards the base or tip. In addition, cell size does not seem to vary much from base and tip (also seen in Figure 1D), further arguing against a basal intercalary meristem. In addition, the even distribution of EdU-labeled cells during such a brief incubation argues against the idea of a moving wave of mitoses. (C) Rate of EdU incorporation in 100-μm segments from base to tip of a 700 μm anther (the base and tips are narrower, so to increase counts in these regions, segments were made to be 50 μm longer). EdU incorporation rate does not vary along the length of the anther in any of the cell types (color) or in total (black). In addition, the percentage of EdU-labeled cells was much higher in the spl than the endothecium, which was in turn higher than the epidermis, as expected based on cell counts. (D) A 550 μm anther that was incubated in EdU for 24 hours. At this stage the spl is highly mitotic compared to the other cell types, with a cell cycle as short as 11 h long. This fact is represented in this image by the columns of EdU-labeled spl cells (arrow) surrounding the archesporial cells. (E) Cell width and length does not significantly vary along the length of the anther, supporting our observations. (F) In this particular anther, however, there was a non-significant drop in epidermal cell length between 700 and 900 microns from the anther base. There, we observed a few columns of shorter cells (“B”) adjacent to columns that had longer cells (“A”) on the arch of the theca. (G) The long cells (“A”) are significantly longer, on average, than the smaller cells (“B”), suggesting that these regions are not developmentally coordinated. Scale bars = 25 μm.
Asymmetric cell division (ACD) is a developmental strategy in plants for generating patterning cues within a population of similar cells. ACD underlies stomatal spacing on the Arabidopsis leaf surface (Lampard et al., 2008), apical-basal embryo patterning (Lukowitz et al., 2004), and root endodermis specification (Carlsbecker et al., 2010). During ACD, a larger and small daughter are typically produced; in one case it is also known that morphogenetic factors exhibit some degree of partitioning (Dong et al., 2009) and biased distribution of unknown factors are assumed in other symmetry breaking events. Does ACD play a role in cell fate specification in maize anthers? To test this, cell volumes of newly born daughters of the single periclinal division of each spl cell were measured in W23. The only daughters analyzed had thin, new cell walls and were bordered by at least 2 neighbors that had not yet divided periclinally. These daughter cells had equal X, Y, and Z dimensions, and volume (Figure S8), ruling out the possibility of a physical asymmetric cell division as the proximate cause of ml and tapetal cell specification in W23.
Epidermis
Based on scanning electron micrographs the anther epidermis is composed of coherent rows and columns of elongated cells of roughly equivalent length and width. In this study, epidermal cells make L-anticlinal divisions during cell fate setting (Figure 4D), yet cell expansion still outpaces division in the y-axis as the epidermis increases from 10, 10-μm cells in primordia to 34, 17.6-μm cells just before the periclinal division of the spl (Figure 3B). From 600 - 750 μm, division and expansion are balanced based on constant cell size (Figure 3A,C,E; 4G). After the 1000 μm stage Y-axis expansion completely accounts for anther elongation, as the cells quadruple in length from 19 to 77 μm (Table 3, Figure 3A). In the X-axis, G-anticlinal divisions accommodate circumferential anther growth from primordial to the 600 μm stage, but then cease for nearly one week, until the number of epidermal columns suddenly increases from 36 to 42 during prophase I of meiosis (Figure 3B). Epidermal cells are typically ∼8 μm wide (along the X-axis) through meiosis, but they expand to ∼15 μm wide during microsporogenesis (Figure 3C). The long pause in epidermal cell anticlinal mitosis is supported by the absence of EdU labeling in the epidermis in 900 - 1400 μm anthers (Figure S4C).
Endothecium
The subepidermal endothecium has been described as a second epidermal-like layer, an “endodermis” (Ma et al., 2008), or as an outer ml (Cheng, 1979). None of these accurately describes the origin of the endothecium. In many species, during anthesis and pollen shed, the endothecium plays a critical role in splitting the anther open to display pollen to insect pollinators or to favor self-pollination (Zhu et al., 2004). There is no epidermal layer at the junction of connective and endothecial cells, and endothecial cells often contain prominent starch granules (Zhu et al., 2004) hence this cell layer may store energy for each locule. We hypothesize an additional early role to reinforce the elongate shape of immature and maturing anthers. Prior reports have noted that in maize anthers endothecial cell elongation is opposite in orientation to the epidermis (Cheng et al., 1979; Dawe and Freeling, 1990; Kiesselbach, 1949). The PI data confirm this: by 250 μm, the first sign of differentiation is evident because endothecial cells are wider than they are long unlike their epidermal and spl neighbors (Figure 2C,D, S1A). Epidermal cell walls are reinforced to sustain cellular asymmetry with a long Y- and short X-axis; endothecial cells are asymmetric in the opposite orientation: short Y and highly elongated X (Figure 2J, 4D,H,M).
Regularity in new wall placement during cell division is a hallmark of endothecial cells. They tend to build new cross walls that are at right angles to the X- and Y-axes; few diagonal or skewed walls have been observed. In contrast, new walls within the ml are often at non-right angles to existing walls resulting in trapezoidal shapes, which are never observed in the endothecium (Figure 4D,H,M). At inception, there are only 7 columns of endothecial cells, and almost all cell division is L-anticlinal to increase the number of very thin cells per column. Endothecial cells divide very infrequently in the X dimension, because the number of columns only gradually increases from 7 to 14 by the 1000 μm stage. No G-anticlinal divisions have been observed later even as the layer's circumference increases 3 fold. Instead, all of this growth in girth is achieved by anisotropic cell expansion (Figure 3C).
To keep pace with anther elongation, the endothecium continues L-anticlinal divisions until the 3000 μm stage, long after the other cell layers have stopped dividing (Figure 3B). EdU incorporation experiments are consistent with the conclusion that the endothecium but not the epidermis is dividing at 1400 μm, as the former but not the latter has EdU-labeled cells at this stage (Figure S4C,D). There is a slight pause in L-anticlinal division after meiosis, but that is followed by a burst to increase the final count to 275 cells per column (Figure 3B). As a consequence of this distinctive pattern of continued cell division, the endothecium is the second most numerous cell type in anther locules behind the tapetum. After 3000 μm, all growth is accounted for by cell expansion, as the average length increases from 10.4 to 14.5 μm (Figure 3A). Still, this final cell length is less than one-fifth of neighboring epidermal cells, while the final average endothecium width is more than 3.5 fold greater than epidermal cells. An interesting observation is that the nuclei in endothecial cells are aligned within a column, typically in the center of cells, although displacements from the center in multiple adjacent cells within a column are occasionally seen (Figure 2C,J, 4D,H,M).
Middle layer and tapetum
The most common class of male sterile mutants has tapetal defects (Skibbe et al., 2008). The tapetum is required to support meiosis of the pmc; one specific role is secretion of β-glucanases to remodel callose surrounding meiotic cells to liberate microspores from the tetrad at the end of meiosis (Wang et al., 2010). Post-meiotically the tapetum secretes macromolecules deposited onto the exine of developing pollen grains. Finally the near-empty tapetal cells senesce by ∼3500 μm, collapsing onto and thickening the wall material on the inside face of the living endothecial layer. This generates a surface to which developing maize pollen adheres during the final two weeks of maturation (Kirpes et al., 1996; Tsou, 2010). While the functions of the tapetum have been well studied, the middle layer is misunderstood. Although the function of the cell between the endothecium and tapetum is unknown, nearly all mutants affecting the middle layer also have a defective tapetum [mac1 of maize (Sheridan et al., 1999); tpd1 of Arabidopsis (Yang et al., 2005); rpk2 of Arabidopsis (Mizuno et al., 2007)]. A classic reference on phylogenetic considerations in flowering plant development refers to the layer as a ‘relic feature’ of pre-flowering plant anthers (Davis, 1966), while other authors have referred to it as a second endothecium or a second tapetum. Adding to the mystery, once the ml is born, it gets thinner and thinner until it degrades during pollen maturation suggesting that it is either a relic feature or whatever role it does perform is important prior to or during meiosis. Because most comparative anatomy has utilized transverse sections, the growth parameters of the ml cells, like the other anther tissues, have not been examined.
Immediately following their appearance, the ml and tapetum cells have the same sizes and shapes (Table 3; Figure 4I,J). From birth, however, these two cell types have a distinctive pace of division, as 24 h after their appearance there are 20% more tapetum cells (Table 2). While maintaining the same volume as their spl precursors (around 1100 μm3/cell) (Figure 3G), ml and tapetum cells have distinctive dimensions. ML cells are significantly longer (14 vs. 8 μm), and wider (11 vs. 9 μm) than tapetal cells in 1000 μm anthers, and they are narrower in depth (Z axis) (7 vs. 13 μm) (Figure 3A,C,E). The ml cells divide until 1500 μm, achieving a final count of ∼130 cells along the Y-axis (Figure 3B), with about 20 columns per locule (Figure 3D). ML cells do not align in neat rows and files like the epidermis and endothecium; instead, new cell walls are built at skewed angles to existing ones, resulting in a trapezoidal patchwork arrangement (Figure 4N). Starting around 1100 μm, the ml becomes progressively thinner in the Z-axis, shrinking from 7.5 to 2.6 μm by 2500 μm (Figure 3E); after that the ml becomes essentially invisible and is considered degraded. In summary, the ml is a separate tissue with distinctive growth parameters and senesces during meiosis.
We find that, like their spl precursors, tapetal cells have a rapid initial mitotic rate based on extensive EdU incorporation rates and cell counts (Table 2) and within one day become the most abundant cell type of maize anthers (Table 1; Figure 3F). Overall tapetal cells are similar to the SPL and early somatic L2-d cells in size and shape (Figure 4E,O). Over the ∼40 h period from the 750 to 1100 μm stages, tapetal cells divide anticlinally to double the number of cells along the y-axis from 60 to 120 while the number of columns increases from 21 to 32 (Figure 3B,D). During this period division outpaces expansion, because average tapetal cell dimensions decrease in the X and Y dimensions (Figures 3A,C). After 1100 μm, only L-anticlinal divisions occur to achieve a final count of ∼ 150 tapetal cells per column and about 4600 cells per locule by meiotic initiation (Figure 3B,F). From 1100 to 2500 μm the average tapetal cell increases 4-fold in volume: the width (X-axis) almost doubles from 8.3 to 15.1 μm, the length (Y-axis) doubles from 8.6 to 17.1 μm, and the depth (Z-axis) remains constant (Figures 3A,C,E). The tapetum is the only cell layer to average a Z-axis depth larger than 10 μm (Figure 3E). A novel feature of tapetal differentiation is that these cells become binucleate during meiosis (Figure 6A,B). This is a very unusual form of tetraploidy: in nearly all other instances plant cells arrest after S resulting in endopolyploidization (Osborn et al., 2003). Instead, in maize tapetal cells nuclear division is completed but cells do not undergo cytokinesis. As with other developmental events in anthers except meiosis, binucleation was asynchronous and gradual in anthers 1700 to 2300 μm long, encompassing all tapetal cells by the end of meiosis (Figure 6A,B). Prior publications have illustrated binucleation with transverse sections containing some apparently uninucleate tapetal cells, however, here a second nucleus was found in every cell after inspecting the Z-stack above and below the section plane.
Figure 6. Development is coordinated locally among small clusters of cells.
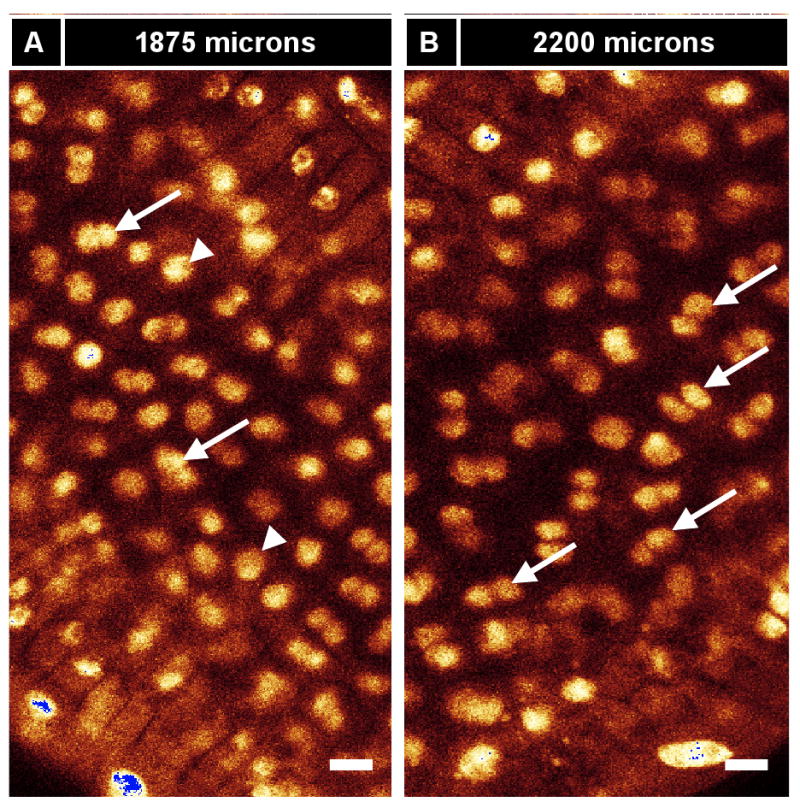
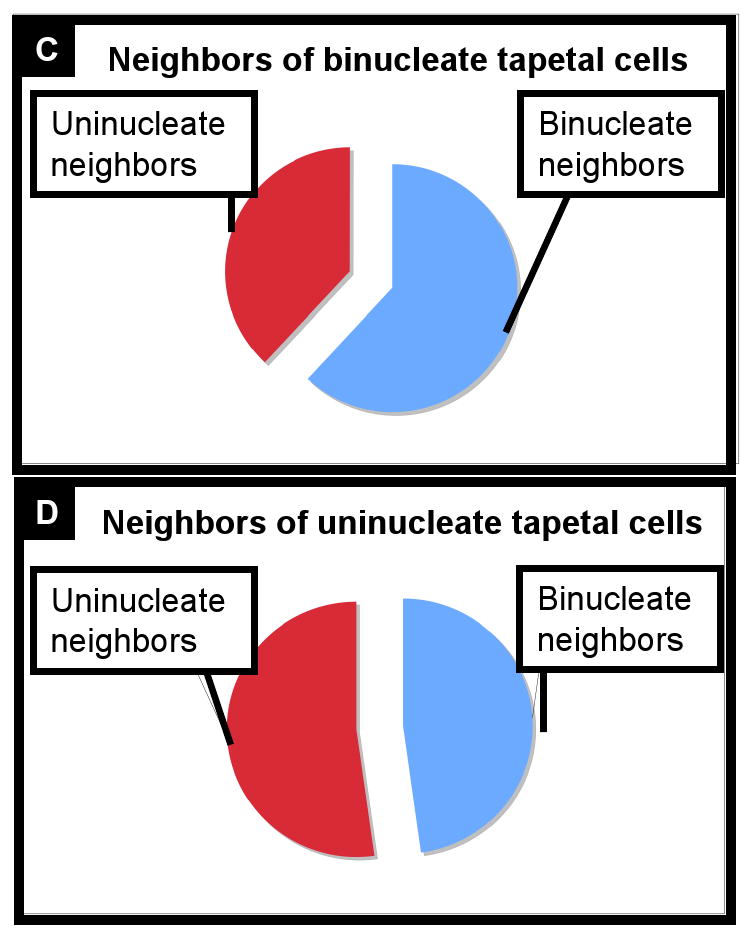
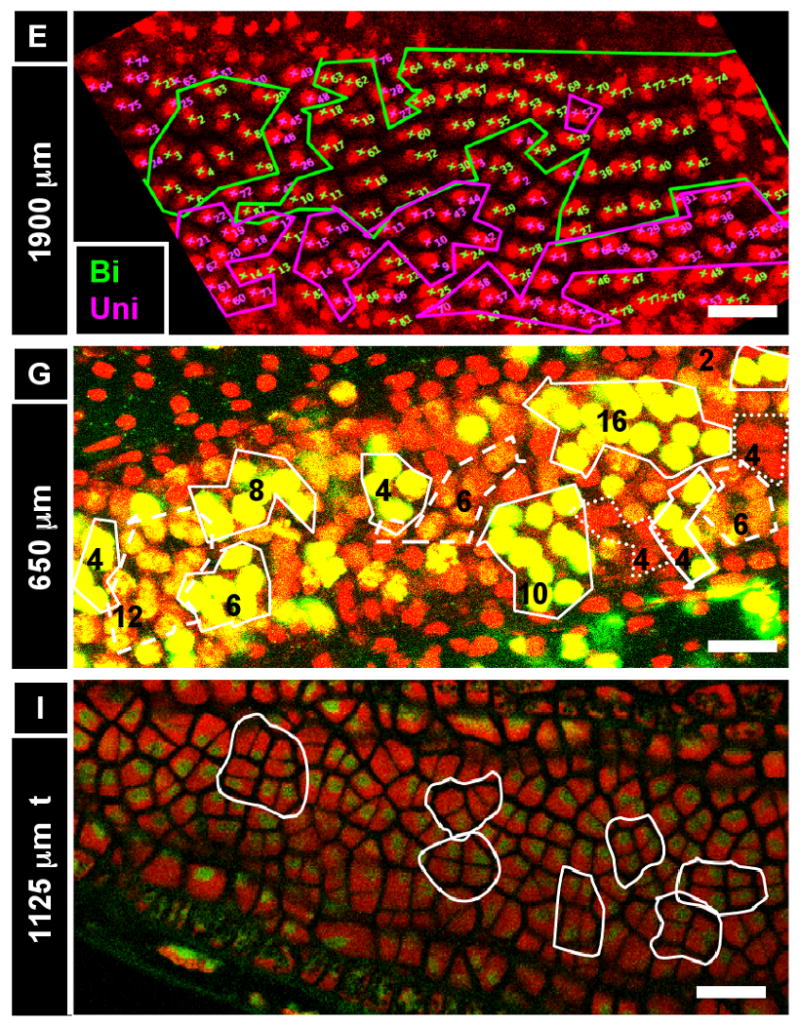
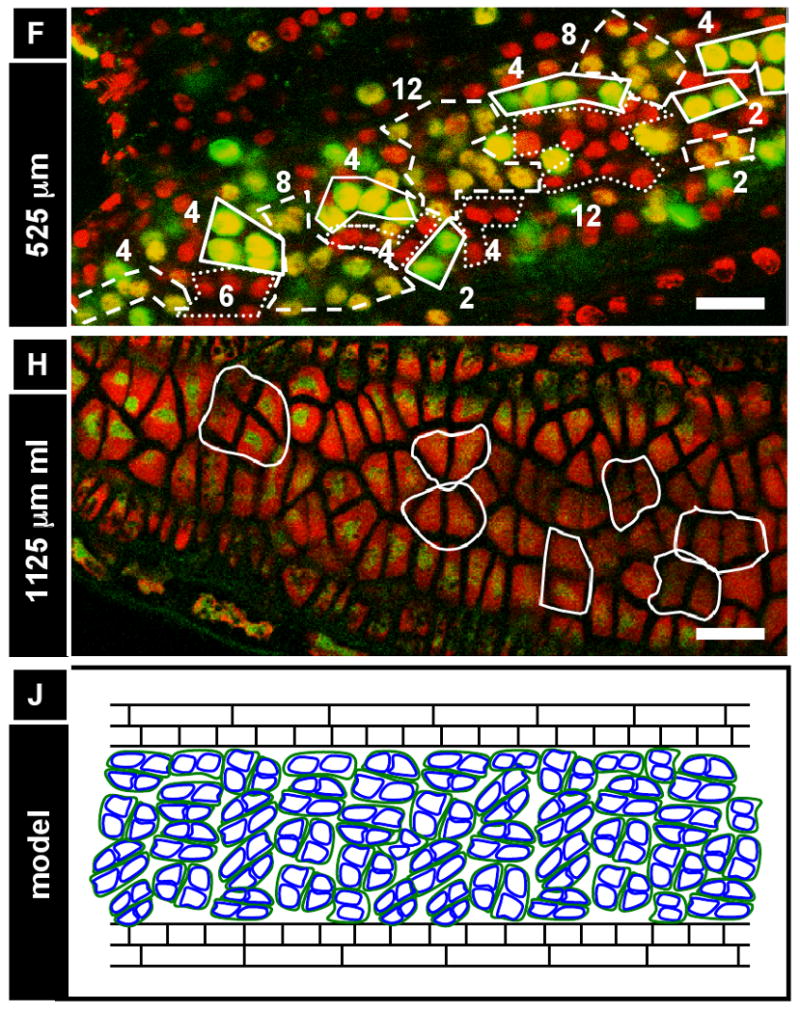
(A, B) Tapetum binucleation is gradual (arrows, binucleate tapetum cells; arrowheads, uninucleate tapetum cells). (A) An 1800 μm anther in optical section with a partially binucleate tapetum. (B) An older anther (2200 μm) from the same individual with a fully binucleate tapetum (arrows; although some cells appear uninucleate, they are truly binucleate, with the second nucleus being out of the optical plane). (C-E) Tapetum binucleation exhibits clustering. In this experiment, three anthers that had about half of their tapetum cells binucleate (average ∼53% binucleate) were analyzed. For each binucleate and uninucleate cell, neighbors were categorized as binucleate or uninucleate (total: 87 cells) (C) Binucleate cells are more likely to have binucleate neighbors and (D) uninucleate cells are more likely to have uninucleate neighbors. (E) A representative anther from C and D. Tapetum binucleation exhibits clustering (pink, uninucleate cells; green, binucleate cells). (F, G) Anthers from a 48 hr EdU in planta incorporation (12 injections, 4 hours apart) displayed clustering. Numbers indicate the number of cells circled in a given “clone”. [Solid circles, brightest cells (recent and/or repeated EdU incorporation); dashed circles, cells of medium brightness (one or more divisions away from most recent EdU incorporation); dotted circles, cells with no EdU staining visible (dropouts or slowly cycling).] (H-J) Middle layer and tapetum cells exhibit clustering. (H) Groups of two or four middle layer cells are outlined in an 1125 μm anther. (I) In the same anther, the same outlines perfectly overlay groups of four or eight tapetum cells. From this image, it appears that new cell walls build during anticlinal divisions of the middle layer and tapetum are continuous, and that the tapetum at this stage is exactly one round of division ahead of the middle layer. We hypothesize that these groups of 2, 4, or 8 middle layer and tapetum cells all share a common, single spl precursor, and that each spl cell functions as a developmental unit. (J) Model of middle layer and tapetum clustering showing the overlap of H and I. Scale bars: (A,B) = 10 μm; (E-I) = 25 μm.
The pace and order of cell fate determination events are consistent across inbreds and among upper and lower florets
To explore whether the time line (Figure 2A) is consistent beyond the upper floret anthers of the W23 inbred line, two additional sample types were analyzed. Previous analyses comparing three maize lines found that the correlation between anther length and developmental events was highly consistent, but these events were not related to a time line (Ma et al., 2007). To explore temporal pacing, W23 was compared to B73, the line chosen for maize genome sequencing (Schnable et al., 2009). B73 is tall, late flowering, and has a smaller tassel with fewer branches and lower spikelet density than W23. Anthers are ultimately slightly longer than W23 (5500 μm at maximum) and have a greater girth throughout development. Despite these macro-anatomical differences, cell fate determination events occur in B73 at the same stages as in W23: archesporial cells appear in the center of locules in 170 - 190 μm anthers, with the en and spl completely present by 250 μm; the secondary parietal layer divides to give rise to tapetum and ml between 600 and 750 μm; and meiosis begins around 2000 μm (Figure S6). Notably, cell division and expansion patterns matched between the two lines in young anthers (<750 μm) (Figure S6). After this stage epidermal cell width (X), height (Y), and cell count along the Y-axis were identical, but B73 had more columns in 900 μm through 1500 μm anthers. Likewise, endothecium height (Y), cells/column (Y-axis) and columns (X-axis) matched, but cell width was greater in B73 in 900 – 1500 μm anthers (Figure S6). This greater number of epidermal columns and greater girth of the same number of endothecial cells explain why B73 anthers have a greater circumference (“fatter” in the Z and X-axes). It is striking that the epidermis and endothecium accomplish this extra growth compared to W23 by different mechanisms – the epidermis uses G-anticlinal division while the endothecium employs anisotropic growth. These results suggest that the conclusions for W23 may be applicable to other maize lines, and confirm that individual cell types obey conserved developmental guidelines for growth.
The second analysis of time line consistency utilized upper and lower floret anthers of the W23 inbred. In each spikelet the upper floret is developmentally advanced by at least one day compared to the lower floret, making pre-meiotic, upper floret anthers about twice the length of their lower floret neighbors. Although both florets are fertile, floret-specific gene expression has been reported (Cacharron et al., 1999), and when the transcriptomes of 1 mm upper and lower florets were compared on a microarray, the expression of ∼10% of the transcripts differed (Skibbe et al., 2008). For that reason and the existence of some allele combinations that cause lower floret abortion, maize geneticists have avoided mixing upper and lower floret anthers when collecting samples for microarrays (Ma et al., 2008; Skibbe et al., 2008). We find, however, that the cellular growth parameters (division and expansion) tested in W23 lower floret epidermis, endothecium, and archesporial cells matched the upper florets (Figure S7). The fact that upper and lower floret anthers have identical developmental events and timing in all categories checked suggests that the hallmarks of anther development is robust to the variations in gene expression found between these florets and among various inbred lines.
Refutation of classical models of plant organ development
Intercalary meristem model
In an attempt to characterize anther development on a whole-organ scale, three classical models of organ development were explicitly tested: the intercalary meristem, the power of 2, and the growth wave. Organs that develop from meristems, such as maize leaves and roots, exhibit proximal-distal (P-D) polarity with respect to cell size, mitotic rate, and differentiation (Poethig, 1990), concentrating mitoses at their base. To test whether an intercalary meristem generates such zonation within anthers, cell size and mitotic frequency were evaluated from base to tip of intact W23 anthers. If a meristem were present, a zone of small, highly mitotic cells should subtend a zone of enlarged cells with lower mitotic frequency. No such gradient of cell size, mitotic rate, or morphology was detectable in anthers along the P-D axis (Y-axis) for any cell type. Cell size did not depend on the distance from the anther base by morphological examination (Figure 1D). Immature anthers were dissected from plants injected with 20 μM EdU for one of three intervals: 5 min, 3 h, 10 h, and 50 h. EdU-labeled cells were found in patches scattered around the anther in all cell types independent of position from the base in all stages examined (Figure 5A,B). Longer incubations resulted in a higher percentage of cells with EdU labeling, but after calculating the percentage of EdU-labeled cells in 100-μm segments (N = >50 cells per segment), no bias was detected along the P-D axis (although the tapered ends of anthers had fewer labeled cells) (Figure 5C, Figure S9B,C). These results confirm that no intercalary meristem exists, and suggest local rather than global regulation of mitotic events.
Power of two model
Rejecting the meristem model, we next tested whether anther development relies on a ‘power of 2’ model, in which successive rounds of synchronous cell division in every cell doubles the total cell count after each round. EdU analysis, along with other results presented above, definitively refutes this exponential model. None of our cell counts fit such exponential projections - the endothecium has a final count of 14 columns, an impossible outcome using the power of 2 model. To account for the possibility that some of the cells drop out of the cell cycle and stop dividing, immature anthers incubated in EdU for 50 h were checked for patches of non-dividing cells. Many such unlabeled patches were found in the endothecium, ml, and tapetum, at the highly mitotic stages of development when the average cell cycle duration is much shorter than 50 h, consistent with but not proving that cells stochastically cease mitosis (data not shown).
Waveform model
Next, we tested a model that was proposed to explain lily (Lilium longiflorum) anther development (Gould and Lord, 1988). The model proposed that, in the absence of a meristem, a growth wave was “the framework within which cell division, elongation, and differentiation must integrate”. The authors found that larger anthers had 2, sometimes 3 series of peaks and troughs in local growth rates by kinematic analysis of the separation of pairs of marked cells. By direct observation, mitosis and elongation patterns in the epidermis were interpreted as confirming the wave hypothesis. The limitations in this study were reliance on a single observation of growth per size category and use of partially dissected flowers with a damage-induced diminution of growth rate.
Maize anthers are too small for an accurate external marking experiment. Nonetheless, the wave theory would predict coherent, narrow zones of EdU-labeled cells after a short EdU incubation. Instead, anthers incubated for 5 min had EdU-labeled cells along the length of the anther in 30/30 anthers checked (data not shown), and the percentage of EdU-labeled cells was independent of the P-D axis and stage (Figure 5C, S9B,C). To further test the wave hypothesis, average epidermal cell length was calculated for 100-μm increments along a single 920 μm anther. Cell size was graduated from base to tip (N = >30 cells / increment), but the amplitude differences were not statistically significant (Figure 5E, S9A). The amplitudes of trends (not statistically significant cell size parameters) were very small compared to the waves reported by Gould and Lord (1988). Furthermore, in a particular 1400 μm anther there were no significant difference in epidermal cell length, although there were slight dips around 400-500 μm from the tip and 700-900 μm from the tip (Figure 5F). Upon further investigation of these segments, the cell size bias reflected a preponderance of small cells with scattered much larger cells, while other anther zones had patches of cells that all were either very large or very small (Figure 5F,G). Based on these analyses, we reject the waveform model.
Evidence for the “clustering” model
The clustering of patches of very small cells juxtaposed with patches of very large cells led us to the hypothesis that many developmental events in anthers could exhibit the same clustering effect, indicative of some localized synchrony among cells, perhaps among clonally-related cells. For example, we noted that during the periclinal division of the spl, cells that had already divided tended to be clustered, while those that had not gone through mitosis also clustered (data not shown). In addition, morphological examination of the ml and tapetum after their birth uncovered evidence of coordination between these two cell types. Groups of two or four ml cells are outlined in an 1125 μm anther (Figure 6H). In the same anther, the outlines perfectly overlay groups of two, four or eight tapetum cells (Figure 6I). From these images (which are representative of dozens of similar images), new cell walls built during anticlinal divisions of the ml and tapetum appear to be shared by both layers, although the tapetum seems to be about half a round of division ahead of the ml, as some clusters have equal numbers of cells while other clusters have twice as many tapetum cells (for a representative diagram showing both layers at once, see Figure 6J). The same phenomenon was observed in 900 – 1400 μm anthers, consistent with a model in which the ml and tapetum are coordinated from birth. It is possible that each spl cell is a developmental unit: after dividing periclinally, ml daughters maintain a continuous cell wall with tapetal neighbors after multiple rounds of division. This arrangement may be functionally important if a role of the ml is to coordinate and maintain the tapetum.
To test explicitly whether neighboring cells tended to proceed through development with greater synchrony than the anther as a whole, plants were injected with EdU every 4 h for two days, stained with PI and imaged. Because plants were re-injected with EdU 12 times, many cells were EdU-labeled, but depending on how recent the last S phase was, certain cells stained brighter than others. We assume that the brightest cells incorporated EdU during their most recent S phase but had yet to divide (meaning they were at the end of S, in G2, or at the start of M), while dimmer cells probably had divided and synthesized new DNA since their last EdU incorporation; dim or unlabeled cells were considered to have stopped DNA synthesis during the injection period. Because some blind injections may have missed the tassel, there could be 8 or 12 h between successive EdU deliveries. Regardless of how these bright, dim, and dark cells came to be, what is striking is that clustered groups of 2, 4, 8, and 16 tapetal cells share the same labeling intensity (Figure 6F,G). This suggests that clonally related groups of neighboring somatic cells have relatively synchronized cell cycles. Groups of 6, 10, and 12 were also observed in all cell types except the terminal stage of spl cells, suggesting that the more mitoses occur, the more asynchronous these groups become. No groups larger than 16 were observed.
To further test for clustering, the binucleation of the tapetum was re-analyzed (Figure 6E). Binucleate cells were more likely to have binucleate neighbors (Figure 6C), while uninucleate cells were more likely to have uninucleate neighbors (Figure 6D). Collectively these data indicate that there is local coordination of growth in the somatic wall of maize anthers. This local control is limited, never encompassing patches greater than 16 cells, a number suggestive of imposition at the time of cell fate setting, followed by up to 4 subsequent cell divisions.
Discussion
A critical question in development is how the balance of cell division, expansion, and differentiation contributes to the final form. To understand the connection between these cellular parameters and morphogenetic phenomena in the maize anther, quantitative data on temporal patterns of cell growth were used to model anther ontogeny from the constituent cells. We have shown that maize anther morphogenesis depends on subtle changes in cellular behaviors such as mitotic rate and anisotropic growth. We have shown that anther development is not steady - bursts of cell division are interspersed with periods of rapid cell expansion. The timing of key developmental events is now established for maize, and the discovery of cell type-specific pace and distribution of division and expansion indicates that organ morphology results from the separate trajectories of each tissue, including the ml, which had been thought to lack independent functions. These new datasets have also permitted a critical assessment of the lineage model of anther development, confirming some points and refuting others. Several new principles regulating anther growth are established, including the fact that anthers lack meristems and do not utilize growth waves, but that instead developmental events may be controlled locally in small developmental units.
Differences in germ line specification in plants and animals
In most animals, germ cell progenitors are specified during early embryogenesis, isolated from the soma and maintained until adult life, when germ cells mature during gametogenesis in a developmental gradient within the gonads (Ewen-Campen et al., 2009). While animals specify the germ-line early, angiosperms reprogram somatic cells into reproductive cells within the stamens and carpels; in corn, this specification occurs in the final mitotic populations in the plant. In most animals, sperm are produced continuously in the testis, and all stages of spermatogenesis can be found in the same testis simultaneously (Ewen-Campen et al., 2009). In plants this developmental gradient does not exist; instead, germ cells are specified from a group of ∼100 L2-d somatic cells in anther primordia rather than arising from an initial asymmetric division of a hypodermal cell as proposed in the lineage model. These archesporial cells proliferate asynchronously in a column within each locule and differentiate into pmc over several days. Then they initiate and complete meiosis and subsequent steps in pollen maturation synchronously such that all grains in an anther are mature at anthesis (Bhatt et al., 2001). If the germ cells developed using a gradient similar to leaves and roots, we would expect to see progressively older stages from base to tip; instead, all meiotic cells are at equivalent stages regardless of position on the y-axis. Synchrony might be achieved during meiosis by continuous cytoplasm connecting pmc cells through plasmodesmata (Heslop-Harrison, 1966; Kwiatkowska and Maszewski, 1986; Mamun et al., 2005).
Global and local regulation of anther development
Calculation of cell diameters and volumes indicates that each tissue expands using separate rules: epidermal cells are highly biased for length expansion, endothecial cells for girth expansion, ml cells are slightly biased for girth expansion, tapetal cells are slightly biased for radial expansion (Z-axis), and the archesporial cells have thin walls and are near spherical. Because cell volumes and mitotic rate of a cell type are similar along the entire length of the anther, these data rule out the presence of a meristem and instead require invoking distributive regulation at all points within the anther that modulate growth parameters. To produce an organ with smooth contours and no gaps or tears requires that tissue-specific patterns of expansion be coordinated. Mechanistically, one compensating mechanism that could help maintain shape is that each tissue has a particular pace and pattern of cell division. The product of expansion and division makes each tissue the appropriate dimension in the X-, Y- and Z-axes to fill the nested locular rings, with the epidermis being the largest in girth and length, followed by the endothecium, ml, tapetum, and archesporial cells. These correct dimensions could be achieved by feedback regulation of neighbor cell expansion on division within and between tissues.
To coordinate on an organ-level scale, Gould and Lord suggesting that a growth wave, possibly coordinated by auxin – flows from tip to base of each anther (Gould and Lord, 1988) to modulate growth sequentially along the length of the anther. We tested for this by observing the patterning of developmental events, such as tapetum binucleation and the periclinal division of the spl, and by carefully monitoring growth in segments along the length of the anther. Our data do not support a growth wave; instead, anthers proceed through developmental time-points stochastically, with no dependence on position along the length of the anther. We did uncover a new pattern involving a neighbor clustering effect. Tapetum binucleation tended to occur in patches, and groups of spl cells seemed to be proceeding through multiple anticlinal mitotic events in relative synchrony when we monitored EdU labeling intensity. Additionally, patches of very small cells can be adjacent to patches of very large cells, suggesting that the tempo of division and expansion is regulated in small, multicellular units; these could be clonal, tracing back to individual founding cells at the time of cell fate specification. The underlying mechanism could be retention of plasmodesmatal connectivity within the group, a topic for future investigation. In the Arabidopsis sepal epidermis, patches of small and giant (endopolyploid) cells are juxtaposed (Roeder et al., 2010). In this organ, progenitor cells either continue mitosis resulting in small cells, or once switching to S-phase without mitosis, groups of cells become enlarged and endopolyploid; the choice between these pathways appears to be random. Neither for the sepal epidermis nor for each of the maize anther locule tissues are there adequate explanations for how size polymorphism still permits the smooth growth of the organ.
We have also uncovered evidence of clustering and coordination between ml and tapetum cells. We identified pairs, quartets, and octets of tapetum cells that shared a border with 2 or 4 ml cells, such that if one traces the outline of these ml and tapetum clusters, the outlines overlap perfectly because of a continuous cell wall surrounding them (Figure 6H-J). This phenomenon was observed in anthers ranging in size from 900 – 1400 μm, representing the first evidence that even though these cell types have distinct shapes and mitotic rates, their development is coordinated at the local level. We hypothesize that these groups of ml and tapetum cells all share a common, single spl precursor, and that each spl cell and its derivatives functions as a developmental unit. An intriguing possibility is that each spl unit is assigned to assist the development of a single microspore into a pollen grain. Supporting this hypothesis is the fact that the time of tapetum and ml birth, there are ∼600 spl cells per anther locule; meanwhile there are ∼600 1N microspores per locule after meiosis.
Significance of cell division orientation and anisotropic growth in tissue function
Because there appear to be no morphogenetic cell movements in plants, the primary parameters that determine shape are the timing of cell division, the orientation of the cell division plane, and cell expansion. Because these are simultaneous and interrelated processes, they are difficult to separate experimentally (Poethig, 1986; Reynolds et al., 1998). Epidermal cells at anthesis (pollen shed) are 5 times as long as wide, which mirrors the overall shape of the anther. The endothecium, in contrast, is one of most extreme cases of anisotropic growth and division plane restriction seen in plants. It makes almost all new walls perpendicular to the primary growth axis. If one imagines cutting open a locule along the Y-axis and unrolling it until it lays flat, the epidermal layer would be 50 by 50 cells, reflecting an equal number of G- and L-anticlinal divisions from primordium onwards. Meanwhile the endothecium would be about 275 cells along the Y-axis, and 14 along the X. Endothecium must synthesize exceptionally long walls and conduct an unusual type of cell division to maintain wide cells of low depth in using just 14 every widening cells to accommodate increasing anther girth. This occurs despite the fact that in most growing plants a new cell wall usually is built as short as possible, as if the nascent wall “possessed the surface minimization properties of a fluid” (Dupuy et al., 2010).
The epidermis accomplishes most of such ‘long’ walls early in anther development while the cells are still small and closer to cuboidal in shape. But the endothecium constantly makes these long walls until long after meiosis. This suggests that generating this axial orthogonal array is highly significant to the anther. The flexural stiffness achieved by this array is reminiscent of strength built into the corpus cavernosum of rats and humans (Kelly, 2002). Like steel-belted radial tires, the differential reinforcement of adjacent cellular layers may increase the overall strength of the anther wall. This strength may be necessary to constrain anther girth and thus prevent rapidly expanding but individuated pollen grains from distorting anther shape.
Although each anther cell type has a typical shape, illustrating regularity in construction of new cell walls at right angles to pre-existing walls, the spl, ml, and more rarely the tapetum make diagonal anticlinal walls that do not meet at right angles to an existing wall. Another observation is that no divisions “out of plane” were observed for any differentiated cell type – no bumps or indents in mature cell layers were seen. Such divisions if they existed would result in a small zone with an extra somatic ring, which was never observed in fertile but is frequently seen in male sterile mutant anthers. Therefore periclinal divisions are restricted to transient L2-d cell types such as the spl. The spl is the most mitotically active in the anther at 500 – 700 μm, with a remarkably short cell cycle length for a eukaryote. We estimate that a given spl cell may divide up to three times daily, and this is the only cell type for which 100% participation in a particular cell division was inferred, by the uniform labeling of all spl cells at 550 μm followed by a single (terminal) periclinal division by each cell. Tapetal cells, ml cells, archesporial cells, and spl cells also exhibit a burst of mitotic activity upon their birth.
In many systems, symmetric divisions are standard fare during organogenesis, while asymmetric cell divisions (ACDs) are associated with cell fate specification and are restricted to predictable temporal and spatial domains. In plants, the root, embryo and leaf all use asymmetric cell divisions to specify cell identities (Carlsbecker et al., 2010; Lampard et al., 2008; Lukowitz et al., 2004). From our work we know that the two daughter layers of the spl (the tapetum and ml) assume different mitotic rates and expansion patterns soon after they are born, which suggests that an ACD determines the cell fate of the tapetum and ml. We found this to be false by histological examination of W23 inbred anthers. Initial t and ml cells are of equal dimensions. The bulls' eye arrangement of anther cell layers, with the tapetum and ml cells positioned between the archesporium and endothecium, is consistent with the hypothesis that, instead of an ACD, cell signaling from these differentiated layers is responsible for the acquisition of cell identity. The symmetry of the division does not exclude the possibility that the progenitor cells are already polarized in their Z-axis, such that an unknown morphogenetic factor is segregated unevenly between the daughter cells.
We find that the ml has a distinctive appearance and program of division and expansion, strongly arguing that it has its own identity and functions. This is new information, because early reports suggested that these cells never divided anticlinally (as viewed in transverse section) (Davis, 1966)), or that the ml is a relic feature with no function (Cheng, 1979). In maize the ml does divide anticlinally, although almost all of the division adds new cells along the Y-axis, which is not visible in cross-section, which explains the error in Davis, 1966. In shape, ml cells share characteristics with both endothecium and tapetum. Cells are wider than long like the endothecium, but retain a volume similar to tapetal cells. The primary characteristic of ml cells is that they never develop secondary wall thickenings and after meiosis starts they rapidly thin until degradation. This senescence could add to the cell wall density along the inner edge of the endothecium, adding strength. Perhaps the ml helps set up radial polarity cues for the tapetum, a hypothesis supported by the fact that the ml cells tend to perfectly overlay pairs or quartets of tapetal cells (Figure 6H-J).
The tapetum has been the focus of many studies, concentrating on its role in pollen maturation. In many ways the tapetum resembles its progenitor, the secondary parietal layer – similar shape with rounded corners, size, high mitotic rate, and positioning next to the archesporial cells. Two male-sterile mutants of maize also illustrate that tapetal cells must be repressed from acting like the spl: in ms23 and ms32 newly derived tapetal cells divide periclinally, generating an extra somatic ring around the archesporial cells (Chaubal, 2000). These cells do not differentiate with tapetal characteristics or functions, and meiosis arrests early. Other sterile mutants such as ms9 and ms13 have extra anticlinal but not periclinal ml and tapetum divisions, suggesting periclinal and anticlinal divisions are independently controlled. In normal tapetal cells, binucleation starts several days later than the aberrant periclinal division (data not shown), and hence this binucleation is probably controlled separately from the suppression of periclinal divisions.
Conclusions
Exploiting the relatively large size and ease of dissection of maize anthers, we generated a detailed spatio-temporal description of tissue ontogeny in this organ. Cell shape dimensions and volumes combined with EdU labeling to track DNA synthesis were used to determine how cell expansion and division contribute to anther growth in each tissue. Strikingly, tissues each exhibited a distinctive pace and direction of mitotic proliferation as well as distinctive anisotropic expansion. From these data most conventional models of plant organ development were refuted, and a new model that accounts for the coordination of growth in anther length and girth is proposed. Future work could concentrate on the influence of cell lineage and / or cell-cell communication with neighbors determines cell fate. Is parentage the most important factor, or do most cells maintain developmental plasticity until final positions are established? Future work could also resolve how anthers integrate five distinct cellular programs, while keeping the growth of the whole organ “smooth” with no breaks or tears.
Manuscript DBIO-10-631R1 Research Highlights.
In this study, we sought to better understand wild type maize anther development using 3D confocal imaging. Specifically, we wanted to establish the order of emergence of the cell layers and to test common developmental models on anthers to try to explain the nature of their ontogeny.
We developed an effective staining protocol for the first three-dimensional imaging of maize anthers.
We presented the first timeline documenting the order of emergence of all locular cell types, including somatic and reproductive tissues.
Despite the dearth in knowledge about the cell fate-setting period of development, the “lineage” model, which accounts for the origin of the cell layers, has dominated the literature since the early half of the last century, and most people who study anthers assume that it is correct. However, there has never been any direct evidence for it in any species, and we have always had trouble imagining how it would fit with reality. We confirmed the later parts of the lineage model, but then presented the first evidence that directly contradicts inferences made in the early part of the model.
While developing the timeline, we realized that each cell type from its inception has a distinct pattern of cell division and anisotropic cell expansion.
We developed an effective injection and staining protocol for EdU-labeling anthers to monitor the rate and pattern of cell division.
We tested three whole-organ models of plant organ growth and established that anthers do not develop from intercalary meristems like roots and leaves, from growth waves, or from a “power of 2” model.
Based on numerous lines of evidence we hypothesized that anther development is in part controlled by the coordinated efforts of localized clusters of cells acting as developmental units.
We feel that the data presented here are of general interest to the readers of Developmental Biology and provide a foundation for future work in plant reproduction.
Best regards,
Virginia Walbot and Timothy Kelliher
Supplementary Material
Figure S1. Endothecial and secondary parietal layer differentiation. (A) The cells positioned to be the endothecium and spl begin with the same dimensions, including width (along X-axis), but they quickly differentiate as different cell types. The endothecium gets longer in the X-axis by restricting G-anticlinal divisions, while the spl has no restrictions on division and remains cuboidal. (B) The differences in endothecium and spl are shown in the X-axis in Figure 2C and 2D, but this image shows the differences in the length of their Y- and Z-axes. Scale bar = 20 mm.
Figure S2. Meiosis is synchronous in anthers. (A) Dyad stage after meiosis I. (B) Tetrad stage after meiosis II. (C) Quartet stage. Scale bar = 20 mm.
Figure S3. Archesporial cell mitotic proliferation. (A) EdU-labeled archesporial cell (arrow) in a 335 mm anther after a 4 h EdU incubation. (B) Merged PI and EdU image of 400 mm anther after 4 hour EdU incubation, with Edu-labeled archesporial cells (arrows). (C) Merged image of 900 mm anther with no EdU-labeled archesporial cells. (D) Merged image of 1100 mm anther with no EdU-labeled archesporial cells. (E) Merged image of 1400 mm anther with no EdU-labeled archesporial cells. Scale bar = 20 mm.
Figure S4. Endothecium and epidermis have distinct developmental programs. (A, B) Two locules of a 600 mm anther showing epidermis (A) and endothecium (B) with opposite long axes. The epidermis is long in the Y-axis while the endothecium is long in the X-axis. (C, D) 1400 mm anther injected with EdU for 4 hours. While zero epidermis cells are Edu-labeled (C), the endothecium has a few cells that are labeled (D), indicating that the endothecium is still cycling while the epidermis is not. Scale bar = 20 mm.
Figure S5. 1400 mm anther with middle layer and tapetum. The middle layer is brick or trapezoidal shaped with several vacuoles towards the periphery, while the tapetum is cuboidal with no vacuoles visible. Scale bar = 20 mm.
Figure S6. Asymmetric cell division is not utilized in the periclinal division of the spl in W23 anthers. Cellular dimensions of middle layer and tapetum cells just after their birth. Only anthers that had some spl and some ml + t (a result of a recent division of a secondary parietal cell) were used for cell sizing. N = 30+ cells for each category.
Figure S7. B73 mirrors W23 cellular development in the anther. Each mark represents the average of dozens of measurements made on at least 5 anthers from at least 3 W23 and 3 B73 individuals. The only categories where the difference between B73 and W23 was significantly more than the standard deviation was epidermis cell count (X) and Endothecium cell width (X), but these differences show that B73 uses two different mechanisms for achieving greater girth than W23 – in the Endothecium its cells expand in the X more, while in the epidermis its cells divide to add more columns.
Figure S8. The cellular parameters of anther development are consistent among upper and lower florets. Each mark represents dozens of measurements made on a single anther. Lower and upper floret anthers were dissected from the same 5 field grown W23 plants. Lower floret anthers were taken from larger spikelets than upper floret anthers so that the sizes matched.
Figure S9. (A) Endothecial cell width in an 800 mm anther is constant from base to tip. Each bar is an average of 30+ measurements. (B) EdU incorporation rate is constant from base to tip in a 500 mm anther. Although there was a small spike in endothecium and epidermis EdU labeling in the 100-200 mm segment of this anther, it was not significant enough to be considered a meristem, and it probably is random variation. (C) EdU incorporation rate is constant from base to tip in a 500 mm anther. Though the upper half of the anther had more spl EdU-labeled cells than the lower half, this may be a result of stochastic variation. There is no region of the anther along the Y axis that incorporates more EdU consistently, which is consistent with the model in which development takes place without a discrete meristem.
Acknowledgments
We thank Gunther Doehlemann and David Skibbe for the PI protocol. We thank the Carnegie Institution, Department of Plant Biology Imaging Facility for use of the SP5 confocal microscope, and Dave Ehrhardt for microscope training and advice. We thank Dominque Bergmann, Mary Beth Mudgett, and David Skibbe for critiquing a draft manuscript. Research was supported by a grant from the National Science Foundation (PGRP 07-01880) to V. Walbot and Z. Cande; T. K. was supported in part by the NIH Biotechnology Training Grant (5-T32-GM008412-17).
Footnotes
Publisher's Disclaimer: This is a PDF file of an unedited manuscript that has been accepted for publication. As a service to our customers we are providing this early version of the manuscript. The manuscript will undergo copyediting, typesetting, and review of the resulting proof before it is published in its final citable form. Please note that during the production process errors may be discovered which could affect the content, and all legal disclaimers that apply to the journal pertain.
References
- Bedinger PA, Fowler JE. The Maize Male Gametophyte. Handbook of Maize: Its Biology 2009 [Google Scholar]
- Benfey PN, Schiefelbein JW. Getting to the root of plant development: the genetics of Arabidopsis root formation. Trends Genet. 1994;10:84–8. doi: 10.1016/0168-9525(94)90230-5. [DOI] [PubMed] [Google Scholar]
- Bennett MD. The Duration of Meiosis. Proceedings of the Royal Society of London Series B, Biological Sciences. 1971;178:277–299. [Google Scholar]
- Bennett MD. The time and duration of meiosis. Philos Trans R Soc Lond B Biol Sci. 1977;277:201–26. doi: 10.1098/rstb.1977.0012. [DOI] [PubMed] [Google Scholar]
- Bhatt AM, Canales C, Dickinson HG. Plant meiosis: the means to 1N. Trends Plant Sci. 2001;6:114–21. doi: 10.1016/s1360-1385(00)01861-6. [DOI] [PubMed] [Google Scholar]
- Boavida LC, Becker JD, Feijo JA. The making of gametes in higher plants. Int J Dev Biol. 2005;49:595–614. doi: 10.1387/ijdb.052019lb. [DOI] [PubMed] [Google Scholar]
- Cacharron J, Saedler H, Theissen G. Expression of MADS box genes ZMM8 and ZMM14 during inflorescence development of Zea mays discriminates between the upper and the lower floret of each spikelet. Development Genes and Evolution. 1999;209:411–420. doi: 10.1007/s004270050271. [DOI] [PubMed] [Google Scholar]
- Canales C, Bhatt AM, Scott R, Dickinson H. EXS, a putative LRR receptor kinase, regulates male germline cell number and tapetal identity and promotes seed development in Arabidopsis. Curr Biol. 2002;12:1718–27. doi: 10.1016/s0960-9822(02)01151-x. [DOI] [PubMed] [Google Scholar]
- Carlsbecker A, Lee JY, Roberts CJ, Dettmer J, Lehesranta S, Zhou J, Lindgren O, Moreno-Risueno MA, Vaten A, Thitamadee S, Campilho A, Sebastian J, Bowman JL, Helariutta Y, Benfey PN. Cell signalling by microRNA165/6 directs gene dose-dependent root cell fate. Nature. 2010;465:316–21. doi: 10.1038/nature08977. [DOI] [PMC free article] [PubMed] [Google Scholar]
- Casati P, Walbot V. Rapid transcriptome responses of maize (Zea mays) to UV-B in irradiated and shielded tissues. Genome Biology. 2004;5 doi: 10.1186/gb-2004-5-3-r16. [DOI] [PMC free article] [PubMed] [Google Scholar]
- Chaubal R. Two male-sterile mutants of Zea mays (Poaceae) with an extra cell division in the anther wall. American Journal of Botany. 2000;87:1193–1201. [PubMed] [Google Scholar]
- Chaubal R, Anderson JR, Trimnell MR, Fox TW, Albertsen MC, Bedinger P. The transformation of anthers in the msca1 mutant of maize. Planta. 2003;216:778–88. doi: 10.1007/s00425-002-0929-8. [DOI] [PubMed] [Google Scholar]
- Cheng PC, Greyson RI, Walden DB. Comparison of anther development in genic male-sterile (ms10) and in male-fertile corn (Zea mays) from light microscopy and scanning electron microscopy. Canadian Journal of Botany. 1979;57:578–596. [Google Scholar]
- Cheng PC, Greyson RI, Walden DB. Organ initiation and the development of unisexual flowers in the tassels and ear of Zea mays. American Journal of Botany. 1983;70:450–462. [Google Scholar]
- Davis GL. Systematic Embryology of the Angiosperms. New York: Wiley; 1966. [Google Scholar]
- Dawe RK, Freeling M. Clonal analysis of the cell lineages in the male flower of maize. Dev Biol. 1990;142:233–45. doi: 10.1016/0012-1606(90)90167-h. [DOI] [PubMed] [Google Scholar]
- Dawe RK, Freeling M. The role of initial cells in maize anther morphogenesis. Development. 1992;116:1077–85. doi: 10.1242/dev.116.4.1077. [DOI] [PubMed] [Google Scholar]
- Dong J, MacAlister CA, Bergmann DC. BASL controls asymmetric cell division in Arabidopsis. Cell. 2009;137:1320–30. doi: 10.1016/j.cell.2009.04.018. [DOI] [PMC free article] [PubMed] [Google Scholar]
- Dupuy L, Mackenzie J, Haseloff J. Coordination of plant cell division and expansion in a simple morphogenetic system. Proc Natl Acad Sci U S A. 2010;107:2711–6. doi: 10.1073/pnas.0906322107. [DOI] [PMC free article] [PubMed] [Google Scholar]
- Emlen DJ, Corley Lavine L, Ewen-Campen B. On the origin and evolutionary diversification of beetle horns. Proc Natl Acad Sci U S A. 2007;104 1:8661–8. doi: 10.1073/pnas.0701209104. [DOI] [PMC free article] [PubMed] [Google Scholar]
- Erickson RO. Cytological and Growth Correlations in the Flower Bud and Anther of Lilium longiflorum. American Journal of Botany. 1948;35:729–739. [Google Scholar]
- Ewen-Campen B, Schwager EE, Extavour CG. The molecular machinery of germ line specification. Mol Reprod Dev. 2009;77:3–18. doi: 10.1002/mrd.21091. [DOI] [PubMed] [Google Scholar]
- Feijo JA, Cox G. Visualization of meiotic events in intact living anthers by means of two-photon microscopy. Micron. 2001;32:679–84. doi: 10.1016/s0968-4328(00)00097-4. [DOI] [PubMed] [Google Scholar]
- Feijo JA, Moreno N. Imaging plant cells by two-photon excitation. Protoplasma. 2004;223:1–32. doi: 10.1007/s00709-003-0026-2. [DOI] [PubMed] [Google Scholar]
- Feng X, Dickinson HG. Packaging the male germline in plants. Trends Genet. 2007;23:503–10. doi: 10.1016/j.tig.2007.08.005. [DOI] [PubMed] [Google Scholar]
- Feng X, Dickinson HG. Tapetal cell fate, lineage and proliferation in the Arabidopsis anther. Development. 2010;137:2409–16. doi: 10.1242/dev.049320. [DOI] [PubMed] [Google Scholar]
- Goldberg RB, Beals TP, Sanders PM. Anther development - basic principles and practical applications. Plant Cell. 1993;5:1217–1229. doi: 10.1105/tpc.5.10.1217. [DOI] [PMC free article] [PubMed] [Google Scholar]
- Gould K, Lord EM. Growth of anthers in Lilium longiflorum. Planta. 1988;173:161–171. doi: 10.1007/BF00403007. [DOI] [PubMed] [Google Scholar]
- Hamant O, Ma H, Cande WZ. Genetics of meiotic prophase I in plants. Annu Rev Plant Biol. 2006;57:267–302. doi: 10.1146/annurev.arplant.57.032905.105255. [DOI] [PubMed] [Google Scholar]
- Heslop-Harrison Cytoplasmic connections between angiosperm meiocytes. Ann Bot. 1966;30:221–230. [Google Scholar]
- Irish VF. Petal and stamen development. Current Topics in Developmental Biology, Vol 41. 1999;41:133–161. doi: 10.1016/s0070-2153(08)60272-0. [DOI] [PubMed] [Google Scholar]
- Ivanov V, Dubrovsky JG. Estimation of the cell-cycle duration in the root apical meristem: A model of linkage between cell-cycle duration, Rate of cell production, and rate of root growth. International Journal of Plant Sciences. 1997;158:757–763. [Google Scholar]
- Kelly DA. The functional morphology of penile erection: Tissue designs for increasing and maintaining stiffness. Integ and Comp Biol. 2002:216–221. doi: 10.1093/icb/42.2.216. [DOI] [PubMed] [Google Scholar]
- Kessler S, Seiki S, Sinha N. Xcl1 causes delayed oblique periclinal cell divisions in developing maize leaves, leading to cellular differentiation by lineage instead of position. Development. 2002;129:1859–69. doi: 10.1242/dev.129.8.1859. [DOI] [PubMed] [Google Scholar]
- Kiesselbach TA. The structure and reproduction of corn. Cold Spring Harbor Laboratory Press; 1949. [Google Scholar]
- Kirpes CC, Clark LG, Nels RL. Systematic significance of pollen arrangement in microsporangia of Poaceae and Cyperaceae: Review and observations on representative taxa. American Journal of Botany. 1996;83:1609–1622. [Google Scholar]
- Koltunow AM, Truettner J, Cox KH, Wallroth M, Goldberg RB. Different Temporal and Spatial Gene Expression Patterns Occur during Anther Development. Plant Cell. 1990;2:1201–1224. doi: 10.1105/tpc.2.12.1201. [DOI] [PMC free article] [PubMed] [Google Scholar]
- Kotogany E, Dudits D, Horvath GV, Ayaydin F. A rapid and robust assay for detection of S-phase cell cycle progression in plant cells and tissues by using ethynyl deoxyuridine. Plant Methods. 2010;6:5. doi: 10.1186/1746-4811-6-5. [DOI] [PMC free article] [PubMed] [Google Scholar]
- Kwiatkowska M, Maszewski J. Changes in the occurrence and ultrastructure of plasmodesmata in antheridia of Chara-vulgaris L during different stages of spermatogenesis. Protoplasma. 1986;132:179–188. [Google Scholar]
- Lampard GR, Macalister CA, Bergmann DC. Arabidopsis stomatal initiation is controlled by MAPK-mediated regulation of the bHLH SPEECHLESS. Science. 2008;322:1113–6. doi: 10.1126/science.1162263. [DOI] [PubMed] [Google Scholar]
- Lukowitz W, Roeder A, Parmenter D, Somerville C. A MAPKK kinase gene regulates extra-embryonic cell fate in Arabidopsis. Cell. 2004;116:109–19. doi: 10.1016/s0092-8674(03)01067-5. [DOI] [PubMed] [Google Scholar]
- Ma J, Duncan D, Morrow DJ, Fernandes J, Walbot V. Transcriptome profiling of maize anthers using genetic ablation to analyze pre-meiotic and tapetal cell types. Plant J. 2007;50:637–48. doi: 10.1111/j.1365-313X.2007.03074.x. [DOI] [PubMed] [Google Scholar]
- Ma J, Skibbe DS, Fernandes J, Walbot V. Male reproductive development: gene expression profiling of maize anther and pollen ontogeny. Genome Biol. 2008;9:R181. doi: 10.1186/gb-2008-9-12-r181. [DOI] [PMC free article] [PubMed] [Google Scholar]
- Mamun EA, Cantrill LC, Overall RL, Sutton BG. Cellular organisation and differentiation of organelles in pre-meiotic rice anthers. Cell Biol Int. 2005;29:792–802. doi: 10.1016/j.cellbi.2005.05.009. [DOI] [PubMed] [Google Scholar]
- Mizuno S, Osakabe Y, Maruyama K, Ito T, Osakabe K, Sato T, Shinozaki K, Yamaguchi-Shinozaki K. Receptor-like protein kinase 2 (RPK 2) is a novel factor controlling anther development in Arabidopsis thaliana. Plant J. 2007;50:751–66. doi: 10.1111/j.1365-313X.2007.03083.x. [DOI] [PubMed] [Google Scholar]
- Nonomura K, Miyoshi K, Eiguchi M, Suzuki T, Miyao A, Hirochika H, Kurata N. The MSP1 gene is necessary to restrict the number of cells entering into male and female sporogenesis and to initiate anther wall formation in rice. Plant Cell. 2003;15:1728–39. doi: 10.1105/tpc.012401. [DOI] [PMC free article] [PubMed] [Google Scholar]
- Osborn TC, Pires JC, Birchler JA, Auger DL, Chen ZJ, Lee HS, Comai L, Madlung A, Doerge RW, Colot V, Martienssen RA. Understanding mechanisms of novel gene expression in polyploids. Trends Genet. 2003;19:141–7. doi: 10.1016/s0168-9525(03)00015-5. [DOI] [PubMed] [Google Scholar]
- Poethig RS. Phase change and the regulation of shoot morphogenesis in plants. Science. 1990;250:923–30. doi: 10.1126/science.250.4983.923. [DOI] [PubMed] [Google Scholar]
- Poethig RS, Coe EH, Johri MM. Cell Lineage Patterns in Maize Embryogenesis: A Clonal Analysis. Developmental Biology. 1986;117:392–404. [Google Scholar]
- Reynolds JO, Eisses JF, Sylvester AW. Balancing division and expansion during maize leaf morphogenesis: analysis of the mutant, warty-1. Development. 1998;125:259–68. doi: 10.1242/dev.125.2.259. [DOI] [PubMed] [Google Scholar]
- Roeder AH, Chickarmane V, Cunha A, Obara B, Manjunath BS, Meyerowitz EM. Variability in the control of cell division underlies sepal epidermal patterning in Arabidopsis thaliana. PLoS Biol. 2010;8:e1000367. doi: 10.1371/journal.pbio.1000367. [DOI] [PMC free article] [PubMed] [Google Scholar]
- Saffman EE, Lasko P. Germline development in vertebrates and invertebrates. Cell Mol Life Sci. 1999;55:1141–63. doi: 10.1007/s000180050363. [DOI] [PMC free article] [PubMed] [Google Scholar]
- Salic A, Mitchison TJ. A chemical method for fast and sensitive detection of DNA synthesis in vivo. Proc Natl Acad Sci U S A. 2008;105:2415–20. doi: 10.1073/pnas.0712168105. [DOI] [PMC free article] [PubMed] [Google Scholar]
- Schnable PS, Ware D, Fulton RS, Stein JC, Wei F, Pasternak S, Liang C, Zhang J, Fulton L, Graves TA, Minx P, Reily AD, Courtney L, Kruchowski SS, Tomlinson C, Strong C, Delehaunty K, Fronick C, Courtney B, Rock SM, Belter E, Du F, Kim K, Abbott RM, Cotton M, Levy A, Marchetto P, Ochoa K, Jackson SM, Gillam B, Chen W, Yan L, Higginbotham J, Cardenas M, Waligorski J, Applebaum E, Phelps L, Falcone J, Kanchi K, Thane T, Scimone A, Thane N, Henke J, Wang T, Ruppert J, Shah N, Rotter K, Hodges J, Ingenthron E, Cordes M, Kohlberg S, Sgro J, Delgado B, Mead K, Chinwalla A, Leonard S, Crouse K, Collura K, Kudrna D, Currie J, He R, Angelova A, Rajasekar S, Mueller T, Lomeli R, Scara G, Ko A, Delaney K, Wissotski M, Lopez G, Campos D, Braidotti M, Ashley E, Golser W, Kim H, Lee S, Lin J, Dujmic Z, Kim W, Talag J, Zuccolo A, Fan C, Sebastian A, Kramer M, Spiegel L, Nascimento L, Zutavern T, Miller B, Ambroise C, Muller S, Spooner W, Narechania A, Ren L, Wei S, Kumari S, Faga B, Levy MJ, McMahan L, Van Buren P, Vaughn MW, Ying K, Yeh CT, Emrich SJ, Jia Y, Kalyanaraman A, Hsia AP, Barbazuk WB, Baucom RS, Brutnell TP, Carpita NC, Chaparro C, Chia JM, Deragon JM, Estill JC, Fu Y, Jeddeloh JA, Han Y, Lee H, Li P, Lisch DR, Liu S, Liu Z, Nagel DH, McCann MC, SanMiguel P, Myers AM, Nettleton D, Nguyen J, Penning BW, Ponnala L, Schneider KL, Schwartz DC, Sharma A, Soderlund C, Springer NM, Sun Q, Wang H, Waterman M, Westerman R, Wolfgruber TK, Yang L, Yu Y, Zhang L, Zhou S, Zhu Q, Bennetzen JL, Dawe RK, Jiang J, Jiang N, Presting GG, Wessler SR, Aluru S, Martienssen RA, Clifton SW, McCombie WR, Wing RA, Wilson RK. The B73 maize genome: complexity, diversity, and dynamics. Science. 2009;326:1112–5. doi: 10.1126/science.1178534. [DOI] [PubMed] [Google Scholar]
- Scott RJ, Spielman M, Dickinson HG. Stamen structure and function. Plant Cell. 2004;16 Suppl:S46–60. doi: 10.1105/tpc.017012. [DOI] [PMC free article] [PubMed] [Google Scholar]
- Sheridan WF, Golubeva EA, Abrhamova LI, Golubovskaya IN. The mac1 mutation alters the developmental fate of the hypodermal cells and their cellular progeny in the maize anther. Genetics. 1999;153:933–41. doi: 10.1093/genetics/153.2.933. [DOI] [PMC free article] [PubMed] [Google Scholar]
- Skibbe DS, Wang X, Borsuk LA, Ashlock DA, Nettleton D, Schnable PS. Floret-specific differences in gene expression and support for the hypothesis that tapetal degeneration of Zea mays L. occurs via programmed cell death. J Genet Genomics. 2008;35:603–16. doi: 10.1016/S1673-8527(08)60081-8. [DOI] [PubMed] [Google Scholar]
- Sorensen A, Guerineau F, Canales-Holzeis C, Dickinson HG, Scott RJ. A novel extinction screen in Arabidopsis thaliana identifies mutant plants defective in early microsporangial development. Plant J. 2002;29:581–94. doi: 10.1046/j.0960-7412.2001.01240.x. [DOI] [PubMed] [Google Scholar]
- Sun F, Kozak G, Scott S, Trpkov K, Ko E, Mikhaail-Philips M, Bestor TH, Moens P, Martin RH. Meiotic defects in a man with non-obstructive azoospermia: case report. Hum Reprod. 2004;19:1770–3. doi: 10.1093/humrep/deh335. [DOI] [PubMed] [Google Scholar]
- Tranel D, Perdomo A, Knapp A. Tassel development events leading to pollen production: A timeline. Maydica. 2008;53:207–216. [Google Scholar]
- Tsou Chih-hua. Study of maize male floral anthesis by croy-SEM. 52nd Annual Maize Genetics Conference.2010. [Google Scholar]
- Walbot V. On the life strategies of plants and animals. Trends in Genetics. 1985;1:165–169. [Google Scholar]
- Walbot V, Evans MM. Unique features of the plant life cycle and their consequences. Nat Rev Genet. 2003;4:369–79. doi: 10.1038/nrg1064. [DOI] [PubMed] [Google Scholar]
- Wang D, Oses-Prieto JA, Li KH, Fernandes JF, Burlingame AL, Walbot V. The male sterile 8 mutation of maize disrupts the temporal progression of the transcriptome and results in the mis-regulation of metabolic functions. Plant J. 2010 doi: 10.1111/j.1365-313X.2010.04294.x. [DOI] [PMC free article] [PubMed] [Google Scholar]
- Wilson ZA, Zhang DB. From Arabidopsis to rice: pathways in pollen development. Journal of Experimental Botany. 2009;60:1479–1492. doi: 10.1093/jxb/erp095. [DOI] [PubMed] [Google Scholar]
- Yang SL, Jiang L, Puah CS, Xie LF, Zhang XQ, Chen LQ, Yang WC, Ye D. Overexpression of TAPETUM DETERMINANT1 alters the cell fates in the Arabidopsis carpel and tapetum via genetic interaction with excess microsporocytes1/extra sporogenous cells. Plant Physiol. 2005;139:186–91. doi: 10.1104/pp.105.063529. [DOI] [PMC free article] [PubMed] [Google Scholar]
- Yang SL, Xie LF, Mao HZ, Puah CS, Yang WC, Jiang L, Sundaresan V, Ye D. Tapetum determinant1 is required for cell specialization in the Arabidopsis anther. Plant Cell. 2003;15:2792–804. doi: 10.1105/tpc.016618. [DOI] [PMC free article] [PubMed] [Google Scholar]
- Zhao D. Control of anther cell differentiation: a teamwork of receptor-like kinases. Sex Plant Reprod. 2009;22:221–8. doi: 10.1007/s00497-009-0106-3. [DOI] [PubMed] [Google Scholar]
- Zhu QH, Ramm K, Shivakkumar R, Dennis ES, Upadhyaya NM. The anther indehiscence1 gene encoding a single MYB domain protein is involved in anther development in rice. Plant Physiol. 2004;135:1514–25. doi: 10.1104/pp.104.041459. [DOI] [PMC free article] [PubMed] [Google Scholar]
Associated Data
This section collects any data citations, data availability statements, or supplementary materials included in this article.
Supplementary Materials
Figure S1. Endothecial and secondary parietal layer differentiation. (A) The cells positioned to be the endothecium and spl begin with the same dimensions, including width (along X-axis), but they quickly differentiate as different cell types. The endothecium gets longer in the X-axis by restricting G-anticlinal divisions, while the spl has no restrictions on division and remains cuboidal. (B) The differences in endothecium and spl are shown in the X-axis in Figure 2C and 2D, but this image shows the differences in the length of their Y- and Z-axes. Scale bar = 20 mm.
Figure S2. Meiosis is synchronous in anthers. (A) Dyad stage after meiosis I. (B) Tetrad stage after meiosis II. (C) Quartet stage. Scale bar = 20 mm.
Figure S3. Archesporial cell mitotic proliferation. (A) EdU-labeled archesporial cell (arrow) in a 335 mm anther after a 4 h EdU incubation. (B) Merged PI and EdU image of 400 mm anther after 4 hour EdU incubation, with Edu-labeled archesporial cells (arrows). (C) Merged image of 900 mm anther with no EdU-labeled archesporial cells. (D) Merged image of 1100 mm anther with no EdU-labeled archesporial cells. (E) Merged image of 1400 mm anther with no EdU-labeled archesporial cells. Scale bar = 20 mm.
Figure S4. Endothecium and epidermis have distinct developmental programs. (A, B) Two locules of a 600 mm anther showing epidermis (A) and endothecium (B) with opposite long axes. The epidermis is long in the Y-axis while the endothecium is long in the X-axis. (C, D) 1400 mm anther injected with EdU for 4 hours. While zero epidermis cells are Edu-labeled (C), the endothecium has a few cells that are labeled (D), indicating that the endothecium is still cycling while the epidermis is not. Scale bar = 20 mm.
Figure S5. 1400 mm anther with middle layer and tapetum. The middle layer is brick or trapezoidal shaped with several vacuoles towards the periphery, while the tapetum is cuboidal with no vacuoles visible. Scale bar = 20 mm.
Figure S6. Asymmetric cell division is not utilized in the periclinal division of the spl in W23 anthers. Cellular dimensions of middle layer and tapetum cells just after their birth. Only anthers that had some spl and some ml + t (a result of a recent division of a secondary parietal cell) were used for cell sizing. N = 30+ cells for each category.
Figure S7. B73 mirrors W23 cellular development in the anther. Each mark represents the average of dozens of measurements made on at least 5 anthers from at least 3 W23 and 3 B73 individuals. The only categories where the difference between B73 and W23 was significantly more than the standard deviation was epidermis cell count (X) and Endothecium cell width (X), but these differences show that B73 uses two different mechanisms for achieving greater girth than W23 – in the Endothecium its cells expand in the X more, while in the epidermis its cells divide to add more columns.
Figure S8. The cellular parameters of anther development are consistent among upper and lower florets. Each mark represents dozens of measurements made on a single anther. Lower and upper floret anthers were dissected from the same 5 field grown W23 plants. Lower floret anthers were taken from larger spikelets than upper floret anthers so that the sizes matched.
Figure S9. (A) Endothecial cell width in an 800 mm anther is constant from base to tip. Each bar is an average of 30+ measurements. (B) EdU incorporation rate is constant from base to tip in a 500 mm anther. Although there was a small spike in endothecium and epidermis EdU labeling in the 100-200 mm segment of this anther, it was not significant enough to be considered a meristem, and it probably is random variation. (C) EdU incorporation rate is constant from base to tip in a 500 mm anther. Though the upper half of the anther had more spl EdU-labeled cells than the lower half, this may be a result of stochastic variation. There is no region of the anther along the Y axis that incorporates more EdU consistently, which is consistent with the model in which development takes place without a discrete meristem.


