

Abstract
Purpose
We investigated the putative surrogate endpoints (PSEs) of best response (BR), complete response (CR), confirmed response (CoR), and progression-free survival (PFS) for associations with Overall Survival (OS), and as possible surrogate endpoints for OS.
Methods
Individual patient (pt) data from 870 untreated ES-SCLC pts participating in 6 single-arm (274 pts) and 3 randomized trials (596 pts) were pooled. Patient-level associations between PSEs and OS were assessed by Cox models using landmark analyses. Trial-level surrogacy of PSEs assessed by the association of treatment effects on OS and individual PSEs. Trial-level surrogacy measures included: R2 from weighted least squares regression model (WLS R2), Spearman's correlation coefficient, and R2 from bivariate survival model (Copula R2).
Results
Median OS and PFS were 9.6 (95% CI: 9.1-10.0) and 5.5 (95% CI: 5.2-5.9) months, respectively; BR, CR, and CoR rates were 44%, 22%, and 34%, respectively. Patient-level associations showed that PFS status at 4 months was a strong predictor of subsequent survival (HR=0.42 (95% CI: 0.35-0.51); concordance index=0.63; p<0.01), with 6-month PFS being the strongest (HR=0.41 (95% CI: 0.35-0.49); concordance index=0.66; p<0.01). At the trial-level, PFS showed the highest level of surrogacy for OS (WLS R2=0.79; Copula R2=0.80), explaining 79% of the variance in OS. Tumor response endpoints showed lower surrogacy levels (WLS R2≤0.48).
Conclusion
PFS was strongly associated with OS at both the patient and trial-level. PFS also shows promise as a potential surrogate for OS, but further validation is needed using data from a larger number of randomized phase III trials.
Keywords: extensive-stage small cell lung cancer, surrogate endpoints, pooled analysis, progression-free survival, tumor response
Introduction
In 2009, lung cancer was expected to cause 159,390 deaths within the United States.1 About 14% of lung cancer patients have small cell lung cancer (SCLC).2 Patients with tumors that have metastasized beyond the ipsilateral supraclavicular lymph nodes have extensive-stage disease (ES-SCLC).3 With currently available treatment, the median survival is around 9-11 months.4, 5
Overall Survival (OS) is the “gold standard” for oncology clinical trials, including ES-SCLC, because 1) it is definitive with respect to the disease process, 2) it is well defined with no room for subjectivity, and 3) importantly, it reflects the ultimate goal for developing a new regimen. However, OS requires longer follow-up in ES-SCLC and second-line therapies, (e.g. topotecan6) can make ascertainment of the true survival effect of a drug in the first-line setting difficult. Therefore, it is important to investigate whether other clinical endpoints that are more direct indicators of a drug's effectiveness, such as tumor response or progression-free survival (PFS), can accurately and reliably predict OS, and potentially be used in place of OS as the primary endpoint in Phase II or III clinical trials. Clearly, these endpoints are unaffected by subsequent therapy and can be assessed earlier as well.
In the phase II setting, in ES-SCLC, multiple alternative endpoints to OS have been widely used even though none have been formally validated as surrogate endpoints for overall survival. The most commonly used primary endpoint in the phase II setting for ES-SCLC has been tumor response. Tumor response has the advantage of being a quick and easy endpoint to assess, but it also has several limitations. These include: 1) tumor shrinkage may not occur with targeted therapies, 2) it's a subjective measure of treatment efficacy7, 3) it may not be a good predictor of survival8, 9, and 4) it excludes patients with stable disease who also achieve clinical benefit.10
PFS is another commonly used endpoint in assessing treatment efficacy in the phase II setting for many diseases. Since ES-SCLC has such a poor prognosis, it could be argued that the true endpoint of OS is primarily determined by whether the patient's disease has progressed or not. PFS includes patients' who achieve stable disease for an extended period of time as a success, in addition to those who achieve a response. PFS, similar to response, provides a more direct assessment of whether or not the tested therapy is potentially worthy of further study in the Phase III setting. PFS is typically defined as the time from study registration or randomization to the first of either disease progression or death from any cause. However, issues pertaining to imbalance in tumor assessment dates across the different treatment arms, missing assessments, ascertainment bias in an open label trial, and/or the occurrence of progression in the middle of a long tumor evaluation interval can affect the accuracy and validity of PFS as an endpoint, and need to be carefully considered.
In this initial surrogacy evaluation study, we formally investigated the relationships between PFS, best response, complete response, and confirmed response with overall survival using individual patient data from 9 phase II/III trials conducted by the North Central Cancer Treatment Group (NCCTG) in patients receiving first-line therapy for ES-SCLC. Given that the median survival is 9-11 months for patients with ES-SCLC in the first-line setting, we believe it is important to identify a valid surrogate endpoint for OS that can be assessed earlier for use as the primary endpoint in Phase II or III clinical trials.
Methods
Trial Characteristics
Individual patient data were pooled from 9 consecutive NCCTG first-line ES-SCLC therapy trials that included either a platinum- or taxol-based regimen and opened between 1987 and 1999. Three trials were randomized, two of which were randomized Phase III trials (862051, 892051), and the other was a randomized Phase II study (932053). The remaining 6 trials were single arm phase II trials. Patients who received no study treatment or were ineligible for trial participation were excluded from these analyses, leading to a total of 870 eligible patients with ES-SCLC. All trials were pre-RECIST, meaning that a tumor response consisted of a complete response, a partial response, or a tumor regression and tumor measurement data was collected bi-dimensionally.11-15 Since tumor measurement data was not available for analyses, RECIST criteria could not be used. Institutional Review Boards at the study sites had previously approved these trials, and all participants provided written informed consent. See Tables I-II for a detailed listing of the individual trial and patient characteristics.
Table I. Trial Characteristics in ES-SCLC (N=870).
| Protocol | 86205129 | 88200230 | 89205131 | 91205232 | 932051# | 93205333 | 95205234 | 97205235 | 98205236 | Overall |
|---|---|---|---|---|---|---|---|---|---|---|
| N (eligible) | 299 | 31 | 237 | 42 | 66 | 60 | 54 | 43 | 38 | 870 |
| Time Period | 1987-′90 | 1988-′91 | 1990-′93 | 1992-′93 | 1994-′96 | 1994-′98 | 1996-2000 | 1998-′99 | 1999-2000 | 1987-2000 |
| Trial Design† | R-III | S-II | R-III | S-II | S-II | R-II | S-II | S-II | S-II | |
| Tumor Assessment Schedule during treatment | Every 4 weeks | Every 4 weeks | Every 3-4 weeks | Every 3 weeks | Every 3 weeks* | Every 3 weeks | Every 4 weeks* | Every 3 weeks* | Every 8 weeks | |
| Mean (Range) of actual number of tumor assessments at: | ||||||||||
| 2 months | 1.7 (0-2) | 1.6 (1-2) | 1.7 (0-2) | 1.8 (1-3) | 1.9 (1-3) | 1.7 (1-3) | 1.4 (0-2) | 1.8 (0-3) | 1.0 (0-2) | |
| 4 months | 3.4 (0-5) | 3.2 (1-4) | 3.3 (0-5) | 3.3 (1-6) | 4.2 (1-6) | 3.0 (1-5) | 2.8 (1-4) | 3.7 (0-5) | 2.1 (0-4) | |
| 6 months | 4.3 (0-7) | 4.0 (1-6) | 4.1 (0-8) | 3.9 (1-8) | 5.2 (1-8) | 3.7 (1-8) | 3.8 (1-6) | 4.6 (0-6) | 2.8 (0-6) | |
| Agents1 | A:B:C:D: etoposide + cisplatin, CAV2, (CR outside of chest): TRT3 + PCI4, (CR pts only): recombinant gamma interferon or observation | A: cytoxan + etoposide + cisplatin, (for responders): hyperfraction-ated TRT3 + PCI4 (or brain RT or nothing) + cytoxan + etoposide | A: etoposide + cisplatin + MEGACE5 +/- whole brain radiation therapy B: etoposide + cisplatin + placebo +/- whole brain radiation therapy | A: paclitaxel + G-CSF6, cisplatin + etoposide | A: paclitaxel + cisplatin | A: topotecan, cisplatin + etoposide | A: etoposide + paclitaxel | A: etoposide + cisplatin, topotecan + paclitaxel + G-CSF6 | A: topotecan + paclitaxel + G-CSF6 | |
Patients with central nervous system only progression, typically allowed whole brain radiation therapy across all studies.
CAV = cyclophosphamide, doxorubicin, vincristine;
TRT = thoracic radiation therapy (physician discretion);
PCI = prophylactic cranial irradiation (physician discretion);
MEGACE = megestrol acetate;
G-CSF = Filgrastim or Neupogen®;
unpublished data.
R: Randomized trial; S: Single arm trial
If CT scan was being used to follow the indicator lesion, then it was repeated every other cycle.
Table II. Patient Characteristics by Trial and Overall (N=870).
| Protocol | 86205129 | 88200230 | 89205131 | 91205232 | 932051# | 93205333 | 95205234 | 97205235 | 98205236 | Overall |
|---|---|---|---|---|---|---|---|---|---|---|
| Performance Status (PS) | 0: 24% | 0: 23% | 0: 17% | 0: 19% | 0: 35% | 0: 32% | 0: 19% | 0: 33% | 0: 34% | 0: 24% |
| 1: 50% | 1: 45% | 1: 54% | 1: 57% | 1: 58% | 1: 42% | 1: 61% | 1: 49% | 1: 53% | 1: 52% | |
| 2: 26% | 2: 32% | 2: 29% | 2: 24% | 2: 8% | 2: 27% | 2: 20% | 2: 19% | 2: 13% | 2: 24% | |
| Median Age (range) | 64 (34-80) | 64 (49-74) | 65 (30-81) | 66 (34-78) | 63 (33-78) | 66 (48-82) | 67 (44-83) | 64 (35-81) | 64 (43-85) | 64 (30-85) |
| Gender | M: 65% | M: 48% | M: 60% | M: 64% | M: 70% | M: 55% | M: 54% | M: 60% | M: 63% | M: 62% |
| F: 35% | F: 52% | F: 40% | F: 36% | F: 30% | F: 45% | F: 46% | F: 40% | F: 37% | F: 38% | |
| Median number of treatment cycles (range) | 4 (1-28) | 3 (1-7) | 5 (1-27) | 3 (1-12) | 6 (1-8) | 3 (1-13) | 4.5 (1-11) | 6 (1-6) | 5 (1-7) | 5 (1-28) |
| % Alive | 1% | 0% | 2% | 0% | 2% | 3% | 2% | 5% | 5% | 14 (2%) |
| Median Overall Survival (95% CI) |
9.9 (9.4, 11.0) |
11.9 (9.1, 14.6) |
8.9 (7.9, 9.6) |
9.1 (6.8, 11.1) |
8.6 (7.9, 10.5) |
10.8 (8.2, 13.0) |
9.5 (7.1, 13.2) |
10.5 (7.9, 12.6) |
9.1 (7.5, 13.0) |
9.6 (9.1, 10.0) |
| Median Progression-Free Survival (95% CI) |
5.7 (5.3, 6.3) |
8.4 (6.9, 10.1) |
5.9 (5.1, 6.8) |
2.8 (2.1, 3.5) |
5.1 (4.7, 5.7) |
4.5 (2.7, 5.9) |
5.0 (3.8, 6.4) |
6.6 (5.6, 7.8) |
4.6 (3.1, 6.3) |
5.5 (5.2, 5.9) |
| Best Response Rate (95% CI) |
51% (45, 57%) |
42% (25, 61%) |
38% (32, 45%) |
43% (28, 59%) |
47% (35, 60%) |
20% (11, 32%) |
50% (36, 64%) |
44% (29, 60%) |
53% (36, 69%) |
44% (41, 48%) |
| Complete Response Rate (95% CI) |
29% (24, 34%) |
35% (19, 55%) |
22% (17, 28%) |
5% (1, 16%) |
15% (8, 26%) |
8% (3, 18%) |
15% (7, 27%) |
19% (8, 33%) |
13% (4, 28%) |
22% (19, 25%) |
| Confirmed Response Rate (95% CI) |
41% (35 – 47%) |
39% (22, 58%) |
29% (23, 35%) |
21% (10, 37%) |
35% (24, 48%) |
15% (7, 27%) |
44% (31, 59%) |
33% (19, 49%) |
42% (26, 59%) |
34% (31, 37%) |
The regimens in the trials were either on a 3 or 4 week cycle, with tumor assessments generally performed every cycle. See Table 1 for information on the mean and range of the actual number of assessments by trial at the 2, 4, and 6 month time points that were used in the landmark analysis. Due to the tumor assessment schedules, the putative surrogate endpoint values at 2, 4, and 6 months were expected to be based on 2, 4 or more, or 6 or more post-baseline assessments, respectively.
Statistical Analysis
This study assessed the association between putative surrogate endpoints and overall survival at both the patient and trial-level. Putative surrogate endpoints included PFS and tumor response based endpoints, including best response (BR), complete response (CR), and the confirmed response (CoR) rate. Complete response was defined as total disappearance of all tumor during treatment. Partial response was defined as at least a 50% reduction in the sum of the products of the two greatest perpendicular diameters of all indicator lesions. Best response was defined as any complete or partial response that occurred during treatment. BR and CR did not require confirmation of response at a subsequent tumor evaluation. The CoR rate was defined as 2 consecutive evaluations of a complete or partial response at least 4 weeks apart. PFS was defined as the time from registration or randomization to the first of either disease progression or death from any cause. Finally, OS was defined as the time from registration or randomization to death due to any cause.
Individual patient-level surrogacy was evaluated as described below. Initially, progression and response status were modeled as time dependent variables in multivariate Cox proportional hazards (PH) models16 for OS (adjusted for age, gender, number of metastatic sites, and ECOG performance status (PS), based on previously published work17), stratified by trial. This was done to assess whether patients who remained progression-free or had achieved a response at any time during treatment survived significantly longer than those who had progressed or not responded to treatment. Subsequently, univariate and multivariate Cox PH models16 (adjusted for the same factors as above), stratified for the patient's trial, were used to assess the prognostic impact of PFS, BR, CR, and CoR, on subsequent survival using landmark analyses18 at 2, 4, and 6 months. The hazard ratios (HR), 95% confidence intervals, and p-values are reported. In addition, model discrimination was evaluated using the concordance index19 (c-index) for the landmark analyses, which is the recommended approach for comparing the predictive ability for different prognostic models' of interest.20 A completely random prediction would have a c-index of 0.5, and a perfect rule will have a concordance of 1.0. The model with the highest c-index was considered to be the best predictor from the landmark analyses, where p-values were used to demonstrate statistical significance.
Trial-level surrogacy measures were calculated for PFS, BR, CR, and CoR endpoints across the 3 randomized trials included in this study. These surrogacy measures quantify the association between the treatment effects on OS and the treatment effects on the putative surrogate endpoints. Given the small number of trials considered, the treating membership (i.e. participating center) within each trial was considered as the unit of analysis, which is a common practice in evaluating potential surrogate endpoints when the number of randomized trials is less than six.21, 22 The randomized phase II study, 932053, was analyzed as one separate unit due to its small size (n=60). There were 38 participating centers across the 3 randomized trials, but 6 participating centers were combined with other centers so that a minimum of 2 patients were included in each experimental and control arm for each center. Thus, 32 units were used in the analysis.
Trial-level surrogacy was measured in multiple ways, including conventional methods recommended by Sargent et al.23, 24 The association between treatment effects on OS and the putative surrogate endpoints of PFS, BR, CR, and CoR was evaluated by calculating the Spearman's rank correlation coefficient, along with the R2 value from a weighted linear regression model (WLS R2), with weights equal to the sample size of the unit from which the data were derived. The treatment effects within each unit were estimated by calculating the log hazard ratios (HRs) and log odds ratios (ORs) from Cox PH16 and logistic regression models, respectively, depending on the nature of the endpoint. In addition, the surrogacy of the time-to-event putative surrogate endpoint of PFS was quantified by a formal trial-level surrogacy measure, known as the Copula R2.25 Copula R2 is estimated from a bivariate survival model which models the putative surrogate endpoint and the true endpoint jointly. Both the WLS R2 and the Copula R2 value range from 0 to 1, with values close to zero suggesting poor surrogacy, and values close to 1 indicating high surrogacy. Concordance was measured between OS and the putative surrogate endpoints by assessing the percentage of units that reached the same conclusions. All tests were 2-sided, with p-values <0.05 denoting statistical significance. Statistical analyses were performed using SAS v9.13 (SAS Institute, Cary, NC) and R v2.7.1 software (R Foundation for Statistical Computing).
Results
Patient Characteristics and Outcomes
Data included a total of 870 eligible patients with ES-SCLC who received first-line treatment. The median age was 64 years (range: 30-85). Sixty-two percent were male patients, 76% had a PS of 0 or 1, and 54% of patients had less than 2 metastatic sites at study entry. The median follow-up for the 14 patients still alive is 4.4 years (range, 0.5-12.0). 98% of patients have died and 87% of patients had disease progression at the time of this analysis (12% died without disease progression). The overall median OS and PFS is 9.6 months (95% CI, 9.1-10.0) and 5.5 months (95% CI, 5.2-5.9), respectively. In addition, about 44% (95% CI: 41-48%) of patients had a BR, 22% (95% CI: 19-25%) had a CR, and 34% (95% CI: 31-37%) had a CoR. See Table II for patient characteristics by trial and overall.
Approximately 13.1%, 32.8%, and 51.4% of patients experienced disease progression by 2, 4, and 6 months, respectively, post study entry. Of the 758 patients that progressed, 752 died, with a median time from progression to death of 3.3 months (95% CI: 3.0-3.6). About 30% of the patients were alive 6 months after progression, and only about 8% were alive 12 months after progression.
Patient-Level Surrogacy Measures
Time dependent models
As expected, patients who experienced a disease progression at any time had a much worse prognosis compared to patients who had not progressed (HR=17.4 (95% CI: 13.4-22.5), p-value<0.0001). Patients who responded to treatment had significantly improved OS, but the effect was more modest (HR = 0.64 (95% CI: 0.55-0.75), p-value<0.0001) as compared to the disease progression model. In both models, we found that increased PS (1 or 2 vs. 0) and increased age had significantly worse OS. For the response model, gender and the number of metastatic sites at baseline were also significant predictors of OS, with male gender and 2 or more metastatic sites having a worse prognosis.
Landmark analysis
796, 728, and 651 patients who were alive at 2, 4, and 6 months post study entry were included in the respective univariate landmark analysis. 765, 698, and 623 patients at 2, 4, and 6 months were included in the multivariate landmark analysis due to some missing values for the number of metastatic sites variable.
Univariate model results
While patients who had achieved a BR, CR, or CoR at all of the landmark time points had significantly longer subsequent survival (except CR and CoR at 2 months), the c-indices for these models were low (0.50-0.56). This indicates the relative inability of these metrics to adequately and reliably discriminate patients with different survival times. In contrast, models using PFS at the different landmark time points had better predictive ability. Specifically, patients alive and progression-free did significantly better in terms of subsequent survival compared to those who had progressed or died, with c-indices (HR) of 0.54 (0.41), 0.59 (0.41), and 0.62 (0.39) for PFS status at 2, 4, and 6 months, respectively.
Multivariate model results
At 4 and 6 months, the BR, CR, and CoR endpoints were significant (p<0.01, c-indices = 0.59) with similar HR varying from 0.65-0.75 (Models 1-3, Table III). The results for PFS were consistent with the univariate analysis (Model 4, Table III). The PFS status at all of the landmark time points was significantly associated with OS (p<0.0001). The HR (c-indices) varied from 0.40 to 0.42 (0.60 to 0.65) for landmark times 2, 4, and 6 months from study entry. Although the PFS status at 6 months was the strongest predictor of subsequent survival (c-index=0.65 (95% CI: 0.63-0.68); 14.0% improvement from base model), the PFS status at 4 months was a strong predictor as well (c-index=0.63 (95% CI: 0.61-0.66); 10.5% improvement). In addition, the PFS status at 4 and 6 months showed significantly improved predictive abilities (i.e. c-indices) as compared to all response-based endpoints at 4 and 6 months, respectively (p < 0.001). See Table III for the detailed multivariate landmark analysis results.
Table III. Multivariate1 Landmark Analysis.
| Models | % Success# | Hazard Ratio (95% CI*) | P-Value | Concordance (C) Index(95% CI*) | % Improvement from base Model2 |
|---|---|---|---|---|---|
| 1. Response vs. Others | |||||
| 2 months | 28.0% | 0.82 (0.70, 0.97) | 0.0200 | 0.59 (0.57, 0.61) | 1.7% |
| 4 months | 44.0% | 0.73 (0.62, 0.85) | <0.0001 | 0.59 (0.57, 0.62) | 3.5% |
| 6 months | 50.1% | 0.72 (0.61, 0.85) | 0.0001 | 0.59 (0.57, 0.62) | 3.5% |
| 2. Complete Response vs. Others | |||||
| 2 months | 1.3% | 0.90 (0.48, 1.71) | 0.7500 | 0.58 (0.56, 0.61) | 0.0% |
| 4 months | 16.6% | 0.68 (0.55, 0.84) | 0.0004 | 0.59 (0.56, 0.61) | 3.5% |
| 6 months | 23.8% | 0.65 (0.53, 0.79) | <0.0001 | 0.59 (0.57, 0.62) | 3.5% |
| 3. Confirmed Response vs. Others | |||||
| 2 months | 9.2% | 0.87 (0.67, 1.12) | 0.2800 | 0.58 (0.56, 0.61) | 0.0% |
| 4 months | 29.2% | 0.75 (0.63, 0.90) | 0.0010 | 0.59 (0.56, 0.61) | 3.5% |
| 6 months | 39.8% | 0.74 (0.62, 0.88) | 0.0005 | 0.59 (0.57, 0.62) | 3.5% |
| 4. Alive and Progression-free vs. Others (PFS) | |||||
| 2 months | 90.6% | 0.40 (0.30, 0.52) | <0.0001 | 0.60 (0.58, 0.62) | 3.4% |
| 4 months | 74.9% | 0.42 (0.35, 0.51) | <0.0001 | 0.63 (0.61, 0.66)3 | 10.5% |
| 6 months | 59.9% | 0.41 (0.35, 0.49) | <0.0001 | 0.65 (0.63, 0.68) 3 | 14.0% |
At each time point, success is defined as the percentage of patients who had: 1) best response, 2) complete response, 3) confirmed response, and 4) alive and progression-free.
CI = Confidence Interval
Models adjusted for baseline age, gender, performance status, and the number of metastatic sites
Percent improvement in the c-index from the base multivariate model of baseline age, gender, performance status, and the number of metastatic sites at baseline, where the base model had c-index values of 0.58, 0.57, and 0.57 for 2, 4, and 6 months, respectively across the four models. The higher the percent improvement, the better the predictor as compared to the base model.
PFS at 4 and 6 months showed significantly improved predictive abilities (i.e. c-indices) as compared to all response-based endpoints at 4 and 6 months, respectively (p < 0.001).
Figure I shows the Kaplan-Meier curves for OS split by the landmark analysis subgroups: PFS status at 4 and 6 months. The median subsequent survival for patients who were progression-free at 4 months was significantly higher compared to patients who had progressed by 4 months (median OS: 7.7 vs. 3.6 months; p<0.0001). Similarly, the median subsequent survival for patients who were progression-free at 6 months was significantly higher compared to patients who had progressed by 6 months (median OS: 7.4 vs. 3.0 months; p<0.0001).
Figure I.
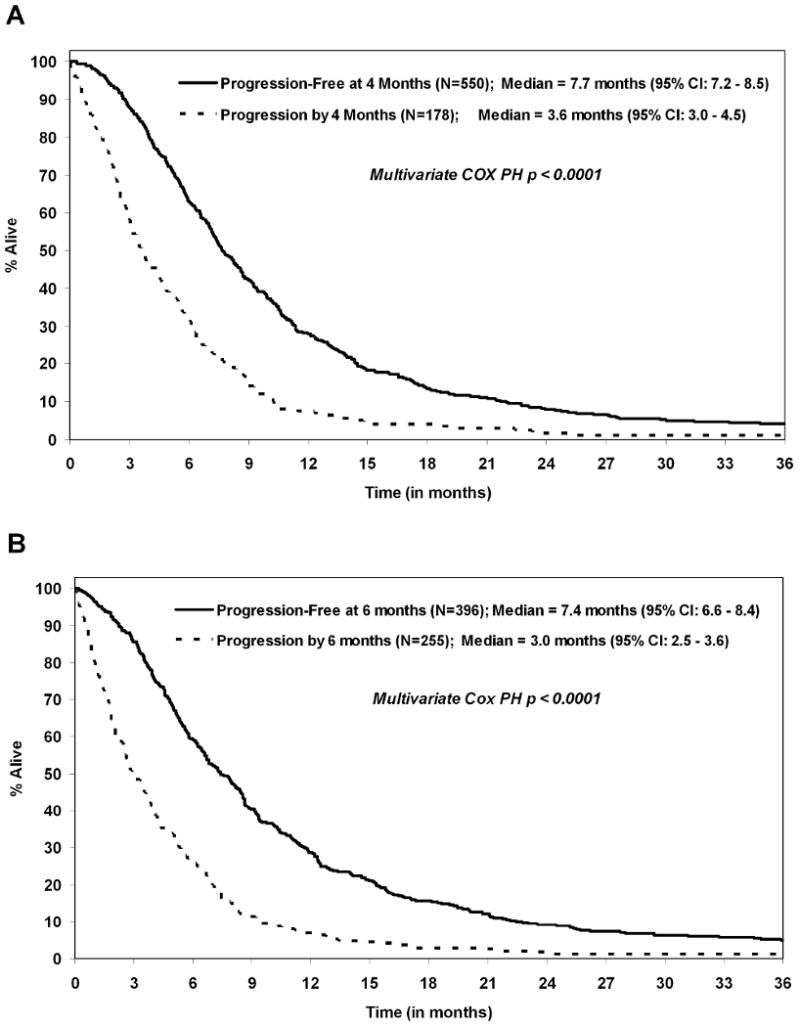
Landmark analyses survival curves for progression status at the following time points: (A) 4 months (N=728) and (B) 6 months (N=651).
Trial-Level Surrogacy Measures
The relationships between the unit-specific log HRs comparing the experimental and the control arms for PFS versus OS are shown in Figure II. The WLS R2 was 0.79, the Spearman's rank correlation coefficient was 0.75, and the Copula R2 was 0.80 for PFS. The WLS R2 value of 0.79 indicates that the treatment effects observed on PFS explained 79% of the variance in OS. Furthermore, the Copula R2 value of 0.80 indicates moderate surrogacy. A sensitivity analysis excluding the outlier yielded similar results (WLS R2=0.73, Spearman rank correlation=0.73, Copula R2=0.75). For the treatment vs. control comparisons within each participating unit, 29 of 32 units (91% concordance) obtained the same conclusions for both OS and PFS. For these 29 concordant units, 3 showed a significant difference in both PFS and OS (HRs in the same direction), and 26 units showed no significant difference in both of the endpoints.
Figure II.
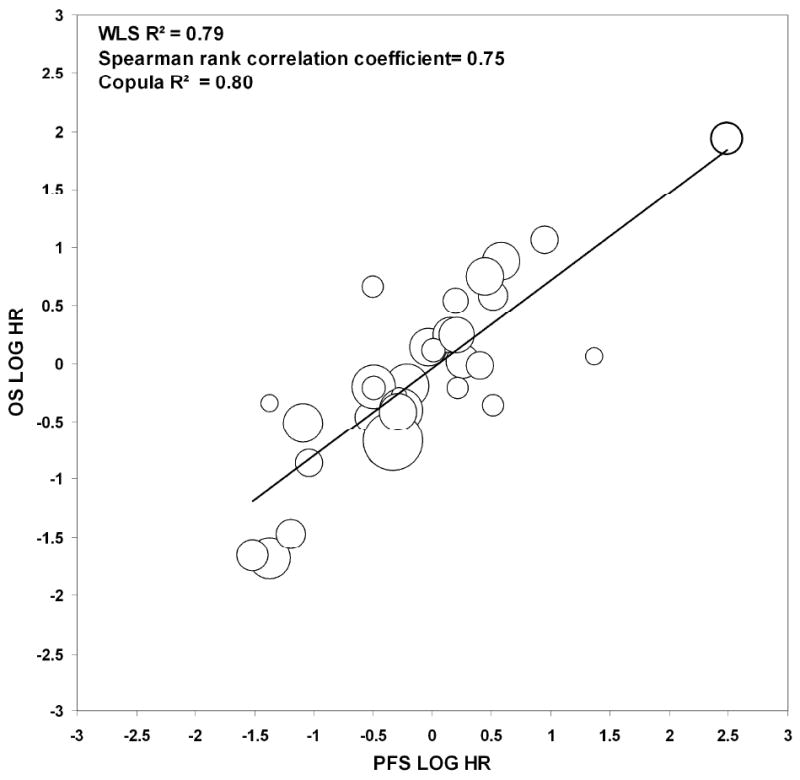
Plot of the log of the hazard ratios (HRs) for the endpoints of Progression-Free Survival (PFS) and Overall Survival (OS) for the centers included in the 3 randomized trials. The sizes of the circles are proportional to the sample size within each center or unit. Excluding the bolded outlier yielded similar results (WLS R2 = 0.73, Spearman rank correlation coefficient = 0.73, Copula R2 = 0.75).
Response based endpoints (BR, CR, CoR) had much lower associations for WLS R2 and Spearman rank correlations (see Figure III for BR, CoR plots) as compared to PFS. The WLS R2 value (Spearman rank correlation coefficient) was 0.21 (0.52), 0.48 (0.50), and 0.40 (0.60) for BR, CR, and CoR, respectively. A sensitivity analysis was performed excluding the outliers and resulted in WLS R2 values (Spearman rank correlation coefficients) of 0.55 (0.47), 0.26 (0.15), and 0.46 (0.46) for BR, CR, and CoR, respectively. The concordance between OS and response unit-level conclusions was 84% for BR, 80% for CR, and 81% for CoR.
Figure III.

Plot of the log of the hazard ratios for Overall Survival (OS) versus the log of the odds ratios for (A) best response (BR) and (B) confirmed response (CoR) endpoints. The sizes of the circles are proportional to the sample size within each center or unit included in the 3 randomized trials. Excluding the bolded outliers for (A) yielded values of 0.55 and 0.47 for WLS R2 and Spearman rank correlation coefficients, respectively. Excluding the bolded outliers from (B) yielded values of 0.46 and 0.46 for WLS R2 and Spearman rank correlation coefficients, respectively.
Discussion
In this study of 870 patients with previously untreated ES-SCLC, multiple putative surrogate endpoints for overall survival were assessed. Surrogacy was measured at both the patient and trial level. At the individual patient level, PFS status as early as 4 months was a strong predictor of subsequent survival, with 6-month PFS being the strongest predictor of subsequent survival as compared to response-based endpoints. At the trial level, PFS showed the highest levels of surrogacy as compared to response-based endpoints. Specifically, the treatment effect observed on PFS explained 79% of the variance in OS (with a Copula R2=0.80), while response based endpoints explained ≤ 48% of the variance in OS. PFS showed the most promise as a surrogate endpoint for OS at the patient and the trial level across all the statistical methods assessed. This consistency in results gives strong evidence that PFS is the most promising surrogate endpoint for OS as compared to response-based endpoints.
Given that the median PFS is around 4-6 months in this disease population, choosing a PFS based endpoint around 4-6 months post-registration as the primary endpoint in ES-SCLC in the Phase II setting is appropriate. This result is important, especially considering the current availability of novel agents26 to test in the Phase II setting in ES-SCLC. It is important to not only assess these new treatments quickly in the phase II setting, but also to have greater confidence that the tested therapies may succeed at the Phase III level.
Given the poor prognosis of this disease, with median survival of less than a year, one may wonder why it is important to identify a valid surrogate endpoint for OS. The 2 main reasons are 1) OS requires longer follow-up than a valid surrogate like PFS would require, and 2) OS is unable to effectively assess crossover effects and subsequent therapies after disease progression. A valid surrogate endpoint, like PFS, would be unaffected by the use of second-line therapy and can be assessed much sooner, leading to decreased cost and more timely approval of a new regimen.
Although, historically, the overall tumor response rate is the most common primary endpoint in the Phase II setting in untreated ES-SCLC patients, the increasing availability of targeted therapies in SCLC research16 makes it a less appropriate endpoint. A large meta-analyses of 48 Phase III first line trials in ES-SCLC showed that only about 33% of the median survival differences between treatment arms could be explained by response rate differences between the arms.9 In addition, it has been shown that there is no clear relationship between response and survival in this disease.8 Finally, tumor response has been shown previously to have high levels of measurement error. 7
PFS has shown promise as a potential surrogate for OS in other settings as well. One such study was performed in patients with advanced non-small cell lung cancer (NSCLC) where it was shown that PFS may be an acceptable surrogate for OS in future trials in advanced NSCLC. This study was a pooled analysis of 2,838 patients randomized in 7 trials.27 Another study in advanced NSCLC showed that PFS was a better predictor of survival as compared to tumor response endpoints.28
Despite the impressive results in our study for PFS, there are certainly good reasons to curb our enthusiasm. First, only 870 patients were included in this study. Second, only 2 randomized Phase III trials were included, which limits the strength of our conclusions and calls for further validation in a larger number of randomized phase III trials, especially for the trial-level surrogacy portion of the analysis. Third, only trials that used pre-RECIST criteria were included in this study, which limits our ability to generalize these results to studies that use the RECIST criteria.
In conclusion, PFS was strongly associated with OS at both the patient and trial level and should be routinely used as the primary endpoint in the Phase II setting. Our results also demonstrated that PFS may be a potential surrogate for OS, but further validation is needed using data from a larger number of randomized phase III trials. This result, if validated, would ultimately allow faster evaluation of drugs for ES-SCLC.
Acknowledgments
Research Support: Grant CA-25224 (from NIH)
Footnotes
Financial Disclosures: none to disclose.
References
- 1.Jemal A, Siegel R, Ward E, Hao Y, Xu J, Thun MJ. Cancer statistics, 2009. CA Cancer J Clin. 2009;59(4):225–49. doi: 10.3322/caac.20006. [DOI] [PubMed] [Google Scholar]
- 2.Horner MJ, Ries LAG, Krapcho M, et al. National Cancer Institute; Bethesda, MD: SEER Cancer Statistics Review, 1975-2006. http://seer.cancer.gov/csr/1975_2006/, based on November 2008 SEER data submission, posted to the SEER web site, 2009. [Google Scholar]
- 3.National Cancer Institute, U.S. National Institutes of Health. small-cell lung cancer for health professionals. [March 2010]; website on. Available at http://www.cancer.gov/cancertopics/pdq/treatment/small-cell-lung/healthprofessional/page2.
- 4.Socinski MA, Smit EF, Lorigan P, et al. Phase III study of pemetrexed plus carboplatin compared with etoposide plus carboplatin in chemotherapy-naive patients with extensive-stage small-cell lung cancer. J Clin Oncol. 2009;27(28):4787–92. doi: 10.1200/JCO.2009.23.1548. [DOI] [PubMed] [Google Scholar]
- 5.Lara PN, Jr, Natale R, Crowley J, et al. Phase III trial of irinotecan/cisplatin compared with etoposide/cisplatin in extensive-stage small-cell lung cancer: clinical and pharmacogenomic results from SWOG S0124. J Clin Oncol. 2009;27(15):2530–5. doi: 10.1200/JCO.2008.20.1061. [DOI] [PMC free article] [PubMed] [Google Scholar]
- 6.O'Brien ME, Ciuleanu TE, Tsekov H, et al. Phase III trial comparing supportive care alone with supportive care with oral topotecan in patients with relapsed small-cell lung cancer. J Clin Oncol. 2006;24(34):5441–7. doi: 10.1200/JCO.2006.06.5821. [DOI] [PubMed] [Google Scholar]
- 7.Moertel CG. Improving the efficiency of clinical trials: a medical perspective. Stat Med. 1984;3(4):455–68. doi: 10.1002/sim.4780030428. [DOI] [PubMed] [Google Scholar]
- 8.Pazdur R. Response rates, survival, and chemotherapy trials. J Natl Cancer Inst. 2000;92(19):1552–3. doi: 10.1093/jnci/92.19.1552. [DOI] [PubMed] [Google Scholar]
- 9.Hotta K, Kiura K, Fujiwara Y, et al. Association between incremental gains in the objective response rate and survival improvement in phase III trials of first-line chemotherapy for extensive disease small-cell lung cancer. Ann Oncol. 2009;20(5):829–34. doi: 10.1093/annonc/mdp020. [DOI] [PubMed] [Google Scholar]
- 10.Tolcher AW. Stable disease is a valid end point in clinical trials. Cancer J. 2009;15(5):374–8. doi: 10.1097/PPO.0b013e3181bdbb05. [DOI] [PubMed] [Google Scholar]
- 11.Tonkin K, Tritchler D, Tannock I. Criteria of tumor response used in clinical trials of chemotherapy. J Clin Oncol. 1985;3(6):870–5. doi: 10.1200/JCO.1985.3.6.870. [DOI] [PubMed] [Google Scholar]
- 12.Oken MM, Creech RH, Tormey DC, et al. Toxicity and response criteria of the Eastern Cooperative Oncology Group. Am J Clin Oncol. 1982;5(6):649–55. [PubMed] [Google Scholar]
- 13.Miller AB, Hoogstraten B, Staquet M, Winkler A. Reporting results of cancer treatment. Cancer. 1981;47(1):207–14. doi: 10.1002/1097-0142(19810101)47:1<207::aid-cncr2820470134>3.0.co;2-6. [DOI] [PubMed] [Google Scholar]
- 14.Jett JR, Su JQ, Krook JE, Goldberg RM, Kugler JW. Measurable or assessable disease in lung cancer trials: does it matter? J Clin Oncol. 1994;12(12):2677–81. doi: 10.1200/JCO.1994.12.12.2677. [DOI] [PubMed] [Google Scholar]
- 15.Eisenhauer EA, Therasse P, Bogaerts J, et al. New response evaluation criteria in solid tumours: revised RECIST guideline (version 1.1) Eur J Cancer. 2009;45(2):228–47. doi: 10.1016/j.ejca.2008.10.026. [DOI] [PubMed] [Google Scholar]
- 16.Cox DR. Regression models and life tables. (B).J R Stat Soc. 1972;34:187–202. [Google Scholar]
- 17.Foster NR, Mandrekar SJ, Schild SE, et al. Prognostic factors differ by tumor stage for small cell lung cancer: a pooled analysis of North Central Cancer Treatment Group trials. Cancer. 2009;115(12):2721–31. doi: 10.1002/cncr.24314. [DOI] [PMC free article] [PubMed] [Google Scholar]
- 18.Anderson JR, Cain KC, Gelber RD. Analysis of survival by tumor response. J Clin Oncol. 1983;1(11):710–9. doi: 10.1200/JCO.1983.1.11.710. [DOI] [PubMed] [Google Scholar]
- 19.Harrell FE, Jr, Lee KL, Califf RM, Pryor DB, Rosati RA. Regression modeling strategies for improved prognostic prediction. Stat Med. 1984;3(2):143–52. doi: 10.1002/sim.4780030207. [DOI] [PubMed] [Google Scholar]
- 20.Kattan MW. Judging new markers by their ability to improve predictive accuracy. J Natl Cancer Inst. 2003;95(9):634–5. doi: 10.1093/jnci/95.9.634. [DOI] [PubMed] [Google Scholar]
- 21.Buyse M, Molenberghs G, Burzykowski T, Renard D, Geys H. The validation of surrogate endpoints in meta-analyses of randomized experiments. Biostatistics. 2000;1(1):49–67. doi: 10.1093/biostatistics/1.1.49. [DOI] [PubMed] [Google Scholar]
- 22.Lassere M, Johnson K, Hughes M, et al. Simulation studies of surrogate endpoint validation using single trial and multitrial statistical approaches. J Rheumatol. 2007;34(3):616–9. [PubMed] [Google Scholar]
- 23.Sargent DJ, Wieand HS, Haller DG, et al. Disease-free survival versus overall survival as a primary end point for adjuvant colon cancer studies: individual patient data from 20,898 patients on 18 randomized trials. J Clin Oncol. 2005;23(34):8664–70. doi: 10.1200/JCO.2005.01.6071. [DOI] [PubMed] [Google Scholar]
- 24.Sargent DJ, Patiyil S, Yothers G, et al. End points for colon cancer adjuvant trials: observations and recommendations based on individual patient data from 20,898 patients enrolled onto 18 randomized trials from the ACCENT Group. J Clin Oncol. 2007;25(29):4569–74. doi: 10.1200/JCO.2006.10.4323. [DOI] [PubMed] [Google Scholar]
- 25.Burzykowski T, Molenberghs G, Buyse M, Geys H, Renard D. Validation of surrogate endpoints in multiple randomized clinical trials with failure time endpoints. Appl Stat. 2001;50:405–22. [Google Scholar]
- 26.Board RE, Thatcher N, Lorigan P. Novel therapies for the treatment of small-cell lung cancer: a time for cautious optimism? Drugs. 2006;66(15):1919–31. doi: 10.2165/00003495-200666150-00003. [DOI] [PubMed] [Google Scholar]
- 27.Buyse M, Squifflet P, Laporte S, Fossella F, Georgoulias V, et al. Prediction of survival benefits from progression-free survival in patients with advanced non small cell lung cancer: Evidence from a pooled analysis of 2,838 patients randomized in 7 trials. J Clin Oncol. 2008 May 20:26. abstr 8019. [Google Scholar]
- 28.Mandrekar SJ, Qi Y, Hillman SL, et al. Endpoints in phase II trials for advanced non-small cell lung cancer. J Thorac Oncol. 5(1):3–9. doi: 10.1097/JTO.0b013e3181c0a313. [DOI] [PMC free article] [PubMed] [Google Scholar]
- 29.Maksymiuk AW, Jett JR, Earle JD, et al. Sequencing and schedule effects of cisplatin plus etoposide in small-cell lung cancer: results of a North Central Cancer Treatment Group randomized clinical trial. J Clin Oncol. 1994;12(1):70–6. doi: 10.1200/JCO.1994.12.1.70. [DOI] [PubMed] [Google Scholar]
- 30.Frytak S, Shaw EG, Jett JR, et al. Infusion cisplatin chemotherapy and hyperfractionated thoracic radiotherapy for small-cell lung cancer. Am J Clin Oncol. 1996;19(2):193–8. doi: 10.1097/00000421-199604000-00022. [DOI] [PubMed] [Google Scholar]
- 31.Rowland KM, Jr, Loprinzi CL, Shaw EG, et al. Randomized double-blind placebo-controlled trial of cisplatin and etoposide plus megestrol acetate/placebo in extensive-stage small-cell lung cancer: a North Central Cancer Treatment Group study. J Clin Oncol. 1996;14(1):135–41. doi: 10.1200/JCO.1996.14.1.135. [DOI] [PubMed] [Google Scholar]
- 32.Kirschling RJ, Grill JP, Marks RS, et al. Paclitaxel and G-CSF in previously untreated patients with extensive stage small-cell lung cancer: a phase II study of the North Central Cancer Treatment Group. Am J Clin Oncol. 1999;22(5):517–22. doi: 10.1097/00000421-199910000-00019. [DOI] [PubMed] [Google Scholar]
- 33.Schaefer PL, Marks RS, Mahoney MR, et al. Randomized phase II study of daily versus continuous-infusion schedules of topotecan in the treatment of extensive-stage small cell lung cancers. Am J Clin Oncol. 2003;26(3):236–40. doi: 10.1097/01.COC.0000018038.28645.46. [DOI] [PubMed] [Google Scholar]
- 34.Perez EA, Geoffroy FJ, Hillman S, et al. Phase II study of oral etoposide and intravenous paclitaxel in extensive-stage small cell lung cancer. Lung Cancer. 2004;44(3):347–53. doi: 10.1016/j.lungcan.2003.12.002. [DOI] [PubMed] [Google Scholar]
- 35.Jett JR, Hatfield AK, Hillman S, et al. Alternating chemotherapy with etoposide plus cisplatin and topotecan plus paclitaxel in patients with untreated, extensive-stage small cell lung carcinoma: a phase II trial of the North Central Cancer Treatment Group. Cancer. 2003;97(10):2498–503. doi: 10.1002/cncr.11377. [DOI] [PubMed] [Google Scholar]
- 36.Molina JR, Jett JR, Foster N, et al. Phase II NCCTG trial of oral topotecan and paclitaxel with G-CSF (filgrastim) support in patients with previously untreated extensive-stage small cell lung cancer. Am J Clin Oncol. 2006;29(3):246–51. doi: 10.1097/01.coc.0000217566.11742.b5. [DOI] [PubMed] [Google Scholar]