

Abstract
Multiple studies have demonstrated elevations of α, β-unsaturated aldehydes including, 4-hydroxynonenal (HNE) and acrolein, in vulnerable regions of mild cognitive impairment (MCI), preclinical Alzheimer’s disease (PCAD), and late-stage Alzheimer’s disease (LAD) brain. However, there has been limited study of a third member, 4-hydroxyhexenal (HHE), a diffusible lipid peroxidation product of the ω-3 polyunstataturated fatty acids (PUFAs). In the present study levels of extractable and protein-bound HHE were quantified in the hippocampus/parahippocampal gyrus (HPG), superior and middle temporal gyri (SMTG), and cerebellum (CER) of MCI, PCAD, LAD, and normal control (NC) subjects. Levels of extractable and protein-bound HHE were increased in multiple regions in the progression of AD. Extractable HHE was significantly elevated in the hippocampus/parahippocampal gyrus (HPG) of PCAD and LAD subjects and protein-bound HHE was significantly higher in MCI, PCAD, and LAD HPG. A time- and concentration-dependent decrease in survival and a concentration dependent decrease in glucose uptake were observed in primary cortical cultures treated with HHE. Together these data support a role for lipid peroxidation in the progression of AD.
Keywords: 4-hydroxyhexenal, lipid peroxidation, mild cognitive impairment (MCI), preclinical Alzheimer’s disease (PCAD), Alzheimer’s disease (AD), Neurodegenerative Diseases
1. Introduction
Oxidative damage to cellular macromolecules, including, nucleic acids, proteins, and lipids, is a feature of aging as well as many neurodegenerative diseases including Alzheimer’s disease (AD). Multiple studies have shown oxidative damage, including nucleic acid oxidation (Gabbit et al., 1998; Lovell et al., 1999; Mecocci et al., 1994; Nunomura et al., 2001; Shan et al., 2003), protein modifications (Ding et al., 2006; Drake et al., 2004; Lovell et al., 2000b, et al., 1998; Pocernich et al., 2003; Shao et al., 2008; Sultana et al., 2006), and generation of by-products of lipid peroxidation (Lovell et al., 2001; Markesbery et al., 1998; McGarth et al., 2001), are significantly increased in late-stage Alzheimer’s disease (LAD) compared to age-matched normal control (NC) subjects. In addition, markers of oxidative damage have been observed in mild cognitive impairment (MCI), the earliest clinical manifestation of AD (Butterfield et al., 2006; Ding et al., 2005; Markesbery et al., 2005; Shao et al., 2008; Wang et al., 2006; Williams et al., 2006). These observations suggest oxidative damage may play a potential role in the pathogenesis of AD.
Lipids represent a class of biomacromolecules whose proper function is vital to cellular homeostasis, but are also vulnerable to oxidative damage by reactive oxygen species (ROS). Peroxidation of lipids results in compromised integrity of cellular membranes and the generation of diffusible aldehydic by-products including the α, β-unsaturated aldehydes acrolein, 4-hydroxyhexenal (HHE), and 4-hydroxynonenal (HNE). The toxicity of α, β-unsaturated aldehydes is attributed to their soft electrophilic nature that is highly reactive with cysteine, histidine, and lysine amino acid residues (LoPachin et al., 2009). HNE and acrolein are elevated in MCI and LAD brain (Butterfield et al., 2006; Lovell et al., 2001; Markesbery et al., 1998; Reed et al., 2008; Williams et al., 2006) and have been shown to be toxic in neuron cultures (Lovell et al., 2000a, et al., 2001; Pocernich et al., 2003). HHE is a by-product of oxidative damage to ω-3 polyunsaturated fatty acids (PUFAs) including docasahexaenoic acid, the predominate ω-3 PUFA in grey matter (Long et al., 2008; Van Kuijk et al., 1990). Concentrations of DHA are approximately 30-50 times higher than the predominate ω-6 PUFA, arachidonic acid (Lim et al., 2005; Pawlosky et al., 2001; Salem et al., 2001) making it an abundant target for oxidative attack.
In the current studies levels of extractable and protein-bound HHE were quantified in vulnerable brain regions, the hippocampus/parahippocampal gyrus (HPG) and superior and middle temporal gyri (SMTG), and the cerebellum (CER), a non-vulnerable brain region from preclinical AD (PCAD), MCI, LAD, and NC subjects. Levels of extractable HHE were quantified using gas chromatography mass spectrometry with negative chemical ionization (GC/MS/NCI) and protein-bound levels of HHE were determined by dot blot immunochemistry and an HHE specific antibody. In addition, levels of protein carbonyls were quantified by immunochemistry. To determine the rate of HHE generation in the presence of AD physiologically relevant oxidative insults, DHA was treated with amyloid β peptide (Aβ1-40, Aβ1-42), as well as iron (II)/ascorbic acid. Levels of extractable HHE generated from oxidized DHA were determined by GC/MS/NCI. To investigate the effect of HHE on primary cortical neurons, cell viability was assessed at 3, 6, 12, and 24 hours in cultures treated with increasing HHE concentrations (1 – 100 μM). Additionally, the effect of HHE (1 to 100 μM) on glucose uptake was assessed at 6 hr.
2. Methods
2.1 Neuron Cultures
Experimental protocols were in compliance with federal guidelines for animal experimentation and were approved by the University of Kentucky Institutional Animal Care and Use Committee (IACUC). Dissociated primary cortical neuron cultures were established from E-18 rat embryos as previously described (Lovell et al., 2000a, et al., 2001). Studies were carried out on cells 7 days in culture by switching to Locke’s solution consisting of 1 mL of 154 mM NaCl, 5.6 mM KCl, 2.3 mM CaCl2, 1.0 mM MgCl2, 3.6 mM NaHCO3, 10 mM glucose, 5 mM HEPES (pH 7.2) with 10 mg/L gentamicin sulfate and treated with HHE (Cayman Chemical, Ann Harbor, MI, USA) at 1 μM, 10 μM, 25 μM, 50 μM, and 100 μM for increasing periods of time.
2.2 Cell Viability Studies
Cell viability was assessed by quantifying reduction of 3-(4,5-dimethylthiazol-2-yl)-2,5-diphenyltetrazodium bromide (MTT) as a measure of mitochondrial viability as previously described (Mosmann et al., 1983) or by counting the number of undamaged cortical neurons in premarked microscopic fields before treatment and at each time point (0, 3, 6, 12, and 24 hr) as previously described (Xie et al., 2000). Cells were identified as damaged by the presence of dendriditic beading and vacuolization of the cell body. A significant positive correlation (r = 0.97) was observed between levels of reduced MTT and cell counts.
2.3 Glucose transport assays
The effect of HHE on glucose uptake was assessed by treating cortical neurons 7 days in culture with 1 μM, 10μM, 25 μM, 50 μM, and 100 μM HHE for 6 hr and assessing glucose transport as described by Mark et al. (Mark et al., 1997). Briefly, cultures were switched to Locke’s with glucose and treated with HHE for 6 hr. Following treatment cultures were switched to Locke’s without glucose and 1 μCi of 14C labeled glucose added for 5 minutes. Cultures were washed 3X with PBS and immediately lysed by the addition of 200 μL of 0.5% SDS/0.5M NaOH. Blanks for glucose uptake assays included cultures treated with 10 μM phloretin prior to the addition of radio-labeled glucose. Protein content was determined in 10 μL aliquots of the lysate using the Pierce BCA method and counts per minute (CPM) were normalized to the total protein content for each individual sample. Results are expressed as mean ± SEM % of control and represent the mean of 5-6 dishes per each concentration per experiment and 3 separate experiments.
2.4 Brain Specimen Sampling
Tissue specimens from the HPG, SMTG, and CER of short post-mortem interval (PMI) autopsies of 7 LAD subjects (4M: 3W), 8 MCI subjects (3M: 5W), 10 PCAD subjects (1M: 9W) and 10 age-matched NC subjects (2M: 8W) were obtained through the Neuropathology Core of the University of Kentucky Alzheimer’s Disease Center (UK-ADC). Samples were flash frozen in liquid nitrogen and maintained at -80°C until used for analysis.
PCAD and NC subjects were followed longitudinally in the UK-ADC Normal Control Clinic and underwent neuropsychological testing, and physical and neurological examinations annually. All NC subjects had neuropsychological test scores in the normal range and showed no evidence of memory decline. Although there are not well defined criteria for the identification of PCAD subjects, the UK-ADC tentatively describes PCAD subjects as those with sufficient AD pathologic alterations at autopsy to meet intermediate or high NIA-RI criteria, moderate or frequent neuritic plaque scores according to the Consortium to Establish a Registry for AD (CERAD) with Braak scores of III-VI, and antemortem psychometric test scores in the normal range when corrected for age and education (Schmitt et al., 2000).
MCI subjects were normal on enrollment in the UK-ADC longitudinal study, but developed MCI during follow-up. Clinical criteria for diagnosis of amnestic MCI were those of Peterson et al. (Peterson et al., 1999) and included: (a) memory complaints corroborated by an informant, (b) abnormal memory impairment when corrected for age and education, (c) normal general cognitive function, (d) intact activities of daily living, and (e) does not meet criteria for dementia. AD subjects met both the clinical criteria for probable AD and standard histopathological criteria for the diagnosis of AD (McKhann et al., 1984; National Institute on Aging, 1997). Neuropathological examination of multiple sections of neocortex, hippocampus, entorhinal cortex, amygdala, basal ganglia, nucleus basalis of Meynert, midbrain, pons, medulla, and CER using the modified Bielschowsky stain, hematoxylin, and eosin stains, and Aβ and α-synuclein immunostains was performed for all subjects. Braak staging scores were determined using the Gallyas stain on sections of entorhinal cortex, hippocampus, and amygdala, the Bielschowsky stain on neocortex. Histopathological examination of NC subjects showed only age-associated changes and Braak staging scores of I-II. The Braak staging scores of MCI subjects ranged from III-IV. MCI subjects showed a significant increase in neuritic plaque density in neocortical regions and a significant increase in neurofibrillary tangle density in entorhinal cortex, hippocampus, and amygdala compared to NC subjects (Markesbery et al., 2006). PCAD subjects had moderate or frequent neuritic plaque scores with median Braak staging scores of III-IV. LAD subjects met accepted guidelines for the histopathologic diagnosis of AD with Braak staging scores = VI. Neuritic plaque counts and Braak staging scores were provided by the Neuropathology Core of the UKADC.
2.5 Measurement of Aβ and Aβ1-42 Levels
Total levels of Aβ and Aβ1-42 in specific fractions (detergent soluble and formic acid fractions) were provided by the Sanders Brown Amyloid Core (Dr. Paul Murphy) as previously described (Murphy et al., 2007).
2.6 Tissue Processing for HHE Quantification
Tissue samples were prepared as described by Fitzmaurice et al. (Fitzmaurice et al., 2006) with the following modification. Following tissue homogenization, 1 nmol of stable labeled benzaldehyde (d5-benzaldehyde) (CDN Isotopes, Pointe-Claire, Quebec, Canada) was added as an internal standard. For quality control blank, spiked, and duplicate analyses were carried out for representative samples from each brain region.
2.7 In vitro Oxidation of Docosahexaenoic Acid (DHA)
Docosahexaenoic acid (DHA) was oxidized as described by Kawai et al. (Kawai et al., 2006) with the following modifications. Briefly DHA (3 μmol) was oxidized at 37°C with Aβ1-40 (19 nM), or Aβ1-42 (19 nM) (Gift of Dr. Harry LeVine III), or iron (II) sulfate (10 mM) /ascorbic acid (1 mM) for 0, 2, 4, 8, or 24 hours in sodium phosphate buffer (pH 7.4). Following incubation, 1 nmol of d5-benzaldehyde was added as an internal standard. For quality control of in vitro oxidation of DHA, triplicate analyses were carried out for each treatment at each incubation time.
2.8 Aldehyde Derivatization and Gas Chromatography/Mass Spectrometry
Aldehydes were derivatized as described by Fitzmaurice et al. (Fitzmaurice et al., 2006) and transferred to GC autosampler vials. Derivatized samples were analyzed using an Agilent 7890A gas chromatograph on a HP-5ms capillary column (0.25-mm internal diameter, 0.25-μm film thickness, and 30-m length; Agilent, Santa Clara, CA, USA) as described by Fitzmaurice et al. (Fitzmaurice et al., 2006). Mass spectra of derivatized aldehydes were acquired using selective ion monitoring (SIM) at m/z ratios of 241 for HHE and 286 for d5-benzaldehyde. An instrument response plot of integrated peak area of unlabeled analyte signal (m/z = 241) was normalized to integrated peak area of internal standard (m/z = 286) signal as a function of unlabeled analyte over a range of 30 pmol to 1 nmol in both a tissue matrix and sodium phosphate buffer at pH 7.4 in triplicate. Plots of instrument response versus concentration showed a positive significant correlation for HHE (r = 0.99) in both the tissue matrix and sodium phosphate buffer at pH 7.4. The integrated area of analyte signal was normalized with respect to the integrated area of the corresponding internal standard for all samples.
2.9 Dot Blot Analysis
Total levels of protein-bound HHE were determined by dot blot immunochemistry using a Schleicher & Schuell Dot-Blot apparatus as described by Saiki et al. (Saiki et al., 1986) with the following modification. Blots were probed with 1:1500 dilution of primary mouse anti-HHE antibody (Genox, Baltimore, MD, USA) overnight at 4°C. Dots were visualized using enhanced chemiluminescence per manufacturer’s instructions and intensities quantified using Scion Image Analysis Software (Scion, Fredrick, MD, USA). The dot intensities of replicates were averaged and average dot intensities for PCAD, MCI, LAD, and NC subjects were normalized to mean NC levels for each blot. To verify the specificity of the HHE antibody used in this study, bovine serum albumin (BSA) was treated with HHE, HNE (Cayman Chemical), or acrolein (Sigma) for 16 hr at 37°C at a 1:1 molar ratio. Samples of HHE, HNE, or acrolein modified BSA were loaded in triplicate and subjected to dot blot analyses as described above using HHE antibody or HHE antibody pre-incubated with HHE. To determine a linear response of HHE immunoreactivity, BSA was treated with increasing concentrations of HHE or acrolein (3.12, 6.25, 12.5, and 25 μM) for 16 hr at 37°C and subjected to dot blot analyses as described above.
2.10 HHE Modified Protein Immunoprecipitation (IP)
To further verify HHE alterations in the CER we subjected representative LAD and NC CER specimens to immunoprecipitation of HHE modified proteins as previously described (Bonifacino et al., 2001) to determine if specific proteins showed increase HHE modification in LAD. Briefly, samples were homogenized in RIPA buffer (20 mM Tris HCl pH 7.5, 150 mM NaCl, 1 mM Na2EDTA, 1 mM EGTA, 1% NP-40, 1% sodium deoxycholate, 2.5 mM sodium pyrophosphate, 1 mM β-glycerophosphate, 1 mM sodium vanadate, 1 μg/mL leupetin, 1 mM phenylmethylsulfonyl fluride) and centrifuged at 100,000 × g for 1 hr at 4°C. Protein samples (150 μg) were incubated with 50 μL of rabbit serum overnight at 4°C followed by the addition of 100 μL of Protein A/G Sepharose (Calibiochem, Gibbstown, NJ, USA) slurry. The solution was then rotated for 1 hr at 4°C and the Protein A/G Sepharose complex was precipitated by centrifugation at 14,000 × g for 10 min at 4°C. The resulting pellet was washed 3X in lysis buffer. Pre-cleared protein solutions were then incubated and rotated with 5 μL of primary mouse anti-HHE antibody overnight at 4°C followed by the addition of 100 μL of Protein A/G Sepharose slurry. The solution was rotated for 4 hr at 4°C and the Protein A/G complex was precipitated by14,000 × g for 10 min at 4°C and the pellet washed 3X in lysis buffer. Samples were prepared for SDS-PAGE gel electrophoresis by the addition of 25 μL of SDS loading buffer to the resulting Protein A/G-IgG pellet and boiled for 5 min. Immunoprecipitated proteins were separated on a SDS-PAGE gel and the gel stained with coomassie blue. Bands differentially expressed in LAD subjects were sampled and subjected to trypsin digestion and MALDI mass spectrometry as previously described (Pocernich et al., 2005).
2.11 Protein Carbonyl Content
Protein carbonyl content was determined using an OxyBlot™ Protein Detection Kit per manufacturer’s instructions. Dots were visualized using enhanced chemiluminescence per manufacturer’s instructions and quantified using Scion Image Analysis Software (Scion, Fredrick, MD, USA). Dot intensity for each control derivatization was subtracted from the corresponding DNPH-derivatized samples. The dot intensities of replicates were averaged and average dot intensity for each PCAD, MCI, LAD, and NC subject was normalized to mean control levels for each blot.
2.12 In vitro HHE Modification of Albumin and Tau 441
To determine the relative reactivity of HHE with proteins of varying numbers of reactive amino acids, bovine serum albumin and tau 441 (3 μmol) were treated at 37°C with acrolein, HNE, or HHE (1 mM) for 0, 0.5, 1, 2, 4, or 8 hours in sodium phosphate buffer (pH 7.4). Total levels of protein-bound HHE were determined by dot blot immunochemistry using a Schleicher & Schuell Dot-Blot apparatus as described by Saiki et al. (Saiki et al., 1986). The dot intensities of replicates were averaged and average dot intensities for each treatment were normalized to mean 0 hr values for each respective protein.
2.13 Statistical Analysis
All data were tested for normality using the Wilkes-Shapiro test. Levels of extractable HHE in the HPG and CER and Braak staging scores were non-normally distributed. All other data demonstrated a normal distribution. Normalized dot blot values of protein-bound HHE and total protein carbonyl content, age, time dependent levels of extractable HHE expressed as pmol/μmol, time dependent levels of protein-bound HHE, levels of extractable HHE in the SMTG expressed as pmol/mg protein, and PMI were compared using ANOVA. Levels of extractable HHE in the HPG and CER and Braak staging scores were compared using the Mann-Whitney U-test and are reported as median values. All statistical comparisons were carried out using ABSTAT software (AndersonBell, Arvada, CO, USA). Statistical significance was set at P ≤ 0.05.
3. Results
Subject demographic data are shown in Table 1. There were no significant differences in PMI or age of subjects except for a significant (P < 0.05) increase in the age of MCI subjects (90.1 ± 2.1 y) compared to LAD subjects (80.9 ± 2.0 y). Median Braak staging scores were significantly (P < 0.05) higher for PCAD subjects (IV), MCI subjects (III), and LAD subjects (VI) compared to age-matched NC subjects (I).
Table 1.
Subject demographic data
| Group | Mean ± SEM age (years) | Sex | Mean ± SEM PMI (h) | Median Braak Score |
|---|---|---|---|---|
| NC | 85.4 ± 1.9 | N=10; 1M, 9W | 2.8 ± 0.2 | I |
| MCI | 90.1 ± 2.1* | N=8; 3M, 5W | 2.7 ± 0.2 | III* |
| PCAD | 86.0 ± 2.1 | N=10; 2M, 8W | 2.9 ± 0.2 | IV* |
| AD | 80.9 ± 2.0 | N=7; 4M, 3F | 3.3 ± 0.2 | VI* |
P < 0.05
NC = normal control; PCAD = preclinical Alzheimer’s disease; MCI = Mild Cognitive Impairment; AD = Alzheimer’s disease; PMI = postmortem interval; SEM = standard error of the mean
To assess the specificity of the HHE antibody used in this study, BSA was treated with HHE, HNE, or acrolein and subjected to dot blot analysis using HHE antibody with or without pre-incubation with HHE. The HHE antibody only recognized HHE modified BSA (Fig. 1A) and pre-incubation of the HHE antibody with HHE blocked immunoreactivity (Fig. 1B). Figs. 1C and 1D show a statistically significant linear response between immunostaining and increasing HHE levels (r = 0.94, P < 0.05).
Figure 1.
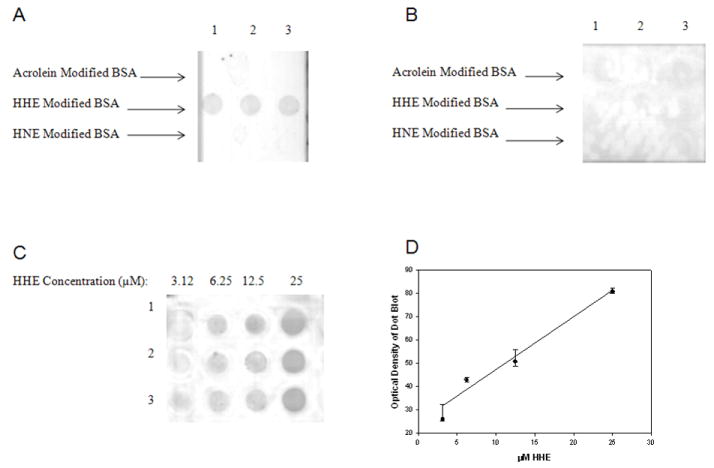
Specificity of mouse monoclonal antibody against HHE. Acrolein modified BSA loaded in triplicate in Row 1, HHE modified BSA loaded in triplicate in Row 2, and HNE modified BSA loaded in triplicate in Row 3 incubated with anti-HHE (A) or with anti-HHE pre-incubated with HHE (B). Figure 1C shows representative dot blots of HHE modified BSA with increasing HHE concentrations (3.125, 6.25, 12.5, and 25 μM). Each modified BSA sample was loaded in triplicate. Figure 1D shows a linear response between HHE concentration and immunochemical response (r = 0.94, P < 0.05).
Median extractable HHE levels were significantly (P ≤ 0.05) higher in the HPG of PCAD subjects (15.4 pmol/mg protein) and LAD subjects (24.0 pmol/mg protein) compared to NC subjects (11.3 pmol/mg protein) (Fig. 2A). There were no significant changes in the level of extractable HHE in the HPG of MCI subjects (13.7 pmol/mg protein) compared to NC subjects (11.3 pmol/mg protein). No significant changes were observed in levels of extractable HHE in the SMTG of MCI subjects (5.3 ± 1.3 pmol/mg protein), PCAD subjects (9.1 ± 2.1 pmol/mg protein) or LAD subjects (4.9 ± 0.9 pmol/mg protein) compared to NC subjects (9.5 ± 1.4 pmol/mg protein) (Fig. 2B). Median levels of extractable HHE were not significantly altered in the CER of MCI subjects (3.4 pmol/mg protein) or PCAD subjects (6.9 pmol/mg protein) compared to NC subjects (5.3 pmol/mg protein) (Fig. 2C) although levels of extractable HHE in the CER of LAD subjects (23.1 pmol/mg protein) were significantly (P < 0.01) elevated compared to MCI subjects (3.4 pmol/mg protein), PCAD subjects (6.9 pmol/mg protein), and NC subjects (5.3 pmol/mg protein) (Fig. 2C). In general, levels of extractable HHE tended to be higher in HPG compared to other areas studied in the each subject group, except LAD subjects. Levels of extractable HHE were significantly (P < 0.05) higher in HPG compared to CER in MCI, PCAD, and NC subject populations. There was no significance difference in the level of extractable HHE in HPG compared to the CER in LAD subjects.
Figure 2.
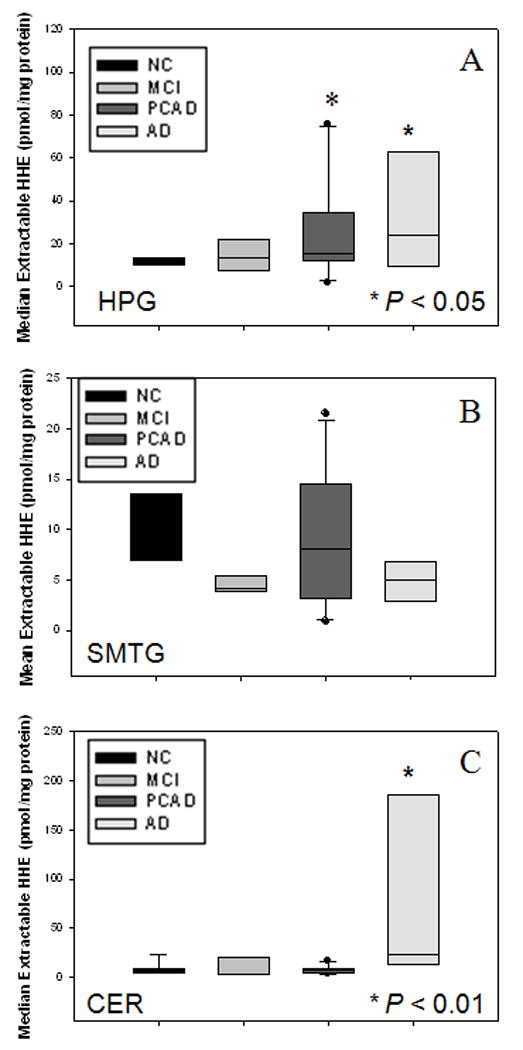
(A) Levels of extractable HHE expressed as nmol/mg of protein in HPG of NC, MCI, PCAD, and LAD subjects. There was a significant (P ≤ 0.05) increase in the level of extractable HHE in HPG of PCAD and LAD subjects compared to NC subjects. No significant difference was observed in the level of extractable HHE in HPG of MCI subjects compared to NC subjects. (B) Levels of extractable HHE expressed as nmol/mg of protein in SMTG of NC, MCI, PCAD, and LAD subjects. There was no significant difference in levels of extractable HHE in SMTG of MCI, PCAD, or AD subjects compared to NC subjects. (C) Levels of extractable HHE expressed as nmol/mg protein in CER of NC, MCI, PCAD, and LAD subjects. There was a significant (P > 0.01) elevation in CER of LAD subjects compared to NC, MCI, and PCAD subjects. No significant changes were observed in the level of extractable HHE in CER of MCI or PCAD subjects compared to NC subjects.
Similar to levels of extractable HHE in the HPG, levels of protein-bound HHE were significantly (P ≤ 0.05) increased in the HPG of MCI subjects (135.1 ± 13.3% NC), PCAD subjects (169.7 ± 27.8% NC), and LAD subjects (150.6 ± 22.8% NC) compared to NC subjects (100 ± 14.2% NC) (Fig. 3A). Protein-bound HHE was elevated in the SMTG of MCI (123.0 ± 12.1%) and LAD (125.3 ± 11.8%) subjects compared to NC subjects (100.0 ± 4.6%) although the difference was not statistical significant. No significant changes in levels of protein-bound HHE in the SMTG or CER of MCI, PCAD, or LAD subjects compared to NC subjects (Figs. 3B, 3C) were observed. Additionally, protein carbonyls were not significantly different in the HPG, SMTG, or CER for any subject group studied (Figs. 3A-C).
Figure 3.
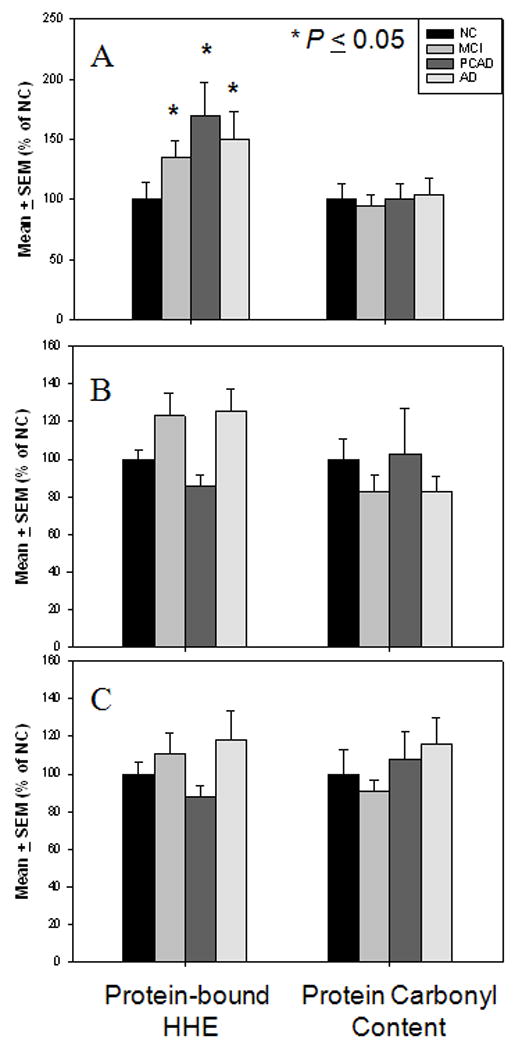
Levels of protein-bound HHE and protein carbonyl content expressed as mean ± SEM (% NC). (A) Levels of protein-bound HHE and protein carbonyl content in HPG of NC, MCI, PCAD, and LAD subjects. There was a significant (P ≤ 0.05) elevation in protein-bound HHE in HPG of MCI, PCAD, and LAD subjects compared to NC subjects. No significant changes were observed in levels protein carbonyl content in any disease in the HPG. (B) Levels of protein-bound HHE and protein carbonyl content in SMTG of NC, MCI, PCAD, and LAD subjects. No significant changes were observed in either levels protein-bound HHE or protein carbonyl content in any disease stage in the SMTG. (C) Levels of protein-bound HHE and protein carbonyl content in CER of NC, MCI, PCAD and LAD subjects. No significant changes were observed in levels of protein-bound HHE or protein carbonyl content in any disease stage in the CER.
To determine if HHE levels correlated with neuropatholigcal parameters, levels of extractable HHE and protein-bound HHE in the HPG, SMTG, and CER were correlated with Braak staging scores and neuritic plaque counts in the SMTG and the CA1/subiculum of the HPG. Additional correlations analyses were carried out between levels of extractable and protein-bound HHE and Aβ1-42 in detergent and formic acid soluble fractions of the HPG, SMTG, and CER. Correlation of Braak staging scores and levels of extractable (r = 0.31 P = 0.08) and protein-bound HHE (r = 0.33 P = 0.08) in the HPG trended toward significance. A significant correlation was observed between Braak staging scores and extractable HHE (r = 0.35 P = 0.05) in the CER. No significant correlations were observed between levels of extractable or protein bound HHE and Braak staging scores in the SMTG. Additionally, no significant correlations were observed between the levels of either extractable or protein-bound HHE and either total Aβ and Aβ1-42 in the HPG, SMTG, or CER.
Primary cortical neuron survival showed a significant positive correlation between MTT reduction and cell counts (r = 0.97). Comparison of survival data showed a significant decrease (P < 0.05) in cell viability at 16 hr when treated with 25 μM HHE (52.6 ± 15.6%) and 50 μM (11.0 ± 1.3%) compared to control cultures (100.0 ± 1.8%). Treatment of primary cortical neuron cultures with HHE lead to a time- and concentration-dependent decrease in cell survival (Fig 5A) although, survival of cultures was not significantly altered for any concentrations of HHE at 3 and 6 hrs. Treatment of primary cortical neurons for 6 hr with HHE over a range of 0 to 100 μM of HHE resulted in no visible vacuolization of cell bodies or extensive neurite fragmentation (Fig. 5B-G). In contrast, treatment with HHE at these levels led to a concentration dependent decrease in glucose uptake. Treatment with 25 μM (82.8 ± 3.0%), 50 μM (73.9 ± 3.1%), and 100 μM (49.4 ± 2.2%) HHE lead to significantly (P < 0.001) decreased glucose uptake in cultures compared to control cultures (100.0 ± 3.7%) (Fig. 5H).
Levels of extractable HHE from in vitro oxidation of DHA treated with Aβ1-40, Aβ1-42, or iron (II)/ascorbic acid are shown in Table 2. Levels of extractable HHE from oxidized DHA were significantly (P < 0.05) higher at 24 hr incubation for all treatments. Levels of extractable HHE generated from the treatment of DHA with Aβ1-40 (10,491.4 ± 499.3 pmol/μmol DHA) and Aβ1-42 (11,951.1 ± 637.6 pmol/μmol DHA) at 24 hr were comparable to those resulting from treatment with a strong oxidizing system, iron (II)/ascorbic acid (10,796.4 ± 285.8 pmol/μmol DHA).
Table 2.
Mean ± SD extractable HHE (pmol/μmol DHA) generated through in vitro oxidation of DHA.
| Time (h) | 0 | 2 | 4 | 8 | 24 |
|---|---|---|---|---|---|
| Oxidant | |||||
| Aβ1-40 | 4.0 ± 0.6 | 1,846.0 ± 87.9* | 1,816.0 ± 68.3* | 2,299.6 ± 28.4* | 10,491.4 ± 499.3* |
| Aβ1-42 | 3.4 ± 0.4 | 381.9 ± 60.6* | 1,873.6 ± 35.6* | 2,386.5 ± 8.0* | 11,951.1 ± 637.6* |
| Ascorbic Acid/Iron (II) | 7.4 ± 0.1 | 2,110.6 ± 58.7* | 2,387.1 ± 106.3* | 2,686.2 ± 4.4* | 10,796.4 ± 285.8* |
P ≤ 0.05.
Immunoprecipitation of HHE positive proteins from CER of representative LAD (n = 3) subjects compared to NC subjects (n =3) showed 6 distinctive proteins bands that were elevated in LAD specimens. Differentially expressed bands were elevated ~15% in LAD CER compared to NC CER specimens and included: α-2-macroglobulin and myomesin-1 at ~ 19 kDA, gelsolin, glucogen phosphorylase, and lactotransferrin at ~115 kDa, glyceraldehydes-3-phosphate dehyrogenase, L-lactate dehyrogenase, pyruvate dehyrogenase E1 (β subunit), malate dehyrogenase, guanine nucleotide-binding protein (α subunit), apolipoprotien E, and aldose reductase at ~30 kDa, myelin proteolipid protein, ubiquitin carboxyl-terminal hyrolase isozyme, apolipoprotein A-I, ATP synthase (subunit b), glutathione S-transferase, and heat shock protein (β1) at ~24 kDa, cytochrome c oxidase (subunit 2), proteasome subunit (β type-2, type-5, and type-6), retinol-binding protein, peptidyl-prolyl cis-trans isonmerase, and heat shock protein (β1) at ~20 kDa, and hemoglobin subunit (α, β, and δ), fatty acid binding protein, and ATP synthese (subunit e) at ~15 kDa.
4. Discussion
Determining the pathogenesis of Alzheimer’s disease is critical for advancements in the field, yet difficult. Although earlier studies focused on changes of markers of oxidative damage in the brain of late stage AD subjects, analysis of brain specimens from subjects in earlier stages of disease progression are critical to determine the role of oxidative damage in the pathogenesis of AD. The current study incorporated tissue specimens from longitudinally followed, well characterized NC, MCI, PCAD, and LAD subjects with short postmortem intervals. MCI and PCAD subjects represent distinct intermediate stages between normal aging and LAD. While PCAD subjects retain cognitive function in the presence of pronounced AD neuropathology, MCI subjects present with cognitive impairment in a clinical environment. Based on imaging studies it is hypothesized that had PCAD subjects lived longer they would have developed AD (Smith et al., 2008).
The present study shows levels of extractable HHE are significantly increased in the HPG of PCAD and LAD subjects, and the CER of LAD subjects. Significant elevations in the HPG, an area vulnerable to early AD associated pathology, suggest that the extent of associated pathology and levels of extractable HHE are related. Additionally, levels of extractable HHE were significantly elevated in HPG of MCI, PCAD, and NC subject populations compared to measured levels in the CER. Similarly there were significant elevations in the level of protein-bound HHE in the HPG of MCI, PCAD, and LAD subjects compared to NC subjects. Elevations of protein-bound HHE in the HPG of MCI and PCAD subjects and extractable HHE in the HPG of PCAD subjects suggest that lipid peroxidation of the ω-6 PUFA is an early event in the pathogenesis of AD. It remains to be determined if additional markers of oxidative damage including, RNA or nuclear/mitochondrial DNA are also elevated in these subject populations. While these studies were carried out in bulk brain tissue rather than a homogenous population of neurons, previous immunohistochemical studies indicate related α,β-unsaturated aldehydes generated from peroxidation of DHA and ARA (HNE and acrolein) are largely associated with neurons (Calingansan et al., 1999; Montine et al., 1997). Additionally, Long et al. demonstrated that HHE-modified proteins were localized in the nuclear/perinuclear area of primary cortical neurons (Long et al., 2008).
Previous studies utilizing the same tissue preparation and analytical methods in our laboratory showed median levels of extractable acolein were comparable to previous studies that made use of straight chain aldehydes (heptanal and octanal) as internal standards and LC/MS (Bradley et al., 2010) and levels of extractable HNE were comparable to those reported by Fitmaurice et al. (Fitzmaurice et al., 2006). The current study is the first to quantify levels of extractable HHE in the NC, MCI, PCAD, and AD brain by GC/MS/SIM using a deuterated internal standard, d5-benzaldehyde.
It remains unclear why we observed a significant elevation in the level of extractable HHE in the CER of LAD subjects. While the CER has long been considered an internal control due to minimal neuropathology, recent studies suggest that disease related changes do occur in the CER. Large numbers of diffuse amyloid plaques in the molecular layer of the cerebellar cortex of AD subjects were visualized by Braak et al. (Braak et al., 1989) and Yamaguchi et al. (Yamaguchi et al., 1989). Additionally, Wegiel et al. (Wegiel et al., 1999) documented a significant decrease in the volume of the molecular and granular layers of LAD subjects compared to NC subjects further supported by a more recent MRI imaging study by Thomann et al. (Thomann et al., 2008) who found shrinkage of the posterior cerebellar regions associated with poorer cognitive performance in AD subjects relative to NC subjects. Levels of extractable HHE in the CER of subjects were normally distributed in the NC, MCI, and PCAD subject population, but were non-normally distributed in LAD subjects. Within the LAD group two subjects exhibited significantly elevated levels of HHE compared to the five other LAD subjects suggesting that the changes in the cerebellum may be more variable consistent with more variable pathology in the area. It should be noted that duplicate and spike analyses of CER samples from LAD subjects was conducted simultaneously and were consistent with other data. Additionally, CER samples from LAD and MCI subjects were analyzed during the same period of time. Interestingly, a significant correlation between the level of extractable HHE in CER and Braak staging scores was observed. Previous studies of fatty acid composition of rat brain showed the CER has an increased abundance of DHA relative to neocortical brain regions (Siesjo et al., 1982). Our observation of increased HHE in CER is consistent with elevated levels of DHA in CER.
Although we observed elevated extractable HHE in CER we did not observe elevated total protein-bound HHE observed in the CER. It is possible that HHE has reduced reactivity with proteins in CER. Preliminary proteomics studies of immunoprecipitated HHE modified proteins identified several proteins that were differentially HHE modified in LAD CER specimens. These preliminary findings suggest that HHE modification of proteins is targeted based on amino acid composition. To investigate whether amino acid composition affects HHE reactivity, bovine serum albumin (BSA) and tau 441 were incubated with HHE and the degree of HHE immunoreactivity determined. Both BSA and tau 441 have comparable numbers of lysine residues and histidine residues, (48/14 and 43/11 respectively) but a large disparity between the number of cysteine residues (BSA – 31; Tau 441 – 1). Dot blot analysis showed that levels of HHE modified albumin (444.3 ± 2.2%) were significantly (P > 0.05) elevated compared to levels of HHE modified tau 441 (122.5 ± 2.3%) at 8 hr.
Correlations of extractable and protein-bound HHE and levels of both total Aβ and Aβ1-42 or neuritic plaque counts were not significant in the HPG, SMTG, or CER of any subject group. These findings are consistent with previous studies of acrolein and HNE (Bradley et al., 2010) in the same PCAD and NC subjects. The lack of correlation between HHE levels and measures of amyloid burden suggest that other oxidants, including iron, may be more relevant in the oxidation of DHA. The lack of correlation is unexpected considering comparable levels of extractable HHE were generated in vivo from DHA oxidation by treatment both Aβ1-42 and Aβ1-40 species and iron (II)/ascorbic acid, a strong oxidizing system.
Previous studies have indicated that aldehydric lipid peroxidation by-products, specifically HNE, are effectors in the formation the primary sequence (TG-5) of tau (Liu et al., 2005; Perez et al., 2000, et al., 2002; Takeda et al., 2000; Wataya et al., 2002; Zambrano et al., 2004). In a more recent study, Liu et al. demonstrated that antibodies recognizing phosphoepitopes (PHG-1, TG-4, and MCI15) and conformation-dependent eipitopes (MC1, Alz-50, and TG-3) of tau share enhanced recognition following HNE modifications of tau. Additionally, HNE has been shown to facilitate the formation of paired helical filament (PHF) like structures of phosphorylated tau in vitro and in vivo (Perez et al., 2000, et al., 2002). It remains unclear if additional α, β-unsaturated aldehydes generated via lipid peroxidation may also effect the formation of NFTs or if levels of extractable and/or protein-bound HHE are correlated to levels of multiple tau phospho and conformation-depenedent epitopes.
Cellular disruption attributed to α,β-unsaturated aldehydic by-products is the result of Michael addition reactions with key amino acids lysine, cysteine, and histidine (LoPachin et al., 2009). While HHE, HNE, and acrolein are all members of the α, β-unsaturated family HNE and acrolein are considered more reactive resulting in more severe and extensive disruption of homeostasis. Yet, multiple studies have demonstrated that HHE, like HNE and acrolein leads to adverse cellular events (Chen et al., 1995; Je et al., 2004; Kristal et al., 1996; Lee et al., 2004a; Lee et al., 2004b; Long et al., 2008). HHE at femtamolar concentrations has been shown to induce the mitochondrial permeability transition pore (PTP) in mitochondria isolated from livers of male rats (Kristal et al., 1996). Induction of reversible PTP by HHE results in the loss of the proton gradient as well as the ability to carry out oxidative phosphorylation. Addition of thiol reagents, dithiothreitol or glutathione, which commonly prevent induction of the PTP, was ineffective in preventing HHE induction of the PTP. Treatment of mitochondria isolated from livers of male rats with HHE resulted in a significant decrease in the activity of adenine nucleotide translocator (ANT), which is located on the inner mitochondrial membrane, and is responsible for translocation of ADP and ATP (Chen et al., 1995). In the current study, treatment of cortical neuron cultures with increasing concentrations of HHE resulted in a time and concentration dependent cell death consistent with previous reported LD50’s by Long et al. (Long et al., 2008). While treatment of cortical neuron cultures with increasing concentrations of HHE for 6 hours did not affect cellular viability as assessed by cell morphology or MTT reduction, treatment with increasing concentrations of HHE did result in a concentration dependent decrease in glucose uptake at concentrations greater than the LD50 reported by Long et al. (Long et al., 2008). However, deleterious effects of HHE are not limited to the mitochondria. Rapid depletion of glutathione (GSH) content was observed in primary cortical cells treated with HHE following 1 hr exposure (Long et al., 2008). Treatment of endothelial cell cultures with HHE has been shown to result in the induction of inducible endothelial nitric oxide synthase (iNOS) by transcriptional regulation the nuclear factor κB (NF-κB) leading to activation of various proinflammatory genes (Je et al., 2004; Lee et al., 2004a). Lee et al. have also shown that treatment of endothelial cultures with HHE results in apoptosis mediated via Bax accompanied by a decrease in anti-apoptotic Bcl-2 (Lee et al., 2004b).
Overall this study suggests lipid peroxidation occurs early in the progression of AD further supporting the hypothesis that oxidative stress is an early even in the pathogenesis of AD.
Figure 4.
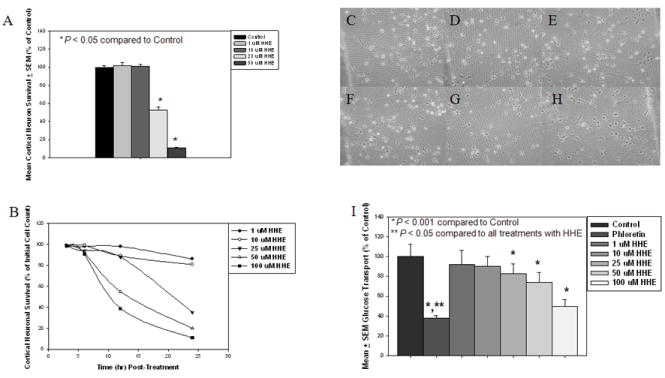
(A) Survival of primary cortical neurons in response to treatment with 4-hydroxyhexenal (HHE) at 1 μM, 10 μM, 25 μM, and 50 μM for 16 hr by the reduction of reduction of 3-(4,5-dimethylthiazol-2-yl)-2,5-diphenyltetrazodium bromide (MTT). Survival was significantly reduced (P < 0.05) at 16 hr when treated with 25 μM and 50 μM HHE compared to control cultures. (B) Survival of primary cortical neurons in response to treatment with 4-hydroxyhexenal (HHE) as assessed by cell counts at 0, 3, 6, 12, and 24 hr in response to increasing concentrations of HHE treatment (1, 10, 25, 50, and 100 μM). A time and concentration dependent decrease in cell survival was observed with HHE treatment. Phase Contrast micrographs of primary cortical neurons at 6 hr incubation period with increasing concentration of HHE: (C) Control cultures, (D) Cultures treated with 1 μM HHE, (E) Cultures treated with 10 μM HHE, (F) Cultures treated with 25 μM HHE, (G) Cultures treated with 50 μM HHE, and (H) Cultures treated with 100 μM HHE. Absence of vacuolization of cell bodies and extensive neurite fragmentation indicates that no concentration of HHE at 6 hr incubation resulted in cell death. (H) Glucose uptake in primary cortical cultures treated with increasing concentrations of HHE (0, 1, 10, 25, 50, 100 μM of HHE) for 6 hrs or with phloretin for 1 hr. Treatment with 25, 50, and 100 μM of HHE resulted in a significant (P < 0.001) decrease in glucose uptake compare to control cultures. Uptake of glucose in cultures treated with phloretin was significantly (P < 0.05) decreased compared to control cultures and cultures treated with all concentrations of HHE.
Acknowledgments
This research was supported by NIH grants 5P01-AG05119 and P30-AG028383. The authors thank Ms. Sonya Anderson for subject demographic data, Ms. Paula Thomason for editorial assistance, the UKADC Neuropathology Core for histopathological data, Dr. Paul Murphy and the UK Amyloid Core for Aβ measurements, and Dr. Bert C. Lynn of UK Mass Spectrometry Facility for MALDI mass spectrometry.
Footnotes
Conflict of Interest The authors have no conflicts of interest.
Publisher's Disclaimer: This is a PDF file of an unedited manuscript that has been accepted for publication. As a service to our customers we are providing this early version of the manuscript. The manuscript will undergo copyediting, typesetting, and review of the resulting proof before it is published in its final citable form. Please note that during the production process errors may be discovered which could affect the content, and all legal disclaimers that apply to the journal pertain.
References
- Bonifacino JS, et al., editors. Current Protocols in Immunology. New York: John Wiley; 2001. [Google Scholar]
- Braak H, Braak E, Bohl J, Lang W. Alzheimer’s disease: amyloid plaques in the cerebellum. J Neurol Sci. 1989;93:277–287. doi: 10.1016/0022-510x(89)90197-4. [DOI] [PubMed] [Google Scholar]
- Bradley MA, Markesbery WR, Lovell MA. Increase levels of 4-hydroxynonenal and acrolein in the brain in preclinical Alzheimer’s disease (PCAD) Free Radic Biol Med In Press. 2010 doi: 10.1016/j.freeradbiomed.2010.02.016. [DOI] [PMC free article] [PubMed] [Google Scholar]
- Butterfield DA, Reed T, Perluigi M, De Marco C, Coccia R, Cini C, Sultana R. Elevated protein-bound levels of the lipid peroxidation product, 4-hydroxy-2-noenal, in brain from persons with mild cognitive impairment. Neurosci Lett. 2006;397:170–173. doi: 10.1016/j.neulet.2005.12.017. [DOI] [PubMed] [Google Scholar]
- Calingansan NY, Uchida K, Gibson GE. Protein-bound acrolein: a novel marker of oxidative stress in Alzheimer's disease. J Neurochem. 1999;72:751–756. doi: 10.1046/j.1471-4159.1999.0720751.x. [DOI] [PubMed] [Google Scholar]
- Chen JJ, Bertrand H, Yu BP. Inhibition of adenine nucleotide translocator by lipid peroxidation products. Free Radic Biol Med. 1995;19:583–590. doi: 10.1016/0891-5849(95)00066-7. [DOI] [PubMed] [Google Scholar]
- Ding Q, Markesbery WR, Cecarini V, Keller JN. Decreased RNA, and increased RNA oxidation, in ribosomes from early Alzheimer’s disease. Neurochem Res. 2006;31:705–710. doi: 10.1007/s11064-006-9071-5. [DOI] [PubMed] [Google Scholar]
- Ding Q, Markesbery WR, Chen Q, Keller JN. Ribosome dysfunction Is an early event in Alzheimer's disease. J Neurosci. 2005;25:9171–9175. doi: 10.1523/JNEUROSCI.3040-05.2005. [DOI] [PMC free article] [PubMed] [Google Scholar]
- Drake J, Petroze R, Castegna A, Ding Q, Keller JN, Markesbery WR, Lovell MA, Butterfield DA. 4-Hydroxynonenal oxidatively modifies histones: implications for Alzheimer’s disease. Neurosci Lett. 2004;356:155–158. doi: 10.1016/j.neulet.2003.11.047. [DOI] [PubMed] [Google Scholar]
- Fitzmaurice PS, Junchao T, Yazdanpanah M, Liu PP, Kalasinsky KS, Kish SJ. Levels of 4-hydroxynonenal and malondialdehyde are increased in brain of human chronic users of methamphetamine. J Pharmacol Exp Ther. 2006;319:703–709. doi: 10.1124/jpet.106.109173. [DOI] [PubMed] [Google Scholar]
- Gabbit SP, Lovell MA, Markesbery WR. Increased nuclear DNA oxidation in the brain in Alzheimer’s disease. J Neurochem. 1998;71:2034–2040. doi: 10.1046/j.1471-4159.1998.71052034.x. [DOI] [PubMed] [Google Scholar]
- Je HH, Lee JY, Jung KJ, Sung B, Go EK, Yu BP, Chung HY. NF-kB activation mechanism of 4-hydroxyhexenal via NIK/IKK and p38 MAPK pathway. FEBS Lett. 2004;566:183–189. doi: 10.1016/j.febslet.2004.04.037. [DOI] [PubMed] [Google Scholar]
- Kawai Y, Fujii H, Okada M, Tsuchie U, Uchida K, Osawa T. Formation of nepsilon- (succinyl)lysine in vivo: a novel marker for docosahexaenoic acid-derived protein modification. J Lipid Res. 2006;47:1386–1398. doi: 10.1194/jlr.M600091-JLR200. [DOI] [PubMed] [Google Scholar]
- Kristal BS, Park BK, Yu BP. 4-Hydroxyhexenal is a potent inducer of the mitochondrial permeability transition. J Biol Chem. 1996;271:6033–6038. doi: 10.1074/jbc.271.11.6033. [DOI] [PubMed] [Google Scholar]
- Lee J, He J, Jung H, Yu KJ, Yu BP, Chung HY. Induction of endothelial iNOS by 4- hydroxyhexenal through NF-kB activation. Free Radic Biol Med. 2004a;37:539–548. doi: 10.1016/j.freeradbiomed.2004.05.011. [DOI] [PubMed] [Google Scholar]
- Lee JY, Je JH, Kim DH, Chung SW, Zou Y, Kim ND, Yoo MA, Baik HS, Yu BP, Chung HY. Induction of endothelial apoptosis by 4-hydroxyhexenal. Eur J Biochem. 2004b;271:1339–1347. doi: 10.1111/j.1432-1033.2004.04042.x. [DOI] [PubMed] [Google Scholar]
- Lim SY, Doherty JD, Salem N., Jr Lead exposure and (n-3) fatty acid deficiency during rat neonatal development alter liver, plasma, and brain polyunsaturated fatty acid composition. J Nutr. 2005;135:1027–1033. doi: 10.1093/jn/135.5.1027. [DOI] [PubMed] [Google Scholar]
- Liu Q, Smith MA, Avila J, DeBernardis J, Kansal M, Takeda A, Zhu X, Nunomura A, Honda K, Moreira PI, Oliveria CR, Santos MS, Shimohama S, Aliev G, de la Torre J, Ghanbari HA, Siedlak SL, Harris PLR, Sayre LM, Perry G. Alzheimer-specific epitopes of tau represent lipid peroxidation-induced conformations. Free Radic Bio Med. 2005;38:746–754. doi: 10.1016/j.freeradbiomed.2004.11.005. [DOI] [PubMed] [Google Scholar]
- Long EK, Murphy TC, Leiphon LJ, Watt J, Morrow JD, Milne GL, Howard JRH, Picklo MJ., Sr Trans-4-hydroxy-2-hexenal is a neuroxic product of docosahexaenoic (22:6; n-3) acid oxidation. J Neurochem. 2008;105:714–724. doi: 10.1111/j.1471-4159.2007.05175.x. [DOI] [PubMed] [Google Scholar]
- LoPachin RM, Gavin T, Petersen DR, Barber DS. Molecular mechanisms of 4-hydroxy-2-nonenal and acrolein toxicity: nucleophilic targets and adduct formation. Chem Res Toxicol. 2009;22:1499–1508. doi: 10.1021/tx900147g. [DOI] [PMC free article] [PubMed] [Google Scholar]
- Lovell MA, Gabbita SP, Markesbery WR. Increase DNA oxidation and decreased levels of repair products in Alzheimer’s Disease ventricular CSF. J Neurochem. 1999;72:771. doi: 10.1046/j.1471-4159.1999.0720771.x. [DOI] [PubMed] [Google Scholar]
- Lovell MA, Xie C, Makresbery WR. Acrolein, a product of lipid peroxidation, inhibits glucose and glutamate uptake in primary neuronal cultures. Free Radic Biol Med. 2000a;29:714–720. doi: 10.1016/s0891-5849(00)00346-4. [DOI] [PubMed] [Google Scholar]
- Lovell MA, Xie C, Makresbery WR. Decreased base excision repair and increased helicase activity in Alzheimer’s disease brain. Brain Res. 2000b;855:166–173. doi: 10.1016/s0006-8993(99)02335-5. [DOI] [PubMed] [Google Scholar]
- Lovell MA, Xie C, Markesbery WR. Decreased glutathione transferase activity in brain and ventricular fluid in Alzheimer’s disease. Neurology. 1998;51:1562–1566. doi: 10.1212/wnl.51.6.1562. [DOI] [PubMed] [Google Scholar]
- Lovell MA, Xie C, Markesbery WR. Acrolein is increased in Alzheimer’s disease brain and is toxic to primary hippocampal cultures. Neurobiol Aging. 2001;22:187–194. doi: 10.1016/s0197-4580(00)00235-9. [DOI] [PubMed] [Google Scholar]
- Mark RJ, Pang Z, Geddes JW, Uchida K, Mattson MP. Amyloid beta-peptide impairs glucose transport in hippocampal and cortical neurons: involvement of membrane lipid peroxidation. J Neurosci. 1997;17:1046–1452. doi: 10.1523/JNEUROSCI.17-03-01046.1997. [DOI] [PMC free article] [PubMed] [Google Scholar]
- Markesbery WR, Kyyscio RJ, Lovell MA, Morrow JD. Lipid Peroxidation is an early event in the brain in amnestic mild cognitive impairment. Ann Neurol. 2005;58:730–735. doi: 10.1002/ana.20629. [DOI] [PubMed] [Google Scholar]
- Markesbery WR, Lovell MA. Four-Hydroxynonenal, a product of lipid peroxidation, is increased in the brain in Alzheimer’s disease. Neurobiol Aging. 1998;19:33–36. doi: 10.1016/s0197-4580(98)00009-8. [DOI] [PubMed] [Google Scholar]
- Markesbery WR, Schmitt FA, Kryscio RJ, Davis DG, Smith CD, Wekstein DR. Neuropathological Substrate of Mild Cognitive Impairmentq. Arch Neurol. 2006;63:38–46. doi: 10.1001/archneur.63.1.38. [DOI] [PubMed] [Google Scholar]
- McGarth LT, McGleenon BM, Brennan S, McColl D, McIlroy S, Passmore AP. Increased oxidative stress in Alzheimer’s disease as assessed with 4-hydroxynonenal but not malondialdehyde. Q J Med. 2001;94:385–490. doi: 10.1093/qjmed/94.9.485. [DOI] [PubMed] [Google Scholar]
- McKhann G, Drachman D, Folstein M, Katzman R, Price D, Stadlan EM. Clinical diagnosis of Alzheimer’s disease: report of the NINCDS-ADRDA Work Gorup under the auspices of the Department of Health and Human Services Task Dorce on Alzheimer’s disease. Neurology. 1984;34:939–944. doi: 10.1212/wnl.34.7.939. [DOI] [PubMed] [Google Scholar]
- Mecocci P, MacGarvey U, Beal MF. Oxidative damage to mitochondrial DNA is increased in Alzheimer’s disease. ANA. 1994;36:747–751. doi: 10.1002/ana.410360510. [DOI] [PubMed] [Google Scholar]
- Montine KS, Olson SJ, Amarnath V, Whetsell WO, Graham DG, Montine TJ. Immunohistochemical Detection of 4-Hydroxy-2-Nonenal Adducts in Alzheimer’s Disease Is Associated with Inheritance of APOE4. Am J Pathol. 1997;150:437–443. [PMC free article] [PubMed] [Google Scholar]
- Mosmann T. Rapid colorimetric assay for cellular growth and survival: application to proliferation and cytotoxicity assays. J Immunol Methods. 1983;65:55–63. doi: 10.1016/0022-1759(83)90303-4. [DOI] [PubMed] [Google Scholar]
- Murphy MP, Beckett TL, Ding Q, Patel E, Markesbery WR, St Clair DK, LeVine H, III, Keller JN. A-beta solubility and deposition during AD progression and in APP x PS-1 knock-in mice. Neruobiol Dis. 2007;27:301–311. doi: 10.1016/j.nbd.2007.06.002. [DOI] [PubMed] [Google Scholar]
- National Insitute on Aging. Consensus recommendations for the postmortem diagnosis of Alzheimer’s disease. Neurobiology of Aging. 1997;18:S1–S2. [PubMed] [Google Scholar]
- Nunomura A, Perry G, Aliev G, Hirai K, Takeda A, Balraj EK. Oxidative damage is the earliest even in Alzhiemer’s disease. J Neuropathol Exp Neurol. 2001;60:759–767. doi: 10.1093/jnen/60.8.759. [DOI] [PubMed] [Google Scholar]
- Pawlosky RJ, Bacher J, Salem N., Jr Ethanol consumption alters electroretinograms and depletes neural tissues of docosahexaenoic acid in rhesus monkeys: nutritional consequences of low n-3 fatty acid diet. Alcohol Clin Exp Res. 2001;25:1758–1765. [PubMed] [Google Scholar]
- Perez M, Cuadros R, Smith MA, Perry G, Avila J. Phosphorylated, but not native, tau protein assembles following reaction with lipid peroxidation product, 4-hydroxy-2-nonenal. FEBS Lett. 2000;486:270–274. doi: 10.1016/s0014-5793(00)02323-1. [DOI] [PubMed] [Google Scholar]
- Perez M, Hernandez F, Gomez-Ramos A, Smtih M, Perry G, Avila J. Formation of aberrant phosphotau fibrillar polymers in neural cells. Eur J Biochem. 2002;269:1484–1489. doi: 10.1046/j.1432-1033.2002.02794.x. [DOI] [PubMed] [Google Scholar]
- Peterson RC, Smith GE, Waring SC, Ivnik RJ, Tangalos EG, Kokmen E. Mild cognitive impairment: clinical characterization and outcome. Arch Neurol. 1999;56:303–308. doi: 10.1001/archneur.56.3.303. [DOI] [PubMed] [Google Scholar]
- Pocernich CB, Butterfield DA. Acrolein inhibits NADH-linked mitochondrial enzyme activity: implications for Alzheimer’s disease. Neurotoxicity Res. 2003;5:515–520. doi: 10.1007/BF03033161. [DOI] [PubMed] [Google Scholar]
- Pocernich CB, Poon HF, Boyd-Kimball D, Lynn BC, Nath A, Klein JB, Butterfield DA. Proteomic analysis of oxidatively modified proteins induced by mitochondrial toxin 3- nitropropionic acid in human astrocytes expressing the HIV protein tat. Mol Brain Res. 2005;133:299–306. doi: 10.1016/j.molbrainres.2004.10.024. [DOI] [PubMed] [Google Scholar]
- Reed T, Perluigi M, Sultana R, Pierce WM, Klein JB, Turner DM, Coccia R, Markesber WR, Butterfield DA. Redox proteomic identification of 4-hydroxy-2-nonenal-modified brain proteins in amnestic mild cognitive impairment: Insight into the role of lipid peroxidation in the preogression and pathogenesis of Alzheimer’s disease. Neurobiol Dis. 2008;30:107–120. doi: 10.1016/j.nbd.2007.12.007. [DOI] [PubMed] [Google Scholar]
- Saiki RK, Bugawan TL, Horn GT, Mukkis KB, Erlich HA. Analysis of enzymatically amplified beta-globin and hla-dq alpha DNA with allele-specific oligonucleotide probes. Nature. 1986;324:163–166. doi: 10.1038/324163a0. [DOI] [PubMed] [Google Scholar]
- Salem NJ, Litman B, Kim HY, Gawrisch K. Mechanisms of action of docosahexxaenoic acid in the nervous system. Lipids. 2001;36:945–959. doi: 10.1007/s11745-001-0805-6. [DOI] [PubMed] [Google Scholar]
- Schmitt FA, Davis DG, Wekstein DR, Smith CD, Ashford JW, Markesbery WR. “Preclincal” AD revisited: Neuropathology of cognitively older adults. Neurology. 2000;55:370–376. doi: 10.1212/wnl.55.3.370. [DOI] [PubMed] [Google Scholar]
- Shan X, Tashiro H, Lin CG. The identification and characterization of oxidized RNAs in Alzheimer’s disease. J Neurosci. 2003;23:4913–2921. doi: 10.1523/JNEUROSCI.23-12-04913.2003. [DOI] [PMC free article] [PubMed] [Google Scholar]
- Shao C, Xiong S, Guo-Min L, Gu L, Mao G, Markesbery WR, Lovell MA. Altered 8-oxoguanine glycosylase in mild cognitive impairment and late-stage Alzheimer’s disease brain. Free Radic Bio Med. 2008;45:813–819. doi: 10.1016/j.freeradbiomed.2008.06.003. [DOI] [PMC free article] [PubMed] [Google Scholar]
- Siesjo BK, Ingvar M, Westerberg E. The influence of bicuculline-induced seizures on free fatty acid concentrations in cerebral cortex, hippocampus, and cerebellum. J Neurochem. 1982;39:796–802. doi: 10.1111/j.1471-4159.1982.tb07962.x. [DOI] [PubMed] [Google Scholar]
- Smith CD, Chebrolu J, Markesbery WR, Liu J. Improved predictive model for pre-symptomatic mild cognitive impairment and Alzheimer’s disease. Neurol Res. 2008;30:1091–1096. doi: 10.1179/174313208X327973. [DOI] [PubMed] [Google Scholar]
- Sultana R, Boyd-Kimball D, Poon HF, Cai J, Peirce WM, Klein JB, Markesbery WR, Zhou XZ, Lu JP, Butterfield DA. Oxidative modfication and down-regulation of Pin1 in Alzheimer’s disease hippocampus: a redox proteomics analysis. Neurobiol Aging. 2006;27:1094. doi: 10.1016/j.neurobiolaging.2005.05.005. [DOI] [PubMed] [Google Scholar]
- Takeda A, Smith MA, Avila J, Nunomura A, Siedlak SL, Zhu X, Perry G, Sayre LM. In Alzheimer’s disease, heme oxygenase is coincident with Alz50, an epitipe of tau induced by 4-hydroxy-2-nonenal modification. J Neurochem. 2000;75:1234–1241. doi: 10.1046/j.1471-4159.2000.0751234.x. [DOI] [PubMed] [Google Scholar]
- Thomann PA, Schlafer C, Seidl U, Santos VD, Essig M, Schroder J. The cerebellum in mild cognitive impairment and Alzheimer’s disease - a structural MRI study. J Psychiatr Res. 2008;42:1198–1202. doi: 10.1016/j.jpsychires.2007.12.002. [DOI] [PubMed] [Google Scholar]
- Van Kuijk FJ, Holte LL, Dratz EA. 4-hydroxhexenal: a lipid peroxidation product derived from oxidized docosahexaenoic acid. Biochim Biophys Acta. 1990;1043:116–118. doi: 10.1016/0005-2760(90)90118-h. [DOI] [PubMed] [Google Scholar]
- Wang J, Markesbery WR, Lovell MA. Increase oxidative damage in nuclear and mitochondrial DNA in mild cognitive impairment. J Neurochem. 2006;96:825–832. doi: 10.1111/j.1471-4159.2005.03615.x. [DOI] [PubMed] [Google Scholar]
- Wataya T, Nunomura A, Smith MA, Siedlak SL, Harris PLR, Shimohama S, Szweda LI, Kaminski MA, Avila J, Price DL, Cleveland DW, Sayre LM, Perry G. High molecular weight neurofilament proteins are physiological substrates of adduction by the lipid peroxidation product hydroxynonenal. J Biol Chem. 2002;277:4644–4648. doi: 10.1074/jbc.M110913200. [DOI] [PubMed] [Google Scholar]
- Wegiel J, Wisniewski HM, Dziewiathkowski J, Badmajew E, Tarnawski M, Reisberg B, Mlodzik B, De Leon MJ, Miller DC. Cellbellar atropy in Alzheimer’s disease - clinicopathological correlations. Brain Res. 1999;818:41–50. doi: 10.1016/s0006-8993(98)01279-7. [DOI] [PubMed] [Google Scholar]
- Williams TI, Lynn BC, Markesbery WR, Lovell MA. Increase levels of 4-hydroxynonenal and acrolein, neurotoxic markers of lipid peroxidation, in the brain in mild cognitive impairment and early Alzheimer’s disease. Neurobiol Aging. 2006;27:1094–1099. doi: 10.1016/j.neurobiolaging.2005.06.004. [DOI] [PubMed] [Google Scholar]
- Xie C, Markesbery WR, Lovell MA. Survival of hippocampal and cortical neurons in a mixture of MEM+ and B-27 supplemented neurobasal medium. Free Radic Bio Med. 2000;28:665–672. doi: 10.1016/s0891-5849(99)00268-3. [DOI] [PubMed] [Google Scholar]
- Yamaguchi H, Hirai S, Morimatsu M, Shoji M, Nakazato Y. Diffuse type of senile plaques in the cerebellum of Alzheimer-type dementia demonstrated by beta protein immunostain. Acta Neuropathol. 1989;77:314–319. doi: 10.1007/BF00687584. [DOI] [PubMed] [Google Scholar]
- Zambrano CA, Egana JT, Nunez MT, Maccioni RB, Gonzalez-Billault C. Oxidative stress protomes tau dephosphorlation in neuronal cells: The roles of Cdk5 and PP1. Free Radic Bio Med. 2004;36:1393–1402. doi: 10.1016/j.freeradbiomed.2004.03.007. [DOI] [PubMed] [Google Scholar]