

Abstract
Rate remapping is a recently revealed neural code in which sensory information modulates the firing rate of hippocampal place cells. The mechanism underlying rate remapping is unknown. Its characteristic modulation, however, must arise from the interaction of the two major inputs to the hippocampus, the medial entorhinal cortex (MEC), in which grid cells represent the spatial position of the rat, and the lateral entorhinal cortex (LEC), in which cells represent the sensory properties of the environment. We have used computational methods to elucidate the mechanism by which this interaction produces rate remapping. We show that the convergence of LEC and MEC inputs, in conjunction with a competitive network process mediated by feedback inhibition, can account quantitatively for this phenomenon. The same principle accounts for why different place fields of the same cell vary independently as sensory information is altered. Our results show that rate remapping can be explained in terms of known mechanisms.
Introduction
Early work on the receptive field properties of rat hippocampal cells showed that their firing depends strongly on the rat's location (O'Keefe et al. 1971). Indeed, their activity is generally restricted to one or several small regions of the environment called place fields. However, the hippocampus is also a storage site for non-spatial information (Wood et al. 1999; Rolls et al. 2005) so such information must somehow be represented. The fact that the spatial properties of hippocampal firing is modulated by manipulations of sensory cues (O'Keefe et al. 1978, Muller et al, 1991) and behavioral context (Wood et al. 2000) indicates that both spatial and non-spatial information are sharing the same neural structures and are likely to use a single common coding scheme. Recent work explored this question using a procedure in which the shape of the environment's walls were slowly morphed from square to round (or vice versa), thereby changing their sensory qualities. It was found that such morphing changed the rate of firing of individual place cells, either upwards or downwards, a phenomenon called “rate remapping” (Leutgeb et al. 2005; Leutgeb et al. 2007). Moreover, different place fields of the same cell can change upwards and downward independently. Thus, coding is not a cellular property, but the property of individual fields, each of which represents a separate conjunction of spatial and sensory information. This form of coding has not been previously observed in the brain and is very different from how sensory information is encoded in inferotemporal cortex, where cells represent specific sensory constructs, largely independent of their spatial position (Hung et al. 2005). Rate remapping, in contrast, permits the distinct representation of sensory events while maintaining the integrity of a code for spatial location. The mechanism underlying rate remapping has not been previously addressed.
The hippocampus receives inputs from two regions of the entorhinal cortex (EC). One input is the medial entorhinal cortex (MEC), a region that contains grid cells of varying spatial frequency, orientation and phase (Hafting et al. 2005). The axons of many such cells converge on the dendrites of the granule cells of the dentate gyrus (DG), the first-order processing stage of the hippocampus. These granule cells show one or more place fields (Leutgeb et al. 2007). A previous computational study indicates that the summation of excitatory input from MEC grid cells, in conjunction with feedback inhibition from the dentate network, is sufficient to account for the spatially specific firing pattern of granule cells (de Almeida et al. 2009a). Moreover, this study showed that the realignment of the MEC grid cell population automatically makes the granule cells globally remap, as observed experimentally (Leutgeb et al. 2005, 2007). However, this mechanism alone cannot account for rate remapping because the MEC input itself does not change during environmental morphing (Leutgeb et al. 2007, Fyhn et al. 2007). Several lines of evidence indicate that sensory information about the environment is brought to the hippocampus by input from the lateral entorhinal cortex (LEC): in rodents, this region is itself driven by sensory related areas including almost exclusive direct inputs from the ventral visual processing pathways of the occipitotemporal cortex (Mcdonald et al. 1996), the olfactory bulb (Carlsen et al. 1982) and indirect sensory input from area 35 of the perirhinal cortex (Burwell et al. 1998; Burwell 2000). Consistent with the sensory role of LEC, lesion of this region produces decreased investigation of novel objects (Myhrer 1988). Furthermore, direct recordings from the LEC exhibit a spatial response with low selectivity, indicating the influence of the sensory (non-spatial) drive (Hargreaves et al. 2005). The inputs from the LEC converge with those from the MEC onto all granule cells of the DG. Since the LEC and MEC constitute the main source of the extra hippocampal input to the DG, it is this convergence that must somehow account for the rate remapping of DG cells. We have used computational methods to study the effects of these inputs from the EC onto the DG and have sought to answer two main questions: (1) What is the mechanism of rate remapping? (2) Why do different place fields of the same DG cell display independent rate remapping?
Results
We simulated the response of DG cells to inputs from MEC and LEC in the following way. The spatial response (rate maps) of the grid cells were modeled as previously described (Blair et al. 2007; de Almeida et al. 2009) and, in accord with data (Leutgeb et al. 2007), were made insensitive to morphing. 10 examples of such cells are shown in Fig 1a. LEC cells were modeled to be consistent with the finding (Hargreaves et al. 2005) that the firing rate of these cells carries little, but not zero, information about the position of the rat (Fig 1c, t = 0.9957, P = 2e-07). To account for the sensory consequences of morphing on LEC, we assumed that the spatial response of each cell is switched from one map to an independently generated one at some random point during morphing (different assumptions are examined in Supplemental Text, Fig S1). The resulting receptive fields are shown for 10 LEC cells in Fig 1b. In order to approximate the response dynamics of the EC during environment morphing we generated the rate maps for both LEC and MEC (10,000 neurons each). To compute the excitatory input to each individual DG neuron we used a realistic number of inputs (1200 from the MEC and 1500 from LEC; see Methods) and summed them. Each synaptic input to the DG was taken from a population of randomly chosen entorhinal neurons, with the synaptic weight randomly assigned according to the synaptic weight distribution derived from the distribution of synapse sizes (de Almeida et al. 2009a) as determined by serial EM (Trommald et al. 1997). The spatial distribution of firing of 10,000 DG granule cells was computed by applying, at each position, a winner-take-all interaction over the sum of excitation input. This winner-take-all process is governed by the so called, E%-max principle (de Almeida et al. 2009b) derived from the interaction of excitation with gamma frequency feedback inhibition, a form of inhibition known to exist in this brain (Bragin et al. 1995; Towers et al. 2002; Pöschel et al. 2002) and that synchronizes the firing of DG cells (reviewed by Bartos et al. 2007). According to this principle, the level of inhibition is set such that cells will fire provided their excitation is within 10% of the cell with maximum excitation. For these cells, their rate is proportional to where they fall in this 10% range. The value of 10% is computed from d/τm (de Almeida et al. 2009b), where d = delay of feedback inhibition and τm = membrane time constant, both of which have been experimentally determined. A previous study showed that the interaction of MEC input with this form of inhibition is able to quantitatively account for the size and number of place fields exhibited by active DG cells (de Almeida et al. 2009a). In our simulations, we also take into consideration the LEC. The interaction of the two inputs depends on the ratio (α) of the mean drive of MEC and LEC onto EC. No data is available that would allow us to directly estimate α. However, our results provide for a quantitative estimate of its value (see below).
Figure 1. MEC and LEC inputs and estimation of model parameters.

(a) Example of the 10 MEC modeled rate maps (number is the maximum firing rate). MEC rate maps remain constant during morphing. (b) Example of the 10 LEC rate maps from experimental data (H, maximum rate when informed. From (Hargreaves et al. 2005). Reprinted with permission from AAAS) and 10 from the model for the two environments (square and round, maximum rate in both environments). Rate maps presented with equally distributed spatial score (ranked from right to left). (c) Histogram of spatial information score from LEC rate maps (H, experimental data and square, model. correlation 0.9957, P < 0.05). (d) Ratio (α) between the mean firing rates in MEC and LEC estimated as 0.32 by fitting to the experimentally observed reduction on spatial coincidence using population vector correlation as the environment is morphed (Leutgeb et al. 2007). (e) Histogram of the number of place fields found in DG cells (Leutgeb and square environment). Stable high correlation between experimental and simulated histograms during morphing indicates that modification in LEC activity do not disrupt place field formation (R = 0.98).
With this simulation framework in place, we investigated whether the cumulative decorrelation of population output from the dentate gyrus observed during progressive morphing of the arena shape (Leutgeb et al. 2007, PV correlation curve, Figure 3a) could be explained by the changes of the LEC spatial response. We computed the correlation between composite population vectors (see Methods) as a function of morphing stage throughout over a range of α and compared this with the correlations reported by Leutgeb et al. (2007) (Fig1d). To account for the variability of the firing rate in consecutive recordings under the same conditions (Hardgreaves et al. 2005, Leutgeb et al. 2007, Fyhn et al. 2007), we emulated the effect of under-sampling of the space, an unavoidable condition given the experimental protocols. To account for the effect of under-sampling, we introduced a stochastic factor in every comparison with a variance dependent on the rate (see Methods). The level of the correction was obtained by fitting to the experimental data (PV correlation) of two subsequent recordings obtained under the same condition (Fig S3). We observed an exponential-like decay shape for the correlation curves with the global level of decorrelation monotonically and positively affected by the level of influence of the LEC input (regulated by α). A value of (α=0.32, Fig 1d) gave the best fit. With the value of α determined, we could then examine how morphing affected rate remapping.
Figure 3. Different mechanisms for independent rate remapping of different place fields of the same cell.

(A) Rate is directly affected by changes of the input drive. For a given cell, morphing (round to square) induces localized variation of LEC input, changing the rate of each place field independently (At PF1, elevation of input drive (INPUT1) causes the rise of rate (RATE1). At PF2, the fall of the input level (INPUT2) leads to reduction of rate (RATE2)). In this case, remapping is only caused by the change of the input since the global inhibition level does not vary (dotted red line); (B) Rate is inversely affected by changes of the inhibition. Morphing induces localized variation of the global inhibition level, changing the rate of each place field independently (At PF1, the raise of the global inhibition level (INH3) causes the decay of the rate (RATE3). At PF2, the fall of the global inhibition level (INH4) causes the rise of the rate (RATE4)). In this case, remapping is only caused by the local changes on the global inhibition level since all inputs to this cell remain in the same level during remapping. The change of the inhibition level is caused by variations of the input drive of the most excited cell. For each cell and wall shape a rate map is shown with the relevant place fields indicated by a white circle and the process values used of the computation of the rate at these place fields: the sum of entorhinal input (light gray bar for LEC and dark gray bar for MEC); the sum of entorhinal input of the most excited cell (red line); the global inhibition level (dotted red line) and the rate (black bar). (C) Distribution of the mechanism balance ratio through active place fields (see Methods). Low ratio indicates prevalence of mechanism (A) while high ratio indicates that mechanism (B) is more effective.
First, we investigated whether the simulated place fields have properties that match those experimentally observed. We found that simulated granule cells have multiple place fields (average of 2.2 place fields) and have a mean place field size of 943 cm2. The distribution of the number of place fields in each active cell was similar to experimental measurements (Fig 1e, t = 0.98, P < 0.0005). The place field size is also in accord with data (analysis of (Leutgeb et al. 2007) by de Almeida et al. (2009a)). We also tested whether the observed restricted diversity of grid cell activity (Barry et al. 2007) affects the results of our simulation. When the grid cell proprieties were limited to one orientation and three grades of spacing, no significant difference in the distribution of the number of place fields (Wilcoxon, p = 0.65) or the PV correlation (Student t-test two-tailed, p = 0.31) was found. These results are not unexpected given previous work showing that MEC input alone can account for these properties; what is added here is the demonstration that the LEC inputs, when included in the model, do not interfere with place cell formation in the DG by the MEC inputs.
We next directly compared the remapping of individual place fields of our simulation of morphing with the results obtained by Leutgeb et al. (2007) (Fig 2a). The experimental results show that all place fields of the same cell remap and do so independently; thus one field may increase its firing rate during morphing while the other decreases its rate. Fig 2b shows this to be similarly true in our simulated place fields. Moreover, the relative proportion of remapping patterns (linear, quadratic and sigmoidal) could not be distinguished from the experimental observations (Fig 2c, t = 0.93, not significant (n.s.)).
Figure 2. Simulated DG cells exhibit independent place field rate remapping, as observed experimentally.
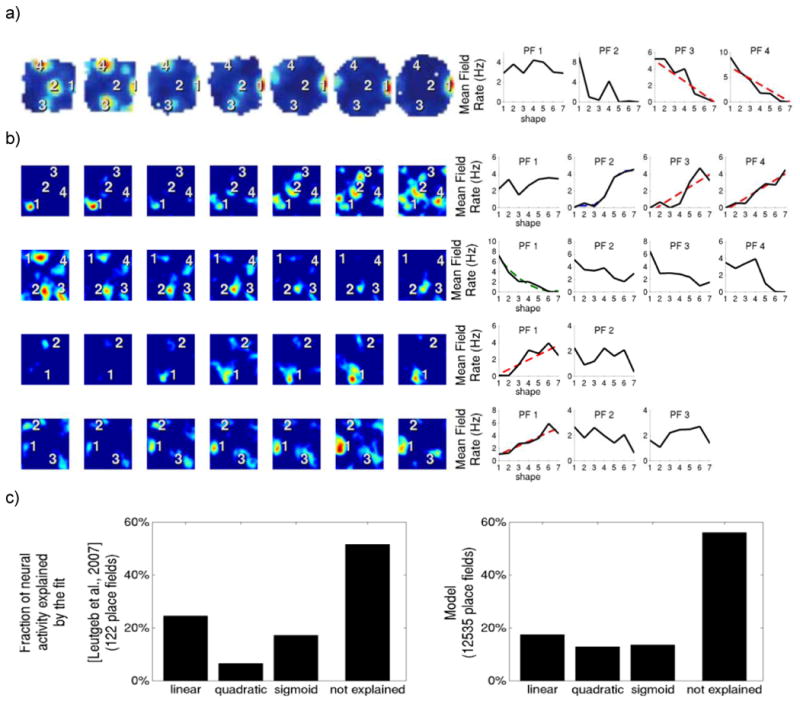
Differential rate changes in individual firing fields of cells from the dentate gyrus during progressive maneuvering of the walls of the arena. (a) Recorded cells. From (Leutgeb et al. 2007). Reprinted with permission of AAAS. (b) Simulated cells. Individual fields are numerically labeled to relate to the respective line diagram of the mean field rate. The rate curves were fitted to linear (red), quadratic (green) or sigmoid (blue) functions and are shown when significant (p < 0.05, dotted line). (c) Histogram of the best fit classification for recorded and simulated curves. Correlation between histograms is of 0.9543 (P = 0.045).
To obtain insight into why remapping is independent for different place fields of the same cell, we analyzed the changes during morphing (Fig 3). We identified two processes that cause independent place field rate remapping: (A) the effect of morphing on LEC cells changes the direct excitation of the granule cells (Fig 3a). Since the rate change of LEC cells due to morphing is a function of position, the variation on the integration of the LEC excitatory input is independent for each place field; (B) the change of the excitation of other cells will determine which cell is most activate at a given position. This determines the E% max level and thereby indirectly, via inhibition, alters the rate of other cells (Fig 3b). This process is localized and therefore independent for each place field.
To determine which mechanism prevails in controlling rate remapping, i.e. excitatory drive versus inhibitory competition, we looked for the ratio between the levels of remapping accounted for by each mechanism (see Methods). We observed that both mechanisms contribute to almost all place fields, with a slight dominance of mechanism A (Fig 4c).
Discussion
Rate remapping is a new form of coding, the mechanism of which has been unclear. We have found that it can be explained in terms of simple processes: the summation of several thousand LEC and MEC inputs to DG cells, in conjunction with a network process that produces competitive inhibition. These mechanisms are sufficient to explain the key observation, that even though the LEC input to the DG is not restricted to specific positions, virtually all DG cells have place fields. Our simulations show that the spatial firing pattern of DG cells is determined primarily by the MEC inputs; the role of the LEC is to determine the specific rate at which place cells fire. In addition to accounting for these findings, our model elucidates several other properties, notably the size of place fields, the average number of place fields, and the fact that if DG cells have multiple place fields, these vary independently during morphing of the environment. Other models have investigated the integration of input from LEC and MEC in the DG (Hayman and Jeffery 2008, Si and Treves 2009) and provided some insights that are consistent with our results. However our model is the first to attempt to quantitatively account for rate remapping (for a comparison of models, see Supplementary Text).
The mechanism of rate remapping can be understood intuitively in terms of the summation of LEC and MEC inputs and the strong competition for firing in DG produced by the DG inhibitory network (Fig 3). In this context, the strength of an input is defined by the presynaptic activity of the neurons of the entorhinal cortex and the strength of the synapses they form onto granule cells. If only the most excited cells can fire, then cells with both strong LEC and MEC input will have great advantage in this competition. Thus, only cells that have strong MEC inputs, and are thus “successful” place cells, can express the additional input from the LEC. Conversely, cells that have strong LEC input, but weak MEC input, and which could therefore express properties of the sensory world largely independent of place, are unlikely to be winners. This explains why cells that solely code sensory information, like those in the LEC and IT cortex, are very rare in the DG. This implies that the representation of the environment, as conveyed by LEC, is mixed in the DG with the spatial metric imposed by MEC.
Although convergence and competition are keys to understanding the mechanism of rate remapping, two additional factors should be noted. First, the number of inputs into a single DG cell from both LEC and MEC are large (>1000) and therefore not subject to large statistical fluctuations. If the number were much smaller, it might often arise by chance that significant numbers of DG cells received strong enough LEC input to win the competition even with negligible MEC input, contrary to what is observed (see Supplemental Text, Fig S2). Second, spatial encoding is unique because the organism is always at a place; i.e. the MEC is always active and formation of grid cells is not impaired by darkness (Hafting et al, 2005). In contrast, information from any specific sensory modality in the LEC may be present or not at any point in time. Because place is always present, other sensory information can never compete by itself for influence over the DG; the competition is always influenced by MEC input. It may happen that sensory input affects the properties of the grid cells when grids realign to distal cues (Sargolini et al. 2006), but such changes only occur during global remapping, which is outside the scope of this study.
The mechanism we propose for rate remapping depends on the interaction of the LEC and MEC. This interaction depends quantitatively on the relative magnitude of the two inputs (α), which according to our analysis should be in the range of 0.2-0.3. Importantly, modification of α provides a way of testing the proposed model of rate remapping. Specifically, (1) the mean population vector correlation produced by morphing should monotonically increase with α (Fig 1d) and (2) the mean place field size should monotonically decrease with α (Fig S2D). With the advent of molecular methods for altering firing rates or synaptic strengths in a region specific manner, it should become possible to directly test these predictions.
Previous studies have shown that multiple place fields of single DG neurons emerge from the mechanism considered here using inputs from MEC only (de Almeida et al. 2009a). Our simulations show that this phenomenon still holds when inputs from both MEC and LEC are considered. What emerges from our analysis is that simple random summation of the inputs and competition among DG cells is sufficient to form place fields, but not selective enough to form only one; i.e. multiple place fields is the best the system can do in decoding the highly distributed grid cell input. The emergence of cells with single place fields, as occurs in CA3, requires an additional processing step (de Almeida et al., 2010).
The independence of the rate remapping observed in the multiple place fields of single DG cells (Leutgeb et al. 2007) constitutes a novel form of neural code. In this code the DG neuron multiplexes multiple independent features that are selected on the basis of a spatial metric. The independence emerges because both excitation and inhibition vary with spatial location. Rate remapping is different from other rate codes in the brain that are selective for multiple features, as for instance, the combined spatial frequency and orientation tuning curves found in single neurons of the primary visual cortex (de Valois & de Valois 1990). The overall response of these V1 cells can be explained by the multiplication of tuning curves that, in contrast to the rate remapping in the DG, are fixed and invariant to any other feature change (Mazer et al. 2002). The independent (nonmultiplicative) modulation of the place fields of single DG neurons promotes orthogonalization of the encoding that is required to generate the highly specific responses to single locations found in CA3 (Leutgeb et al. 2007).
Our results answer some questions about this code, but other important questions remain. A defining feature of this code is that the firing rate is not binary. Thus, a particular memory is represented not only by which cells fire, but also by the firing rates. Now consider the process of pattern completion for n cells with rates R1, R2…Rn. Suppose a partial cue is presented, say R1 to R5. This should lead to the firing of unstimulated cells at their appropriate graded rates. Indeed, there are attractor network models that use graded rather than binary rates (Rolls 2007), and it will be interesting to see if these can account quantitatively for pattern completion in CA3. Another unanswered question is where and how rate remapping is decoded so that cortical cells, which do not code sensory information using spatially specific cells, can decode information (such as during replay) that they receive from the hippocampus.
Experimental Procedures
Spatial response representation
All data was simulated for a 1 m square enclosure with a resolution of 1 cm2, compromising 10000 square bins organized in a 100 × 100 rectangular grid. The spatial response for each cell of all considered cortical regions was composed by rate values assigned for each bin, defining a rate map.
Simulation of spatial response from entorhinal cortex
MEC spatial response was set invariant to the morphing of the environment, being simulated only once. The rate (λ) of each MEC cell follows the equation defined by Blair et al. (2007) and is a function of the Cartesian position (r = (x,y)) and subject to the following parameters: the place field decay constant (a, normally distributed with 0.55±0.03), the inter-vertex distance (d, ranging from 30 to 100 cm), the spatial offset (c = (xo,yo), ranging from (0,0) to (d,d)) and the angular offset (θ, from 0° to 60°):
The vertex angles (θ1=-30°, θ2=+30° and θ3=+90°) define a honeycomb grid that bases the formation of the grid cell firing. We simulated the spatial response of 10000 MEC cells, each of them with a random parametric set within the range specified above.
LEC spatial response was set dependent to the degree of morphing (v). Indeed, morphing was incorporated in the model by changing the spatial response of LEC cells. For each LEC cell there were assigned one rate map for the beginning and another for the end of the morphing, each of them generated independently (following the methods below). For the intermediate morphing steps, it was defined a random (uniformly distributed) transition morphing degree for each cell in a way that the spatial response of the cell is invariant from the beginning to this point and from this point to the end.
To synthesize the LEC rate maps, the arena was divided in a 5×5 grid that covers the whole arena. For each rate map, these regions were randomly separated in two groups (active or inactive) according to the expected spatial information score (high spatial specificity renders less active regions). A base rate map is built by assigning a random rate value within the range [0,0.5] for non-active regions and [0.5,1] for active regions. To obtain the final map of LEC responses we convolved the base map with a Gaussian kernel with standard deviation of 17 bins. We simulated the spatial response of 10,000 LEC cells by using the number of active regions to fit to the experimental spatial information score (Hargreaves et al. 2005). Samples of LEC rate maps and the spatial information score histogram are shown in Fig 1b and Fig 1c respectively.
LEC and MEC spatial responses had the population mean average rate normalized. Since we could not obtain information about the relative mean fire rate of MEC and LEC populations, we had the ratio parameterized by α in the range [0,1] when the rates were integrated in the computation of the excitatory input of the granule cell.
Granule cells
Each granule cell integrates the excitatory input received from a random group of MEC and LEC cells following the estimated convergence (see below). The sum of entorhinal input of each granule cell (I) is specific for each position, which allow a map representation. The excitatory input is the product of the rate (λ) of the afferent cell with the specific synaptic weight (W, see below).
The rate of granule cells is defined by competition of the sum of the entorhinal input within the population ruled by a percentage of maximal suprathreshold excitation (E%-max) winner-take-all process (de Almeida et al. 2009b), measured as 10%. At a specific position and arena shape, the amount of inhibition is equal to 90% of the sum of the entorhinal input of the most excited cell in the population. Whenever this global inhibition is higher than the sum of entorhinal inputs of a specific cell, this cell remains silent. Otherwise, the rate of the cell is the difference between excitation and inhibition.
, where H is Heaviside function.
Supplementary figure 1 gives an insight of how granule cells rate map is obtained from grid cells and LEC cells and how rate is influenced by both the input of entorhinal input of the cell and by the population inhibition.
Convergence from entorhinal cortex
The convergence of the entorhinal cortex input onto granule cells was estimated by the number of synapses as ∼1200 for grid cells (de Almeida et al. 2009a) and following the same procedure as ∼1500 for LEC inputs (see Supplementary Methods).
Synaptic weight
Synaptic weight (W) is defined by the synaptic size (s) (de Almeida et al. 2009a):
The synaptic size distribution was defined by the measured size distribution of excitatory synapses onto granules cells (Trommald et al. 1997):
, s ranges from 0 to 0.2
Data analysis
Cells with average firing rate above 10% of the mean average firing rate of cell population were considered active.
Composite population vector correlation
Composite population vector (PV) correlation has been used in the analysis of experimental data to observe the reduction of rate coincidence at the same position in the dentate gyrus when the shape of the arena is morphed (Leutgeb et al. 2007). PVs are obtained by storing in a vector the rate at a certain position bin of each cell of a population. The correlation between the PV of the same group on two different conditions give a measure of how the condition affects the overall population activity. The PV correlation value is the mean correlation value considering all positions bins.
Place field analysis
The number of place fields was estimated from the rate map for active cells in each stage of the morphing. Rate maps were smoothed by a Gaussian kernel with 9 pixels radius. Pixels with firing rate above 20% of the peak rate were considered active. Groups of contiguous active pixels (>200 and <2500 pixels) with average rate exceeding the mean population fire rate and with peak activity above two times the mean population fire rate were considered to be a firing field.
Curve fit
Persistent place fields were obtained by applying place field analysis on the average rate map for all morphing shapes (Leutgeb et al. 2007). There different curves were fit to the in-field rate for each persistent place field following the morphing: (a) linear regression, (b) quadratic regression and (c) sigmoid function. Fits with p values < 0.05 were considered significant, and each place field was assigned to the category with the highest explained variance (F values).
Rate remapping measures
The level of the rate remapping effect is measured for each persistent place field (p) whose average mean rate for the two extreme shapes of the morphing (λSR) is above 10% of the mean average firing rate of the cell population. The rate remapping level (ηR) is defined as the absolute difference in firing rate normalized by λSR. The level of rate remapping due to mechanism A (ηA), which is based on the change of the sum of direct excitatory inputs, is the absolute difference in the mean sum of the input at the positions of the place field normalized by λSR. The level of rate remapping due to mechanism B (ηB), which is based on the change in the level of inhibition, is the absolute difference in the mean global inhibition level at the positions of the place field, normalized by λSR. The ratio of the impact of the two mechanisms (γ) is ηB divided by ηA + ηB.
Supplementary Material
Acknowledgments
We thank Paul Miller for an insightful conversation and Licurgo de Almeida for his assistance. Supported by European Community FP7/2007-2013 Grant 217148 - SF and by NIH/NIMH Grant P50 MH060450
Footnotes
Publisher's Disclaimer: This is a PDF file of an unedited manuscript that has been accepted for publication. As a service to our customers we are providing this early version of the manuscript. The manuscript will undergo copyediting, typesetting, and review of the resulting proof before it is published in its final citable form. Please note that during the production process errors may be discovered which could affect the content, and all legal disclaimers that apply to the journal pertain.
References
- Barry C, Hayman R, Burgess N, Jeffery KJ. Experience-dependent rescaling of entorhinal grids. Nature neuroscience. 2007;10:682–4. doi: 10.1038/nn1905. [DOI] [PubMed] [Google Scholar]
- Bartos M, Vida I, Jonas P. Synaptic mechanisms of synchronized gamma oscillations in inhibitory interneuron networks. Nature reviews Neuroscience. 2007;8:45–56. doi: 10.1038/nrn2044. [DOI] [PubMed] [Google Scholar]
- Blair HT, Welday AC, Zhang K. Scale-invariant memory representations emerge from moiré interference between grid fields that produce theta oscillations: a computational model. The Journal of Neuroscience. 2007;27:3211–29. doi: 10.1523/JNEUROSCI.4724-06.2007. [DOI] [PMC free article] [PubMed] [Google Scholar]
- Bragin A, Jando G, Nadasdy Z, Hetke J, Wise K, Buzsaki G. Gamma (40-100 Hz) oscillation in the hippocampus of the behaving rat. J Neurosci. 1995;15:47–60. doi: 10.1523/JNEUROSCI.15-01-00047.1995. [DOI] [PMC free article] [PubMed] [Google Scholar]
- Burwell RD. The parahippocampal region: corticocortical connectivity. Annals of the New York Academy of Sciences. 2000;911:25–42. doi: 10.1111/j.1749-6632.2000.tb06717.x. [DOI] [PubMed] [Google Scholar]
- Burwell RD, Amaral DG. Perirhinal and postrhinal cortices of the rat: interconnectivity and connections with the entorhinal cortex. The Journal of comparative neurology. 1998;391:293–321. doi: 10.1002/(sici)1096-9861(19980216)391:3<293::aid-cne2>3.0.co;2-x. [DOI] [PubMed] [Google Scholar]
- Carlsen J, De Olmos J, Heimer L. Tracing of two-neuron pathways in the olfactory system by the aid of transneuronal degeneration: projections to the amygdaloid body and hippocampal formation. The Journal of comparative neurology. 1982;208:196–208. doi: 10.1002/cne.902080208. [DOI] [PubMed] [Google Scholar]
- De Valois RL, De Valois KK. Spatial Vision. New York: Oxford Univ. Press; 1990. [Google Scholar]
- Fyhn M, Hafting T, Treves A, Moser M, Moser EI. Hippocampal remapping and grid realignment in entorhinal cortex. Nature. 2007;446 doi: 10.1038/nature05601. [DOI] [PubMed] [Google Scholar]
- Hafting T, Fyhn M, Molden S, Moser M, Moser EI. Microstructure of a spatial map in the entorhinal cortex. Nature. 2005;436:801–806. doi: 10.1038/nature03721. [DOI] [PubMed] [Google Scholar]
- Hargreaves EL, Rao G, Lee I, Knierim JJ. Major Dissociation Between Medial and Lateral Entorhinal Input to Dorsal Hippocampus. Science. 2005;1792:1792–1794. doi: 10.1126/science.1110449. [DOI] [PubMed] [Google Scholar]
- Hung CP, Kreiman G, Poggio T, DiCarlo JJ. Fast readout of object identity from macaque inferior temporal cortex. Science (New York, NY) 2005;310:863–6. doi: 10.1126/science.1117593. [DOI] [PubMed] [Google Scholar]
- Leutgeb JK, Leutgeb S, Moser M, Moser EI. Pattern separation in the dentate gyrus and CA3 of the hippocampus. Science. 2007;315:961–966. doi: 10.1126/science.1135801. [DOI] [PubMed] [Google Scholar]
- Leutgeb S, Leutgeb JK, Barnes CA, Moser EI, McNaughton BL, Moser M. Independent codes for spatial and episodic memory in hippocampal neuronal ensembles. Science. 2005;309:619–23. doi: 10.1126/science.1114037. [DOI] [PubMed] [Google Scholar]
- Mazer JA, Vinje WE, McDermott J, Schiller PH, Gallant JL. Spatial frequency and orientation tuning dynamics in area V1. Proceedings of the National Academy of Sciences of the United States of America. 2002;99:1645–50. doi: 10.1073/pnas.022638499. [DOI] [PMC free article] [PubMed] [Google Scholar]
- Mcdonald AJ, Mascagni F. Cortico-cortical and cortico-amygdaloid projections of the rat occipital cortex: a Phaseolus vulgaris leucoagglutinin study. Neuroscience. 1996;71:37–54. doi: 10.1016/0306-4522(95)00416-5. [DOI] [PubMed] [Google Scholar]
- Muller RU, Kubie JL, Bostock EM, Taube JS, Quirk GJ. Spatial firing correlates of neurons in the hippocampal formation of freely moving rats. In: Paillard J, editor. Brain and Space. Oxford Press; 1991. [Google Scholar]
- Myhrer T. Exploratory behavior and reaction to novelty in rats with hippocampal perforant path systems disrupted. Behavioral neuroscience. 1988;102:356–62. doi: 10.1037//0735-7044.102.3.356. [DOI] [PubMed] [Google Scholar]
- O'Keefe J, Conway D. Hippocampal place units in the freely moving rat: Why they fire where they fire. Experimental Brain Research. 1978;31:573–590. doi: 10.1007/BF00239813. [DOI] [PubMed] [Google Scholar]
- O'Keefe J, Dostrovsky J. The hippocampus as a spatial map. Preliminary evidence from unit activity in the freely-moving rat. Brain research. 1971;34:171–5. doi: 10.1016/0006-8993(71)90358-1. [DOI] [PubMed] [Google Scholar]
- Pöschel B, Draguhn A, Heinemann U. Glutamate-induced gamma oscillations in the dentate gyrus of rat hippocampal slices. Brain Research. 2002;938:22–28. doi: 10.1016/s0006-8993(02)02477-0. [DOI] [PubMed] [Google Scholar]
- Rolls ET. An attractor network in the hippocampus: theory and neurophysiology. Learning & memory (Cold Spring Harbor, NY) 2007;14:714–31. doi: 10.1101/lm.631207. [DOI] [PubMed] [Google Scholar]
- Rolls ET, Xiang J, Franco L. Object, space, and object-space representations in the primate hippocampus. Journal of neurophysiology. 2005;94:833–44. doi: 10.1152/jn.01063.2004. [DOI] [PubMed] [Google Scholar]
- Towers SK, LeBeau FE, Gloveli T, Traub RD, Whittington MA, Buhl EH. Fast Network Oscillations in the Rat Dentate Gyrus In Vitro. J Neurophysiol. 2002;87:1165–1168. doi: 10.1152/jn.00495.2001. [DOI] [PubMed] [Google Scholar]
- Trommald M, Hulleberg G. Dimensions and density of dendritic spines from rat dentate granule cells based on reconstructions from serial electron micrographs. The Journal of comparative neurology. 1997;377:15–28. doi: 10.1002/(sici)1096-9861(19970106)377:1<15::aid-cne3>3.0.co;2-m. [DOI] [PubMed] [Google Scholar]
- Wood ER, Dudchenko PA, Robitsek RJ, Eichenbaum H. Hippocampal Neurons Encode Information about Different Types of Memory Episodes Occurring in the Same Location. Neuron. 2000;27:623–633. doi: 10.1016/s0896-6273(00)00071-4. [DOI] [PubMed] [Google Scholar]
- Wood ER, Dudchenko PA, Eichenbaum H. The global record of memory in hippocampal neuronal activity. Nature. 1999;397:613–6. doi: 10.1038/17605. [DOI] [PubMed] [Google Scholar]
- de Almeida L, Idiart M, Lisman JE. A second function of gamma frequency oscillations: an E%-max winner-take-all mechanism selects which cells fire. The Journal of Neuroscience. 2009;29:7497–7503. doi: 10.1523/JNEUROSCI.6044-08.2009. [DOI] [PMC free article] [PubMed] [Google Scholar]
- de Almeida L, Idiart M, Lisman JE. The input-output transformation of the hippocampal granule cells: from grid cells to place fields. The Journal of Neuroscience. 2009;29:7504–7512. doi: 10.1523/JNEUROSCI.6048-08.2009. [DOI] [PMC free article] [PubMed] [Google Scholar]
- de Almeida L, Idiart M, Lisman JE. The single place fields of CA3 cells: a two-stage transformation from grid cells. Hippocampus. 2010 doi: 10.1002/hipo.20882. in press. [DOI] [PMC free article] [PubMed] [Google Scholar]
Associated Data
This section collects any data citations, data availability statements, or supplementary materials included in this article.