

Summary
We have investigated self-association propensities of aqueous unfolded (UAQ) forms of eight outer membrane proteins, OmpA, OmpW, OmpX, PagP, OmpT, OmpLa, FadL and Omp85. We found that high urea concentrations maintain all of these OMPs as monomers and that OmpA and OmpX remain monomeric upon dilution to 1M urea. A pH screen showed that basic pH supports the least amount of UAQ OMP self-association, consistent with earlier studies showing that basic pH was optimal for better folding efficiencies. The addition of KCl increased UAQ OMP self-association, although the magnitudes of the responses were varied. These studies showed that urea can be used to tune the amount of UAQ OMP self-association and indicate that the presence of some urea may be useful in optimizing folding conditions because it diminishes aggregation.
Keywords: centrifugation, membranes, outer membrane proteins, particle size distribution, proteins
Introduction
Outer membrane proteins (OMPs) do not fold as they emerge from the ribosome. Rather, unfolded polypeptide chains of OMPs are transported through the translocon in an extended form. As they emerge into the periplasm it is thought that chaperones bind to OMPs and target their folding to the outer membranes of gram negative bacteria. [1–4] In addition to targeting roles, chaperones are also thought to prevent the aggregation of unfolded OMPs. This hypothesis depends on the fundamental assumption that all OMPs have self-association and/or irreversible aggregation propensities, and this latter point is the central question we address in this paper.
In addition to gaining insight into the potential functional roles of chaperones, understanding the nature of aqueous unfolded states (UAQ) of OMPs is essential for dissecting their kinetic folding pathways. While chaperones are essential for folding in vivo, we and others have shown that many outer membrane proteins can fold in vitro into synthetic vesicles without chaperones and without the addition of external energy. [5–13] Thus, like soluble proteins, their sequences contain all the information necessary to encode their native structures. Since unfolded states provide an important reference point for these studies in vitro, a greater understanding of their UAQ conformations and interactions is essential for developing physically-based models for OMP folding.
Finally, aggregation of membrane proteins is one of the principal hurdles to their study, whether it be production of these proteins for structural or functional studies. Sedimentation velocity studies of UAQ states provide greater insight into the environmental factors that enhance or diminish OMP self-association. We therefore carried out a screen of pH values, KCl and urea concentrations to evaluate the self-association propensities of eight distinct outer membrane proteins from E. coli.
Experimental Part
Expression and Purification of Proteins
Urea (Ultra Pure Grade, Amresco) solutions were deionized by adding 1 gram resin (BioRad) for every 10 mL urea solution and stirring for an hour at room temperature, and final concentrations were determined by refractometry. Mature OMPs were expressed into inclusion bodies, purified by centrifugation and stored at −20°C as previously described [6] except that lysozyme was omitted from the protocol. As needed, purified inclusion bodies were thawed and dissolved in 20mM Tris pH 8.0, 8M urea (Buffer A) and clarified by centrifugation. The supernatant was filtered through a 0.22μM pore (Millipore) and further purified using a Q-column. OMPs were eluted from this column using Buffer A supplemented with 100mM KCl (except Omp85 required 150mM KCl). OMPs were desalted by sequential rounds of dilution in Buffer A and concentration by centrifugal filtration (Millipore). Proteins were diluted to an absorbance of approximately 8.0 at 280nm and divided into aliquots before flash freezing in an ethanol-dry ice bath for storage at −80°C until use.
Sedimentation velocity analytical ultracentrifugation
Sedimentation velocity experiments were carried out at speeds ranging from 30,000 to 60,000 rpm using a Beckman XL-A analytical ultracentrifuge, two-sector cells in an An60Ti rotor. All experiments were carried out at 37°C, the physiological temperature for these proteins in vivo. For the screen, OMP aliquots were thawed and brought to an A280 of 0.3, which corresponded to low micromolar concentrations for all proteins. The final buffer conditions were prepared: (1) for the KCl survey 1M urea, 20mM Tris pH8 and either 0, 50, 100, 200 or 400mM KCl; (2) for the urea survey, 20mM Tris pH8, 0mM KCl, and either 1, 2, 3, 4, 5 or 6M urea; and (3) for the pH survey, 1M urea, 0mM KCl, and either 20mM Sodium Acetate pH 6, 20mM Tris pH 7, 20mM Tris pH 8, 20mM Glycine pH 9 or 20mM Glycine pH 10. All OmpA samples were supplemented with 2mM TCEP. For higher throughput, intensity scans were collected for most experiments so that samples could be loaded into both the reference and the sample sides of the cell. The exception is Figure 1 where the data were collected using standard absorbance with buffers in the reference side. Immediately after dilution into the final buffer condition, absorbance spectra of all samples were collected, and samples were not further processed if they exhibited turbidity at 320 nm. These samples are plotted as having weight-average n-mer values of 25. Samples not exhibiting light scattering were loaded into two-sector cells, and cells and rotor were incubated at 37°C for at least 30 minutes in the Beckman XLA Ultracentrifuge. The AUC run was started 90 minutes after the protein was added to the buffer components.
Figure 1.
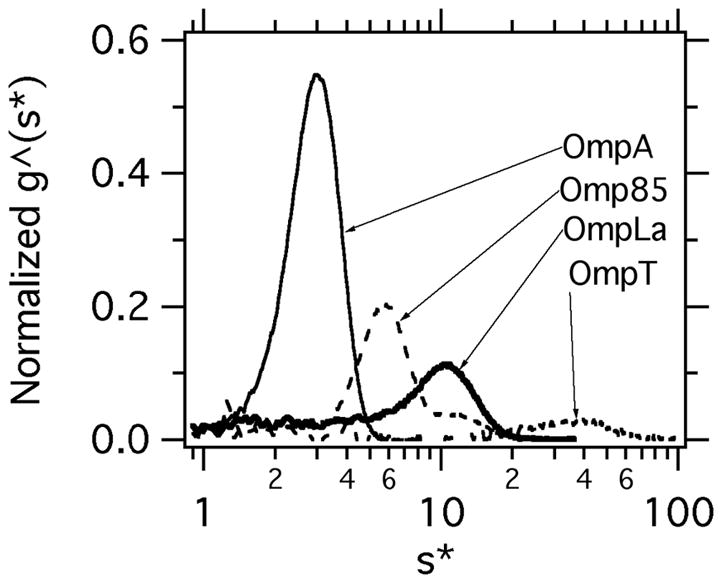
Normalized g^(s*) distributions of OmpA, Omp85, OmpLa and OmpT show the wide range of s* values that are observed. These data were collected at 37°C in 20mM Tris, pH 8.0, 1M urea. The s̄T ,B values from these representative data are 2.89s (OmpA), 7.67s (Omp85), 10.11s (OmpLa) and 37.68s (OmpT). The OmpA distribution was fitted in dcdt+ to a single Gaussian equation that returned a molecular weight of 35.9 kDa, which is less than different from 2% of the calculated value. The statistics of the fit were excellent with a sum of squares of residuals equal to 0.00373 with 388 degrees of freedom..
Sedimentation velocity data were mainly analyzed using the time derivative method of Stafford as implemented in SedAnal[14] or dcdt+.[15] Data with wide distributions were also evaluated sedfit using both the ls-g(s*) and continuous c(s*) distribution algorithms[16] to confirm that the scans used for evaluation were not too narrowly chosen (data not shown), and weight average sedimentation coefficients were consistent between software programs. All protein molecular weights, partial specific volumes, solvent densities, hydrations and conversions to s20,w were calculated in the standard way using Sednterp[17] and the partial specific volume values of Cohn and Edsall.[18]
Two steps of data reduction were required to directly compare OMP UAQ aggregation trends across the buffer conditions employed in this study. First, the experimentally observed weight average sedimentation coefficients, s̄T ,b, were converted to equivalent weight average values at 20 degrees in water, s̄20,w, in Sednterp. This conversion corrects for the influences of temperature, buffer density and viscosity on the distributions. Second, we attempted to normalize the data to account for the diverse OMP molecular weights. The OMPs monomer molecular weights range from 16 to 88 kDa, and these differences will result in different sedimentation coefficients on this basis alone, which makes it difficult to compare them. We therefore calculated an estimate of the minimum possible weight average n-mer, n̄, defined as where s̄20,w is s defined above and sMon,20,w equals the theoretical sedimentation coefficient of the equivalent hydrated sphere for each monomer at 20 degrees in water. This calculation is not perfect for several reasons: The first is that it assumes a constant axial ratio, which may or may not be the case; a second drawback is that many of the OMPs display polydisperse sedimentation coefficient distributions, which a single n̄ parameter cannot fully capture; and the third drawback to this metric is that the sedimentation coefficients of the monomeric forms are mostly unknown and may in fact be over-estimated by using the equivalent hydrated sphere as the reference number. Based on the highly elongated axial ratio of OmpA that can be inferred from its sedimentation coefficient, we expect that the sedimentation coefficients of monomers may be over-estimated by using the “equivalent hydrated sphere” as a reference point, however we have no independent data on their conformations to use as a basis to define a different reference. For this reason, we generally interpret the n̄ as a minimum estimate of weight average extent of association. Despite all these drawbacks, the n̄ parameter still allows a distinction between populations that are consistent or inconsistent with containing monomeric species.
Results and Discussion
Unfolded aqueous OMPS self-associate to different extents
Our initial folding screen showed a diverse response of nine outer membrane proteins to various lipid compositions, architectures and pH values. [6] As we continue to optimize folding conditions in ongoing studies, we noticed that folding reactions were sensitive to original stock concentrations of some OMPs, and we postulated that aqueous unfolded states of OMPs might be self-associating. To evaluate this possibility, we set up mock folding reactions that lacked lipid vesicles and subjected these solutions to sedimentation velocity to investigate the oligomeric nature of the unfolded states. Figure 1 shows g^(s*) distributions for UAQ forms of OmpA, Omp85, OmpLa and OmpT, which exemplify the wide diversities in unfolded state interactions we observed.
It has been known for quite some time that an UAQ form of OmpA could self-associate and compete with folding;[19] yet the environmental conditions influencing the OmpA UAQ formation have never been systematically studied. In buffer containing just 1M urea, which is a solution condition that strongly favors the native state when vesicles are present, we found that UAQ OmpA was monodisperse and monomeric, suggesting that aggregation of unfolded OmpA is not a thermodynamically strong interaction. OmpA displayed a weight average sedimentation coefficient, s̄T ,B, equal to 2.89, and its g^(s*) distribution was well described by a single Gaussian equation from which the OmpA molecular weight could be recovered. Using Sednterp, we calculated an a/b axial ratio equal to ~11 assuming a prolate ellipsoid of revolution for monomeric UAQ OmpA, suggesting that this folding-competent unfolded state adopts a highly elongated conformation that is distinct from the collapsed aqueous state that is usually envisioned in folding schemes.
In stark contrast, OmpT showed a wide, polydisperse sedimentation coefficient distribution encompassing sedimentation coefficients as large as ribosomal subunits. The width of the sedimentation coefficient distribution suggests that many different species can be formed. In addition, no monomeric OmpT was detected. By comparison, Omp85 and OmpLa UAQ states showed less disperse sedimentation coefficient distributions. Although smaller than OmpT, the weight average sedimentation coefficient distribution for OmpLa still excluded a predominantly monomeric population whereas the distribution for Omp85 included the possibility of Omp85 monomers. Similar to OmpA, these are likely to be elongated in their hydrodynamic shape. Preliminary studies of both the Omp85 and OmpLa g^(s*) distributions showed that they were sensitive to final protein concentration (data not shown), which suggests that the data in Figure 1 are reaction boundaries that do not represent specific species, and we have therefore not pursued fitting them for further molecular information at this time.
The next variable we tested was the buffering pH. Basic pH was found to be better for folding in our original studies,[6] and these experiments suggest that the self-association propensities of UAQ states may reveal one reason underlying this observation. Figure 2 shows the minimum oligomer possible inferred from sedimentation velocity experiments of aqueous unfolded OMPs. Unsurprisingly, all OMPs self-associate at pH 6.0, which approaches the pI values for these proteins (between pH 5 and 6). Overall, less association is observed at pH 8.0, and even less at pH 9.0. The pH dependence of UAQ self-association is most striking for OmpT, where the possible minimum weight average oligomer goes from twenty to ten between pH 8.0 and 9.0, but rises again to twenty at pH 10.0. PagP shows a dramatic decrease in self-association going from pH 8.0 to pH 9.0, and OmpW shows a similar, but less intense change. OmpA and OmpX – the “good folders” from the original folding study[6] - appeared monomeric at pH 8.0 and above. This observation is consistent with the indifference of OmpX to pH in folding efficiency over that same range.[6]
Figure 2.

Lowering the pH leads to OMP self-association. For each pH, the minimum possible weight-average n-mer values, n̄, are plotted as a function of the OMP protein. At each pH the value for the OMPs are given in the following order (left to right): OmpA (black), OmpW (84% gray), OmpX (70% gray), PagP (56% gray), OmpT (42% gray), OmpLa (28% gray), FadL (14% gray), and Omp85 (white). Values plotted as n̄ = 25 either exhibited weight average n-mers equal to or greater than 25 or showed turbidity upon mixing, implying protein aggregation. For comparison, the data for pH 8.0 are repeated in Figure 3, 0M KCl and Figure 4, 1M urea. Note that n̄ < 1 for some OMPs under some conditions, and n̄ =0.97 for Omp85 at pH 8.0, even though it shows two peaks in Figure 1; this is a consequence of the large population it displays that sediments slower than that of the equivalent hydrated sphere of the monomer.
We next investigated the effects of increasing the ionic strength using KCl. Figure 3 shows that all OMPs except OmpX displayed an increase in self-association when KCl concentrations were increased to 500 mM. The sensitivity of the response varied: it took the full 500 mM KCl to observe OmpA self-association, whereas all other OMPs at least doubled in their minimum possible oligomer by the addition of only 50mM KCl. We anticipate that the addition of other salts would lead to similar results, and it would be particularly interesting to investigate whether the “salting out” of these UAQ follows a Hofmeister series, which would give further insight into the physical origins of the self-association propensities.
Figure 3.

Increasing KCl leads to OMP self-association. For each KCl concentration, the minimum possible weight-average n-mer values, n̄, are plotted as a function of the OMP protein. At each KCl concentration the OMPs are given in the following order (left to right): OmpA (black), OmpW (84% gray), OmpX (70% gray), PagP (56% gray), OmpT (42% gray), OmpLa (28% gray), FadL (14% gray), and Omp85 (white). Values plotted as n̄ = 25 either exhibited weight average n-mer values equal to or greater than 25 or showed turbidity upon mixing, implying protein aggregation. The data for 0M KCl are the same as Figure 2, pH 8.0 and Figure 4, 1M urea.
Denatured OMPs are monomeric in high concentrations of urea
Our observations of the salt and pH dependence of OMP self-association raised the question of whether or not we were even starting with monomeric OMPs when we initially prepared them in high concentrations of denaturant. We therefore carried out sedimentation velocity experiments on OMPs as a function of final urea concentration. Since 0M KCl supported the least amount of OMP self-association, we omitted salt from these experiments. Figure 4 shows that all OMPs display sedimentation coefficients consistent with monomeric OMPs at 5M urea and above. Interestingly, PagP still shows some self association in 4M urea, consistent with folding studies by Huysmans et al,[8] which required the presence of unusually high urea concentrations for folding.
Figure 4.

Increasing the urea concentration leads to OMP dissociation. For each urea concentration, the minimum possible weight-average nmer values, n̄, are plotted as a function of the OMP protein. At each [urea], the OMPs are given in the following order (left to right): OmpA (black), OmpW (84% gray), OmpX (70% gray), PagP (56% gray), OmpT (42% gray), OmpLa (28% gray), FadL (14% gray), and Omp85 (white).
Conclusion
Robust self-association of UAQ states of outer membrane proteins is a common occurrence that we observed in the majority of the set we studied. These interactions depend on pH, ionic strength, and final urea concentration. Basic pH seems to promote UAQ OMP dissociation and increasing the urea concentration does the same. We previously identified OmpA and OmpX as the “good folders”, [6] and the UAQ states of these two OMPs show the least tendencies to self-associate. We suggest that this may by one underlying factor explaining why they are so well behaved in folding assays. Certainly, if self-associated states of UAQ OMPs are off-pathway and compete with folding, the presence of these UAQ states would diminish folding efficiencies.
There are no obvious reasons to rationalize the varied self-association trends of OMP UAQ states to self-associate. While OmpA and Omp85 have large soluble domains, OmpX does not, so the presence of a soluble, periplasmic domain cannot explain the reduced tendency to self-associate. In addition, the extensive self-association of OmpT could not have been predicted; instead one might have expected FadL to display the most aggregation, since previous studies show it has the least “folding competent” population.[6] Nevertheless, the urea dependence of the UAQ interactions offers a tool to control the extent of these interactions and may find practical utility in identifying conditions that promote better folding of some of the more challenging OMPs. Moreover OMP aggregation must be controlled in the cellular environment, and our observations define a functional role that must be fulfilled by biological chaperones.
Supplementary Material
Acknowledgments
The authors thank the National Science Foundation (MCB 0919868) and the National Institutes of Health (R01 GM079440, T32 GM008403) for financial support.
Literature Cited
- 1.Kim S, Malinverni JC, Sliz P, Silhavy TJ, Harrison SC, Kahne D. Science. 2007;317(5840):961–4. doi: 10.1126/science.1143993. [DOI] [PubMed] [Google Scholar]
- 2.Sklar JG, Wu T, Gronenberg LS, Malinverni JC, Kahne D, Silhavy TJ. Proc Natl Acad Sci U S A. 2007;104(15):6400–5. doi: 10.1073/pnas.0701579104. [DOI] [PMC free article] [PubMed] [Google Scholar]
- 3.von Heijne G. J Membr Biol. 1990;115(3):195–201. doi: 10.1007/BF01868635. [DOI] [PubMed] [Google Scholar]
- 4.Wu T, Malinverni J, Ruiz N, Kim S, Silhavy TJ, Kahne D. Cell. 2005;121(2):235–45. doi: 10.1016/j.cell.2005.02.015. [DOI] [PubMed] [Google Scholar]
- 5.Behrens S, Maier R, de Cock H, Schmid FX, Gross CA. Embo J. 2001;20(1–2):285–94. doi: 10.1093/emboj/20.1.285. [DOI] [PMC free article] [PubMed] [Google Scholar]
- 6.Burgess NK, Dao TP, Stanley AM, Fleming KG. J Biol Chem. 2008;283(39):26748–58. doi: 10.1074/jbc.M802754200. [DOI] [PMC free article] [PubMed] [Google Scholar]
- 7.Dartigalongue C, Missiakas D, Raina S. J Biol Chem. 2001;276(24):20866–75. doi: 10.1074/jbc.M100464200. [DOI] [PubMed] [Google Scholar]
- 8.Huysmans GH, Radford SE, Brockwell DJ, Baldwin SA. J Mol Biol. 2007;373(3):529–40. doi: 10.1016/j.jmb.2007.07.072. [DOI] [PMC free article] [PubMed] [Google Scholar]
- 9.Kleinschmidt JH. Chem Phys Lipids. 2006;141(1–2):30–47. doi: 10.1016/j.chemphyslip.2006.02.004. [DOI] [PubMed] [Google Scholar]
- 10.Kleinschmidt JH, den Blaauwen T, Driessen AJ, Tamm LK. Biochemistry. 1999;38(16):5006–16. doi: 10.1021/bi982465w. [DOI] [PubMed] [Google Scholar]
- 11.Kleinschmidt JH, Wiener MC, Tamm LK. Protein Sci. 1999;8(10):2065–71. doi: 10.1110/ps.8.10.2065. [DOI] [PMC free article] [PubMed] [Google Scholar]
- 12.Missiakas D, Betton JM, Raina S. Mol Microbiol. 1996;21(4):871–84. doi: 10.1046/j.1365-2958.1996.561412.x. [DOI] [PubMed] [Google Scholar]
- 13.Schafer U, Beck K, Muller M. J Biol Chem. 1999;274(35):24567–74. doi: 10.1074/jbc.274.35.24567. [DOI] [PubMed] [Google Scholar]
- 14.Stafford WF, Sherwood PJ. Biophys Chem. 2004;108(1–3):231–43. doi: 10.1016/j.bpc.2003.10.028. [DOI] [PubMed] [Google Scholar]
- 15.Philo JS. Anal Biochem. 2006;354(2):238–46. doi: 10.1016/j.ab.2006.04.053. [DOI] [PubMed] [Google Scholar]
- 16.Schuck P. Biophys J. 2000;78(3):1606–19. doi: 10.1016/S0006-3495(00)76713-0. [DOI] [PMC free article] [PubMed] [Google Scholar]
- 17.Laue TM, Shah BD, Ridgeway TM, Pelletier SL. Computer-aided interpretation of analytical sedimentation data for proteins. In: Harding S, Rowe A, Hoarton J, editors. Analytical Ultracentrifugation in Biochemistry and Polymer Science. Royal Society of Chemistry; Cambridge, UK: 1992. pp. 90–125. [Google Scholar]
- 18.Cohn EJ, Edsall JT. Density and Apparent Specific Volume of Proteins. In: Cohn EJ, Edsall JT, editors. Proteins, Amino Acids and Peptides. Reinhold Publishing Corporation; New York: 1943. pp. 370–381. [Google Scholar]
- 19.Surrey T, Jahnig F. Proc Natl Acad Sci U S A. 1992;89(16):7457–61. doi: 10.1073/pnas.89.16.7457. [DOI] [PMC free article] [PubMed] [Google Scholar]
Associated Data
This section collects any data citations, data availability statements, or supplementary materials included in this article.