

Activation of initiation factor 2 by ligands and mutations for rapid docking of ribosomal subunits
During translation initiation in prokaryotes, the GTPase IF2 promotes the highly specific loading of formylated initiator tRNA into the 70S initiation complex. This kinetic study describes the activation of IF2 by its ligands GTP and fMet-tRNA with broader implications for the mode of action of G-proteins as molecular switches.
Keywords: conformational switching, GTPAses, initiation factors, initiator tRNA, protein synthesis
Abstract
We previously identified mutations in the GTPase initiation factor 2 (IF2), located outside its tRNA-binding domain, compensating strongly (A-type) or weakly (B-type) for initiator tRNA formylation deficiency. We show here that rapid docking of 30S with 50S subunits in initiation of translation depends on switching 30S subunit-bound IF2 from its inactive to active form. Activation of wild-type IF2 requires GTP and formylated initiator tRNA (fMet-tRNAi). In contrast, extensive activation of A-type IF2 occurs with only GTP or with GDP and fMet-tRNAi, implying a passive role for initiator tRNA as activator of IF2 in subunit docking. The theory of conditional switching of GTPases quantitatively accounts for all our experimental data. We find that GTP, GDP, fMet-tRNAi and A-type mutations multiplicatively increase the equilibrium ratio, K, between active and inactive forms of IF2 from a value of 4 × 10⁻⁴ for wild-type apo-IF2 by factors of 300, 8, 80 and 20, respectively. Functional characterization of the A-type mutations provides keys to structural interpretation of conditional switching of IF2 and other multidomain GTPases.
Introduction
The GTPase (Bourne, 1995; Sprang, 1997) initiation factor 2 (IF2) has essential roles in initiation of messenger RNA (mRNA) translation in bacteria (Hershey, 1987). In interplay with initiation factors 1 (IF1) and 3 (IF3), IF2 promotes rapid binding of formylated initiator tRNA (fMet-tRNAi) to the 30S pre-initiation complex (30S PIC) (Fakunding and Hershey, 1973; Benne et al, 1973a; Wintermeyer and Gualerzi, 1983; Gualerzi et al, 2001; Antoun et al, 2006b). Subsequently, IF2 promotes rapid docking of 50S subunits to 30S PICs containing fMet-tRNAi but not un-formylated Met-tRNAi or elongator tRNA (Antoun et al, 2006a; Zorzet et al, 2010). By this two-step mechanism, IF2 confers remarkably high accuracy to fMet-tRNAi selection into the 70S initiation complex (Antoun et al, 2006a), thereby ensuring correct P-site positioning of the initiation codon of mRNA and correct in-frame mRNA translation (Hartz et al, 1989; Antoun et al, 2006a). The GTP-bound form of IF2, but not GTP hydrolysis, is required for rapid docking of the 50S subunit to the fMet-tRNAi-containing 30S PIC (Antoun et al, 2003, 2004). GTP hydrolysis on IF2 promotes its rapid release from the 70S initiation complex and rapid entry of this complex into the protein elongation phase of mRNA translation (Benne et al, 1973a; Luchin et al, 1999; Antoun et al, 2003, 2004).
The formyl group of fMet-tRNAi is crucial for recognition of initiator tRNA by IF2 (Sundari et al, 1976; Gualerzi et al, 2001; Antoun et al, 2006a). Although formylation deficiency is not lethal for the bacterial cell, it greatly decreases growth rate (Guillon et al, 1992, 1996; Steiner-Mosonyi et al, 2004). A novel class of IF2 mutations complementing formylation deficiency was recently identified in Salmonella typhimurium (Zorzet et al, 2010). These mutations, all located outside the tRNA-binding domain IV of IF2, strongly (A-type IF2 mutations) or weakly (B-type IF2 mutations) reduce the requirement of a formylated methionine in initiator tRNA for its rapid binding to the 30S PIC and the subsequent rapid docking of the 50S subunit to the 30S PIC (Zorzet et al, 2010).
Here, we show that A-type IF2 mutants not only bypass the formylation requirement, but also the requirement of a P-site bound tRNA in the 30S PIC, for rapid docking of ribosomal subunits. Moreover, in the presence of fMet-tRNAi these A-type IF2 mutants promote rapid subunit docking not only with GTP but also with GDP. These findings imply that rapid subunit docking does not per se depend on the presence of initiator tRNA on the 30S subunit. Instead, initiator tRNA serves as a cofactor to drive the 30S subunit-bound IF2 from its inactive to its active 50S subunit-docking conformation. Applying the theory of conditional switching of GTPases (Hauryliuk et al, 2008a, 2008b), we quantify the contributions of methionylation and formylation of initiator tRNAi, the presence of tRNAi, as well as the presence of GTP or GDP for activation of IF2. We show that the phenotypes of these novel IF2 mutants can be accounted for by a 20-fold (A-type mutants) or two-fold (B-type mutants) higher propensity of their apo-form to acquire active conformation as compared with wild-type apo-IF2. We show also that the previously observed deleterious effects of A-type mutations on the accuracy of initiation and bacterial fitness in a formylation-proficient background (Zorzet et al, 2010) can be accounted for by over-activation of the apo-form of IF2 by mutations. We conclude that the apo-form of wild-type IF2 has been optimized in evolution to precisely adjust the extent of its activation by the GTP and fMet-tRNAi ligands.
Results
Experimental setup and modelling
We have used stopped flow with scattered light detection (Antoun et al, 2004) to study the kinetics of docking of 50S subunits with 30S PICs containing wild-type IF2 or IF2 mutants that strongly (A-type) or weakly (B-type) compensate for initiator tRNA formylation deficiency (Zorzet et al, 2010). The experiments were performed in the presence of GTP, GDP, or in the absence of guanine nucleotide in combinations with fMet-tRNAi, Met-tRNAi, tRNAi or no tRNA in the 30S PIC. To ensure that subunit association always proceeded to completion, the experiments were performed in the absence of IF3 in the 30S PIC (Antoun et al, 2006a, 2006b). The subunit-joining kinetics displayed one fast and one slow phase and could in all cases be quantitatively described by a two-state kinetic model for subunit docking:
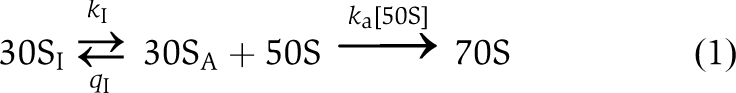 |
Here, 30SI is an inactive state of the small ribosomal subunit unable to dock with the 50S subunit, while 30SA is its active, docking-competent state (Milon et al, 2008). The model assumes that the equilibrium between the active and inactive states of the 30S subunit has already been established before the addition of 50S subunits (see Materials and methods for details). Accordingly, the fast phase of the subunit-docking kinetics reflects the rate of direct 50S subunit association to 30SA and its amplitude corresponds to the equilibrium fraction, fA, of 30S subunits in the active state. The slow phase mainly reflects the rate of conversion of 30SI to 30SA and its amplitude corresponds to the equilibrium fraction, 1−fA, of 30S subunits in the inactive state. The fraction fA is determined by the equilibrium constant K=k1/q1 of the first step in Equation (1) as fA=K/(1+K), from which follows the inverse relation K=fA/(1−fA). The model fittings of experimental light-scattering curves are in each figure shown as solid lines and the model parameters estimated for each fitting (k1, q1 and ka) are given in Supplementary Tables S1 and S2. To simplify comparison of subunit-docking kinetics, we have for each experimental curve also defined a single rate constant, kc, as the inverse of the time at which the extent of subunit docking was 50% of its maximal value (see Materials and methods for details). For fA-values close to one and 1:1 ratio of 30S and 50S subunits, this definition of kc allows estimation of the second-order rate constant for subunit docking as ka=kc/[50S] (see Materials and methods). The equilibrium fractions, fA, of active subunits, the corresponding equilibrium constants K and effective rates, kc, for subunit docking are compiled in Tables I and II.
Table 1. Fraction fA of active, 50S-docking conformation of 30S PICs, the equilibrium ratio K of active to inactive 30S PICs and the effective subunit joining rate, kc in the presence of GTP for different IF2s in the 30S PIC.
| WT IF2 | B1 IF2 | B2 IF2 | B3 IF2 | A1 IF2 | A2 IF2 | A3 IF2 | |
|---|---|---|---|---|---|---|---|
| 30S PICs with fMet-tRNAi | |||||||
| fA | 0.90±0.01 | 0.94±0.01 | 0.93±0.01 | 0.92±0.02 | 0.99±0.02 | 0.99±0.02 | 0.99±0.02 |
| K | 9.0±2.4 | 16.7±3.4 | 13.8±2.3 | 10.7±2.6 | ND | ND | ND |
| kc | 37.4±0.4 | 38.9±0.4 | 40.0±0.4 | 40.3±0.4 | 41.7±0.7 | 40.2±0.8 | 39.6±0.8 |
| 30S PICs with Met-tRNAi | |||||||
| fA | 0.52±0.01 | 0.74±0.01 | 0.69±0.02 | 0.60±0.01 | 0.942±0.01 | 0.956±0.01 | 0.951±0.01 |
| K | 1.07±0.07 | 2.87±0.17 | 2.15±0.31 | 1.46±0.11 | 16.5±3.7 | 22.0±4.8 | 19.5±4.4 |
| kc | 9.8±0.6 | 21.5±0.7 | 18.5±0.7 | 14.0±0.7 | 41.2±0.8 | 38.7±0.9 | 36.9±0.7 |
| 30S PICs with tRNAi | |||||||
| fA | 0.13±0.01 | 0.29±0.01 | 0.82±0.01 | ||||
| K | 0.155±0.031 | 0.395±0.054 | 4.39±0.65 | ||||
| kc | 2.51±0.05 | 5.70±0.07 | 31.2±0.2 | ||||
| 30S PICs without tRNA | |||||||
| fA | 0.10±0.02 | 0.24±0.01 | 0.21±0.01 | 0.20±0.01 | 0.74±0.01 | 0.79±0.01 | 0.72±0.01 |
| K | 0.11±0.01 | 0.32±0.02 | 0.26±0.03 | 0.25±0.11 | 2.89±0.15 | 3.81±0.18 | 2.61±0.21 |
| kc | 1.92±0.04 | 3.41±0.05 | 4.18±0.05 | 3.46±0.04 | 24.5±0.4 | 25.6±0.4 | 20.5±0.4 |
| 30S PICs without tRNA, IF1 and mRNA | |||||||
| fA | 0.098±0.02 | 0.19±0.02 | 0.14±0.01 | 0.14±0.01 | 0.60±0.01 | 0.64±0.01 | 0.61±0.01 |
| K | 0.10±0.02 | 0.24±0.03 | 0.16±0.02 | 0.17±0.02 | 1.48±0.08 | 1.81±0.07 | 1.56±0.07 |
| kc | 3.43±0.09 | 4.86±0.15 | 5.08±0.18 | 4.75±0.17 | 19.8±0.3 | 22.1±0.3 | 23.4±0.4 |
Effects of tRNAi, Met-tRNAi and fMet-tRNAi on subunit docking with different IF2 variants in the presence of GTP
The effective rate, kc, of subunit docking in the presence of mRNA, IF1 and fMet-tRNAi on the 30S subunit was large (kc≈40 s−1) and similar for wild type, the three B-type and the three A-type variants of S. typhimurium IF2 (Figure 1A and B; Table I). The corresponding second-order association rate constants, ka, of about 140 μM−1 s−1, agree well with ka-values previously obtained for subunit joining with wild-type IF2 from Escherichia coli (Antoun et al, 2006b). The docking rates for A-type IF2 mutants were slightly larger (average kc=40 s−1) than for wild-type IF2 (kc=37.4 s−1). The subunit-joining kinetics was close to mono-phasic with fA≈0.9 for wild-type IF2 and B-type mutants (Table I). For A-type IF2 mutants, the fraction of active subunits fA was close to 1.0, precluding reliable estimation of the equilibrium constants K=k1/q1 for these mutants (Table I).
Figure 1.

Kinetics of 70S IC formation after rapid mixing of 50S subunits with 30S PICs containing different IF2s and either fMet-tRNAi or no tRNA. (A) 30S PIC contained mRNA, IF1, no IF3, indicated IF2 and fMet-tRNAi. (B) The same as (A) but fMet-tRNAi was omitted. (C) 30S PICs contained mRNA, IF1, no IF3, indicated A-type IF2 mutants and either fMet-tRNAi or no tRNA. (D) Effective docking rates of subunits with or without fMet-tRNAi for indicated IF2s in the 30S PICs.
When non-formylated, Met-tRNAi replaced fMet-tRNAi in the 30S PIC, the effective docking rate kc was only slightly reduced for the A-type mutants, while kc was reduced by about a factor of two for the B-type mutants and by a factor of four for wild-type IF2 (Figure 2A and B; Table I). While the kinetics of subunit joining with non-formylated Met-tRNAi was near mono-phasic for A-type IF2, it was clearly bi-phasic for B-type and wild-type IF2s (Figure 2A and B). Analysis of the scattering curves in the framework of the kinetic model in Equation (1) estimated the fA-value as 0.94 for the A1-type mutant, 0.74 for the B1-type mutant and 0.52 for wild-type IF2 (Table I), implying that the equilibrium constant K between the active and inactive forms of IF2 was increased by about a factor of 2.8 by the B1 mutation and by a factor of 16 by the A1 mutation (Table I). On average, K increased by factors of 2 and 20 by the B- and A-type mutations, respectively (Table I).
Figure 2.

Kinetics of 70S IC formation after rapid mixing of 50S subunits with 30S PICs containing different IF2s and either non-formylated Met-tRNAi or deacylated tRNAi. (A) 30S PICs contained mRNA, IF1, no IF3, indicated IF2 and Met-tRNAi. (B) Effective rates of subunit joining for the experiments in panel (A). (C) 30S PICs contained mRNA, IF1, no IF3, indicated IF2s and deacylated tRNAi. (D) Comparison of effective docking rates of 50S subunits to 30S PICs assembled with indicated IF2s for different tRNAi types (fMet-tRNAi, Met-tRNAi, deacylated tRNAi or no tRNA).
When deacylated tRNAi replaced fMet-tRNAi in the 30S PIC, the effective docking rate was reduced by 25% for the A1 IF2 mutant (kc=31.2 s−1), by a factor of 7 for the B1 IF2 mutant (kc=5.7 s−1) and by a factor of 15 for the wild-type IF2 (kc=2.5 s−1) (Figure 2C and D; Table I). From the subunit-docking curves in Figure 2, we estimated fA as 0.82 for the A1 IF2 mutant, 0.29 for the B1 IF2 mutant and 0.13 for wild-type IF2 (Table I), implying that in this context, the equilibrium constant K was increased by about a factor of 2.5 by the B1 mutation and a factor of 27 by the A1 mutation (Table I).
Complete removal of tRNA from the 30S PIC reduced the docking rate about two-fold for the A-type mutants (average kc=23.5 s−1), about 10-fold for the B-type mutants (average kc=3.7 s−1) and about 20-fold for wild-type IF2 (kc=1.9 s−1) (Figure 1A–D; Table I). The kinetics of subunit docking in the absence of tRNA exhibited a clear bi-phasic behaviour (Figure 1A–D) for the A-type IF2 mutants. Table I shows that in the absence of tRNA, the equilibrium constant K was again increased by factors 2 and 20 by the B- and A-type mutations, respectively.
In summary, these data indicate that the equilibrium constant, K, for wild-type IF2 was increased roughly by a factor of 2 by B- and by a factor of 20 by A-type mutations irrespective of whether there was fMet-tRNAi, Met-tRNAi, tRNAi or no tRNA in the P-site of the 30S subunit (Table I).
In the experiments described above, the 30S PICs contained IF1 and an mRNA with strong SD sequence: two features with putative effects on the conformation of the 30S subunit (Milon et al, 2008). However, similar kc-values for subunit docking without tRNA were obtained in the absence and presence of IF1 and mRNA (compare Figures 1 and 3). Furthermore, alterations in the equilibrium constant, K, by the B- and A-type mutations were similar in the absence and presence of mRNA and IF1: in the absence of IF1 and mRNA, the B- and A-type mutations increased K by factors of 1.8 and 16, respectively (Table I).
Figure 3.

Kinetics of 70S ribosome formation in the absence of IF1, IF3, tRNA and mRNA after rapid mixing of 50S subunits with 30S subunits containing different IF2s. (A) 30S subunits contained only indicated IF2. (B) Comparison of effective docking rates of 50S subunits to 30S subunits containing only IF2s or IF2s supplemented with also IF1 and mRNA.
Comparison of the values of the equilibrium constant K for wild-type IF2 in the absence of tRNA, in the presence of deacylated tRNAi or methionylated Met-tRNAi (see Table I) shows that tRNAi binding to the 30S PIC increased K by less than a factor of 1.5, while tRNAi methionylation increased K further by about a factor of 7 (Table I). Formylation of Met-tRNAi led to a further nine-fold increase in K (Table I), thereby driving wild-type IF2 almost completely (90%) into its active form. Similar increases in K-values are also seen for B- and A-type IF2 mutants (Table I) showing that the binding of any particular tRNA ligand shifted the K-value by roughly the same factor for wild-type and mutated forms of IF2.
We note that removal of fMet-tRNAi from the 30S PIC resulted in drastic reductions in subunit-joining rates with wild-type IF2 and B-type mutants but only to minor rate reductions with the A-type mutants (Table I). We conclude, therefore, that rapid subunit docking does not require the presence of initiator tRNA per se, but mainly depends on IF2 switching to its active 50S-docking conformation on the 30S subunit. Thus, the active conformation of IF2 could be induced either by the presence of fMet-tRNAi in the 30S PIC or by an A-type mutation.
Effects of different guanine nucleotides on subunit joining with wild-type IF2 and an A-type IF2 mutant
In the experiments described so far, 1 mM GTP was always present in the reaction mixture. We showed previously that replacing GTP with GDP in a 30S PIC containing IF1, IF3, mRNA, fMet-tRNAi and the naturally truncated β-form of IF2 from E. coli resulted in a 20-fold reduction in the docking rate of ribosomal subunits (Antoun et al, 2003). The GTP to GDP swap resulted in an even larger, about 60-fold, reduction in the docking rate for the full-length α-form of E. coli IF2 (Antoun et al, 2004).
Figure 4 shows that a similar reduction in subunit-joining rate (60-fold from 37.4 to 0.6 s−1) occurred also in the absence of IF3 when GDP replaced GTP on wild-type IF2 in a 30S PIC assembled with fMet-tRNAi, mRNA, IF1 and IF2 (Table II). Surprisingly, when the A1 IF2 mutant replaced wild-type IF2, the rate of subunit docking decreased by only 40% from 41.7 to 25.9 s−1 upon GTP to GDP swapping demonstrating that, in contrast to the wild-type IF2, the A-type IF2, did not require GTP for rapid subunit docking. Importantly, the A-type IF2 did not promote rapid subunit docking in the absence of guanine nucleotide: without guanine nucleotide, kc was only 1.73 s−1 compared with 25.9 s−1 in the presence of GDP and 41.7 s−1 in the presence of GTP (Table II). These results suggest that not only GTP but also GDP drives apo-IF2 towards its active form (see Discussion). In a parallel experiment with wild-type IF2, we obtained kc=0.5, 0.6 or 37.4 s−1 in the absence of guanine nucleotide, in the presence of GDP or in the presence of GTP, respectively (Tables I and II).
Figure 4.

Dependence of the kinetics of subunit joining on the presence of fMet-tRNAi and G-nucleotide in the 30S PICs containing wild-type IF2 or A1 IF2 mutant. (A) Kinetics of 50S docking to 30S PICs containing mRNA, IF1, no IF3, wild-type IF2, indicated nucleotide and either fMet-tRNAi or no tRNA. (B) The same as (A) but the 30S PICs contained A1 IF2 instead of wild-type IF2. (C) Comparison of the effective rates of 50S subunit docking to 30S PICs containing different G-nucleotides, fMet-tRNAi or no tRNA and wild-type IF2 or A1 IF2 mutant.
Table 2. Fraction fA of active 50S-docking conformation of 30S PICs, the equilibrium ratio K of active to inactive 30S PIC and the effective subunit joining rate, kc in the presence of GDP or without G nucleotide (no GXP) for wild-type IF2 and the A1 IF2 mutant.
| WT IF2 | A1 IF2 | |
|---|---|---|
| fMet-tRNA, GDP | ||
| fA | 0.20±0.02 | 0.83±0.02 |
| K | 0.25±0.02 | 4.95±0.25 |
| kc | 0.60±0.05 | 25.9±0.2 |
| fMet-tRNA, no GXPa | ||
| fA | 0.02±0.002 | 0.41±0.04 |
| K | 0.02±0.03 | 0.61±0.06 |
| kc | 0.5±0.04 | 1.73±0.03 |
| aIn the absence of guanine nucleotides, 1 mM CTP was added to the reaction mixture to ensure the same level of Mg2+ chelation as in the presence of guanine nucleotides. | ||
The subunit-docking kinetics in the presence of GDP was also clearly bi-phasic (Figure 4A and B). Its analysis in the framework of the kinetic Equation (1) gave the fraction of the active IF2 form in the 30S PIC and, hence, the equilibrium constant K between the active and inactive forms of IF2·GDP. In the presence of fMet-tRNAi, 21% of wild-type IF2·GDP and 83% of A1-type IF2·GDP were in the active conformation, corresponding to an about 19-fold increase in equilibrium constant K for IF2·GDP by the A-type mutation. This mutation-induced shift in K for transition from the inactive to the active form of IF2·GDP corresponds very well to the ∼20-fold mutational shift in K observed for IF2·GTP (Table I). Importantly, comparison of K-values for wild-type IF2 with GTP and GDP in the presence of fMet-tRNAi (Table I) shows that the GTP for GDP substitution on IF2 resulted in a 36-fold increase in the equilibrium constant K in favour of the active form of IF2, explaining the importance of GTP for IF2 activation.
For a 30S complex with mRNA, IF1 and wild-type IF2, but lacking fMet-tRNAi, the rate of subunit docking decreased about four-fold from 1.9 to 0.46 s−1 by the GTP to GDP swapping (Figure 4A and C). With an A-type IF2 replacing wild-type IF2 in the otherwise similar 30S complex, the rate of docking decreased almost 40-fold from 24.5 to 0.52 s−1 (Figure 4B and C), indicating that fMet-tRNAi was required to drive A1 IF2 into its active conformation in the absence of GTP. Thus, rapid subunit docking was promoted by A-type IF2 either in the presence of fMet-tRNAi and GDP or in the presence of GTP without tRNA. In contrast, wild-type IF2 required both GTP and fMet-tRNAi to promote rapid subunit docking. In the absence of tRNA and presence of GDP, subunit joining with A1 IF2, with wild-type IF2 or without IF2 in the 30S PIC was similarly slow (Figure 4A and B).
Effect of the GTP/GDP ratio on subunit joining with wild-type IF2 and an A-type IF2 mutant
In the presence of fMet-tRNAi in the 30S PIC, the rate of subunit docking promoted by wild-type and A1-type IF2 responded very differently to a varying fraction of GTP in the reaction mixture (Figure 5). For wild-type IF2, the effective rate of subunit docking, kc, increased monotonically with increasing GTP content reaching half its maximal value of 37.2 s−1 at about 40% GTP and continued to increase significantly all the way up to 100% GTP (Figure 5A and C). Moreover, the kinetics of subunit docking with wild-type IF2 was clearly bi-phasic when the reaction mixture contained GDP (Figure 5A). A very similar result was obtained for wild-type IF2 from E. coli (Supplementary Figure S1). In contrast, with A1 IF2, kc was already larger than half its maximal value of 40.5 s−1 in the presence of only GDP and was close to its maximum when the GTP content exceeded 20% (Figure 5B and C). Analysis of these kinetics in the framework of Equation (1) gives the fractions, fA, of active IF2 and the equilibrium constant K between the active and inactive forms of IF2 as a function of the GTP fraction in the reaction mixture (Supplementary Figure S1D). These data were used to estimate the ratio, β, between the equilibrium dissociation constants of GDP and GTP to the active form of wild-type IF2 bound to the 30S subunit as 10 (see Materials and methods and Supplementary data for details). This value of β indicates, as expected, that GTP has a much higher affinity than GDP to the active form of IF2.
Figure 5.

Dependence of the kinetics of subunit joining on the fraction of GTP in the reaction mixture for wild-type IF2 and A1 IF2 mutant. (A) Kinetics of 50S docking to 30S PICs containing mRNA, IF1, no IF3, fMet-tRNAi and wild-type IF2 for indicated GTP fractions in the reaction mixture. (B) The same as (A) but 30S PICs contained A1 IF2 instead of wild-type IF2. (C) Comparison of the effective rates of subunit joining with wild-type IF2 and A1 IF2 mutant for different GTP fractions [GTP]/([GTP]+[GDP]) in the reaction mixture.
The dependence of the rate of subunit docking on the fraction of GTP with also IF3 present in the 30S PIC (Figure 6) was qualitatively similar to that in its absence (Figure 5). Under these physiologically more relevant conditions, the effective rate of subunit joining, kc, increased monotonically with the GTP content for wild-type IF2 reaching half its maximal value of 8.3 s−1 at about 60% GTP (Figure 6C). For A1 IF2, kc was 4.2 s−1 and close to half of the maximal kc (10 s−1) already at 0% GTP, and approached the maximal kc at a GTP content just above 20% (Figure 6C). This suggests that under physiological conditions, the subunit-docking rate is much less sensitive to GTP content for A-type than for wild-type IF2.
Figure 6.

Dependence of subunit-joining rate with wild-type IF2 and A1 IF2 mutant in the presence of IF3 on the fraction of GTP in the reaction mixture. (A) Kinetics of 50S docking to 30S PICs containing mRNA, IF1, IF3, fMet-tRNAi and wild-type IF2 for indicated GTP fractions in the reaction mixture. (B) The same as (A) but 30S PICs contained A1 IF2 instead of wild-type IF2. (C) Comparison of the effective rates of subunit joining with wild-type IF2 and A1 IF2 mutant for different GTP fractions [GTP]/([GTP]+[GDP]) in the reaction mixture.
Discussion
We recently identified novel mutations in S. typhimurium IF2 that compensate for the lack of initiator tRNA formylation in vivo and in vitro (Zorzet et al, 2010). These mutations, located well outside the tRNA-binding domain IV of IF2 (see Supplementary Figure S2), increase both the rate of non-formylated Met-tRNAi binding to the 30S PIC and the rate of subsequent docking of 50S subunits to the Met-tRNAi-containing 30S PIC. They fall into two groups: one compensating strongly (A-type) and the other weakly (B-type) for formylation deficiency in vivo and in vitro (Zorzet et al, 2010). Here, we have studied the effects of these IF2 mutations on the kinetics of docking of 50S subunits to 30S PICs assembled with fMet-tRNAi, Met-tRNAi, tRNAi or no tRNA and different G-nucleotides. In the absence of IF3, the subunit docking proceeded to completion with all IF2 variants also in the complete absence of tRNA in the 30S PIC. This permitted direct estimation of the effects of formylation, methionylation and omission of tRNAi on the kinetics of subunit joining. We found the effective rate, kc, of 50S subunit docking to the 30S PICs containing fMet-tRNAi to be largely similar for the different IF2 variants (Figure 1). However, removal of tRNA from the 30S PIC led to a very different reduction of the subunit-docking rate for the different IF2 variants (Figure 1). For the A-type, B-type and wild-type IF2 variants, the reduction was about 2-, 10- and 20-fold (Figure 1D). Furthermore, exclusion of IF1 and mRNA from the 30S PIC did not significantly alter kc in the absence of tRNA (Figure 3). From these findings we conclude that the A-type IF2 mutants, but not wild-type IF2, bypass the requirement of an initiator tRNA in the P site, implying that fMet-tRNAi per se does not have an active role in subunit joining. It is, however, essential for activation of wild-type IF2 in the 30S PIC.
The bi-phasic subunit-joining kinetics was in all cases described by the model in Equation (1), where the 30S subunit was initially partitioned between an inactive form, 30SI, and an active form, 30SA. The fraction, fA, of 30S subunits initially active in docking to 50S subunits depended on mutations in IF2 and the different forms of tRNAi in the 30S PIC (Table I). For example, >90% of the 30S PICs with wild-type IF2 and about 100% of the 30S PICs with A-type IF2 mutants were active when fMet-tRNAi was present in the 30S PIC. In contrast, in the absence of tRNA, the active fraction of the 30S PIC was only 11% for wild type but >74% for A-type IF2 (Table I). Accordingly, the equilibrium constant K=k1/q1 for the partitioning of the 30S subunit between inactive and active forms in the absence of tRNA was increased by factors of about 2.6 and 27 by the B- and A-type mutations, respectively (Table I). Moreover, these mutations induced similar K-value shifts in the presence of Met-tRNAi, deacylated tRNAi or in the absence of tRNA in the 30S PIC (Table I). Surprisingly, the mutations similarly increased the K-values not only of GTP- but also GDP-bound IF2 explaining why the A-type IF2 mutants, but not wild-type IF2, promoted fast subunit joining in the presence of GDP and fMet-tRNAi in the 30S PIC (Table II). In the absence of guanine nucleotide, A-type IF2 did not promote rapid subunit docking even in the presence of fMet-tRNAi, meaning that GDP binding activated apo-IF2 (Table II). Indeed, comparison of K-values for A1-type IF2 with GDP and without G-nucleotide shows that GDP binding increased K by a factor of 8 in relation to G-nucleotide-free IF2 (Table II).
General properties of GTPases and their roles in bacterial mRNA translation
How do the surprising findings described in the previous section relate to what is known about GTPase action? Most members of the GTPase super family function as molecular switches (Bourne, 1995; Sprang, 1997). When GTP bound, they acquire their active (A) and when GDP bound their inactive (I) conformation. The GTPases share a common core structure, the G-domain, in which the GDP and GTP effector molecules have a common binding site. Structural analyses have revealed large conformational changes in the positioning of the switch-I and switch-II loops in the G-domain from flexible, solvent exposed states in the GDP-bound form to fixed, solvent protected, states in the GTP-bound form (Sprang, 1997; Hauryliuk et al, 2009). Rearrangements of these loops in response to guanine nucleotide swapping may result in large domain rearrangements of multidomain GTPases (Bourne, 1995; Sprang, 1997). It is commonly thought that global rearrangements, essential for GTPase function, are strictly correlated with guanine nucleotide exchange in the G-domain (Kong et al, 2004).
Four main GTPases function in bacterial protein synthesis (reviewed in Hershey, 1987; Ramakrishnan, 2002): (i) IF2 in initiation of mRNA translation (Fakunding and Hershey, 1973; Benne et al, 1973a, 1973b; Dever et al, 2001; Antoun et al, 2003), (ii) elongation factor Tu (EF-Tu) in aminoacyl-tRNA delivery to the ribosomal A site (Nissen et al, 1995; Ramakrishnan, 2002), (iii) elongation factor G (EF-G) in tRNA and mRNA translocation (Rodnina et al, 1997; Ramakrishnan, 2002; Frank et al, 2007) as well as in ribosomal recycling back to a new round of initiation after termination of protein elongation (Janosi et al, 1996; Karimi et al, 1999) and finally (iv) release factor 3 (RF3) in recycling of class-1 release factors after termination of protein synthesis (Freistroffer et al, 1997; Pavlov et al, 1997; Zavialov et al, 2001; Gao et al, 2007). To date, no crystal structure of bacterial IF2 is available, but the crystal structures of the GTP-bound, GDP-bound and guanine nucleotide free (apo) forms of its aIF5B archaeal orthologue display a similar global shape (Roll-Mecak et al, 2000). Crystal structures of EF-Tu show large domain movements between its GDP- and GTP-bound forms (Berchtold et al, 1993; Kjeldgaard et al, 1993; Nissen et al, 1999). In contrast, the crystal structures of GTP (GDPNP)-bound, GDP-bound and apo-forms of EF-G are very similar (AEvarsson et al, 1994; al-Karadaghi et al, 1996; Ramakrishnan, 2002; Hansson et al, 2005). However, a different conformation of GDPNP-bound EF-G has been observed in ribosomal complexes by cryo-electron microscopy (cryo-EM) (Frank et al, 2007). Concerning RF3, its crystal structure is only available for the GDP-bound form (Gao et al, 2007), but another global conformation of the GDPNP-bound form of RF3 has been observed by cryo-EM (Gao et al, 2007).
Conditional GTPase switching explains the effects of the A- and B-type mutations of IF2
To account for the paradox that some GTPases in solution remain in their inactive conformation even when GDP is replaced with GTP, while adopting their active conformation in complexes with the ribosome or other ligands (co-factors), we developed the concept of conditional conformational switching of GTPases (Hauryliuk et al, 2008a). In essence, the theory shows that when the equilibrium between the inactive (I) and active (A) conformation of the apo-form of the GTPase is greatly shifted towards the I-conformation, swapping of GDP to GTP may fail to significantly drive the GTPase to its A-conformation. However, in the presence of an auxiliary co-factor, such as tRNA, GDP to GTP swapping may readily switch the GTPase into its active A-form.
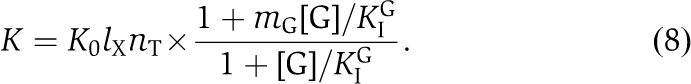
We analysed the entire data set in Tables I and II in terms of co-factor dependent switching from the 30SI to the 30SA form of the 30S PIC, and found that all results could be accounted for by conditional changes of the equilibrium constant, K, defining the ratio between the active and inactive forms of IF2 in complex with the 30S subunit, when written as (Materials and methods)
Here, K0 is the equilibrium constant for the partitioning of the active and inactive apo-forms of 30S-bound wild-type IF2 in the absence of guanine nucleotide and tRNA. The lX factor accounts for changes in K by mutations, mG accounts for the increase in K by addition of GTP or GDP and nT accounts for the increase in K due to addition of fMet-tRNAi, Met-tRNAi or tRNAi. From these definitions follow that lX=1 for wild-type IF2, mG=1 in the absence of guanine nucleotide and nT=1 in the absence of P-site bound tRNA. The validity of Equation (2) requires that 30S-bound IF2 is saturated by GTP or GDP. This assumption is supported by previous observations on the affinities of GDP and GTP to free as well as 30S-bound IF2 as discussed below in the section ‘Effect of IF2 activation on its guanine nucleotide binding affinity'.
We have found that lX, mG and nT were largely independent of each other, meaning that the contributions to the standard free energy difference between the active and inactive forms of IF2 on the 30S subunit from mutations, guanine nucleotide and P-site tRNA were additive. Accordingly, the whole data set of these experiments is described by eight parameters: K0=3.8 × 10⁻⁴ for the apo-form of 30S-bound wild-type IF2, lA=20 for the A-type mutant, lB=2 for the B-type mutant, mGTP=300, mGDP=8, nfMet-tRNAi=80, nMet-tRNAi=10 and ntRNAi=1.5. This result implies that the whole effect of an A-type or B-type mutation is a 20-fold or two-fold increase, respectively, of the equilibrium constant K0 for wild-type apo-IF2 from its value of ∼4 × 10⁻⁴. We note, further, that the fMet group on fMet-tRNAi increased K by a factor of 60, that the methionine group on Met-tRNAi increased K by a factor of 7, while addition of tRNAi itself did not significantly increase K (Table I). Binding of GTP to the apo-form of IF2 had the largest activation effect, increasing K by a factor of 300. Remarkably, binding of GDP to the apo-form of IF2 increased K by almost an order of magnitude, showing that not only GTP but also GDP binding activated IF2. This also implies that GDP has a larger affinity to the active than to the inactive form of IF2.
The latter result seems counterintuitive, since it is commonly believed that GTP stabilizes the active form of a G-protein and GDP stabilizes its inactive form. However, the partial activation of IF2 by GDP is in line with recent isothermal titration calorimetry (ITC) measurements of the enthalpies and entropies of guanine nucleotide binding to IF2 (Hauryliuk et al, 2009). Indeed, the ITC data suggest a conformational change in IF2 in response to GDP binding, which may account for the partial IF2 activation by GDP observed here. They further suggest that a similar conformational change occurs in response to GTP binding, but now accompanied by another conformational change, identified as solvent protection of the switch loops of IF2 (Hauryliuk et al, 2009). At the same time, ITC observations for EF-G do not indicate a GDP-induced conformational change (Hauryliuk et al, 2008b), suggesting that partial GDP activation is idiosyncratic to IF2 and does not occur for GTPases in general.
Effect of IF2 activation on its guanine nucleotide binding affinity
The dependence of the equilibrium constant K between the active and inactive forms of 30S-bound IF2 on mutations and the presence of tRNA ligands (Equation 2) determines also how the dissociation constant, Kd, for guanine nucleotide binding to IF2 depends on mutations and tRNA ligands. As previously shown (Hauryliuk et al, 2008a, 2008b), Kd is equivalent to an effective equilibrium constant, KeffG, averaged over the inactive and active forms of IF2 (see Supplementary data for details):
Here, G identifies the guanine nucleotide as GTP or GDP (i.e. for the mG parameter: mGTP=300 and mGDP=8) and KIG is the dissociation constant for guanine nucleotide binding to the inactive form of IF2. Since the ratio, β, between the dissociation constants for GDP (KAGDP) and GTP (KAGTP) to the active form of IF2 was estimated as 10 (Supplementary Figure S1D), it follows that KIGTP=(mGTP/β × mGDP) × KIGDP≈3.7 × KIGDP (Supplementary data). Accordingly, Equation (3) predicts the affinity of 30S-bound IF2 to GDP and GTP for all combinations of mutations and tRNA ligands in Tables I and II, provided that KIGDP is obtained from another type of experiment. Equation (3) also predicts that the measured Kd-value should be close to KIG when K≪1.
The affinity of GDP to IF2 is not noticeably affected by IF2 binding to the 30S subunit or by the presence of fMet-tRNAi in the 30S PIC (Antoun et al, 2003). A Kd-value of about 10 μM for GDP binding to 30S-bound IF2 in the absence of tRNA was estimated from GDP titration data in Antoun et al (2003). This Kd-value is in a good agreement with the Kd-value of 12 μM previously measured by equilibrium dialysis and NMR (Pon et al, 1985) and with an estimate Kd=4.5 μM obtained recently by ITC (Hauryliuk et al, 2009). Using the Kd-value of 10 μM as an approximation for KIGDP, the model (Equation 3) predicts the Kd-values for the complex between the 30S-bound wild-type IF2 and GTP in the absence and presence of fMet-tRNAi as 33 and 3.6 μM, respectively. These values are reasonably close to the previously estimated Kd-values of 40 and 2 μM for GTP binding to the 30S-bound IF2 in the absence and presence of fMet-tRNAi (Antoun et al, 2003). Moreover, the predicted Kd-value for GTP in the absence of tRNA is also similar to the Kd-value of about 30 μM for the binding of the fluorescent GTP analogue, mant-GTP, to free IF2 (Milon et al, 2006). This similarity is in line with the similar affinities of GTP to the free and 30S-bound IF2 in the absence of fMet-tRNAi observed previously (Antoun et al, 2003). Further validation of the model may be provided by comparison of the predicted with as yet unknown Kd-values for binding of guanine nucleotides to A- and B-type IF2 mutants in the presence of different tRNA ligands in the 30S PIC. For instance, Equation (3) predicts a much larger effect of the presence of fMet-tRNAi in the 30S PIC on the guanine nucleotide binding to the A-type than to wild-type IF2: it predicts the Kd-values for GDP binding to the 30S-bound A-type IF2 in the absence and presence of fMet-tRNAi as 9.5 and 2.7 μM, respectively and the corresponding Kd-values for GTP binding as 11.4 and 0.32 μM, respectively. Finally, the measured Kd-values of GTP and GDP binding to the 30S-bound wild-type IF2 in complex with different tRNA ligands and the predicted Kd-values for the IF2 mutants imply that at the 1 mM concentration of guanine nucleotides used in our experiments, IF2 is always saturated with GTP or GDP. This justifies the use of Equation (2) instead of a more general relation valid at non-saturating concentrations of guanine nucleotide (see Equation (8) in Materials and methods).
Structural anatomy of the tunable GTPase IF2
As discussed above, addition of GTP and fMet-tRNAi to 30S-bound apo-IF2 increases the equilibrium constant K by a factor of mGTP × nfMet-tRNAi=300 × 80=24 000. What is the structural corollary to this remarkably large, ∼2 × 10⁴-fold, shift between the inactive and active forms of IF2, and what determines the evolutionary fine-tuning of the equilibrium constant K0 of the apo-form of wild-type IF2 to such a low value as K0≈4 × 10⁻⁴?
To answer these questions, we first note that the interaction between domain IV (C2) of IF2 and the fMet group of fMet-tRNAi, firmly anchored by codon–anticodon interactions in the P-site of the 30S subunit, results in a continuous bridge-like structure, mainly composed of the IF2 body, complementary to the 50S surface (Simonetti et al, 2008). This, we suggest, is the active form of IF2 in the 30S PIC, which promotes rapid subunit docking. The structure of the inactive form of IF2 is not known, but some of its features may by guessed from X-ray crystal structures of the archaeal IF2 homologue, aIF5B (Roll-Mecak et al, 2000). When GDP replaces GTP in eIF5B, there is an 8° rotation of domains III and IV of the factor in relation to domain II and the G-domain. Such a rotation, expected to warp the IF2 surface on the 30S subunit, could be part of the conformational change that connects the active and inactive forms of the factor. In line with this, comparison of the three cryo-EM structures of IF2 in complex with the 70S ribosome and the 30S subunit shows IF2 to have different conformations in the 30S PIC and the 70S initiation complex (Allen et al, 2005; Myasnikov et al, 2005; Simonetti et al, 2008). In the 70S complex, the conformations of the GDP- and GTP- (GDPNP-) bound IF2 differ greatly (Myasnikov et al, 2005; Simonetti et al, 2008), due to different rotations of the C-terminal domains III and IV of IF2 in relation to domain II and the G-domain (Simonetti et al, 2008). From this, we propose that the A-type mutations in domain III of IF2 strongly favour rotation of the C-terminal domains of the 30S-bound IF2 relative to domain II and the G-domain towards the active conformation of the factor.
While the ∼2 × 10⁴-fold shift in favour of the active IF2 conformation due to fMet-tRNAi and GTP binding to the apo-form of IF2 was the same for the different IF2 variants, the absolute value of K was roughly 20-fold higher for the A-type than for the wild-type IF2 for any combination of tRNA and guanine nucleotide. Assuming that the K0-value for the apo-form of wild-type IF2 has been fine-tuned during evolution, one would expect the excessive IF2 activation by mutations to adversely affect bacterial growth. Indeed, while the excessive activation of IF2 by the A-type mutations increased the subunit-docking rate, the fitness of formylation-proficient cells harbouring A-type IF2 mutants was considerably reduced in relation to that of wild type (Zorzet et al, 2010). This effect has been explained by a higher propensity of A-type IF2 to promote formation of aberrant 70S ICs containing deacylated or un-formylated tRNAs (Zorzet et al, 2010). The reason underlying this behaviour can now be traced to the similar and large fractions, fA, of activated A-type IF2 in the presence of deacylated (82%), non-formylated (94%) and formylated (99%) initiator tRNA (Table I). We note, however, that GDP activation of A-type IF2 may preserve its active conformation in the 70S complex after GTP hydrolysis, thereby delaying dissociation of IF2 and subsequent peptide bond formation. This scenario could provide yet another fitness cost of the A-type mutations, and is presently studied in our laboratory.
A-type IF2 also displayed excessive activation (83%) in the presence of GDP and fMet-tRNAi (Table II), making initiation with A-type IF2 much less sensitive to variations in the GTP/GDP ratio than initiation with wild-type IF2 (Figure 6). This implies that bacterial strains with A-type IF2 could maintain excessive protein synthesis during conditions of energy shortage (reduced GTP/GDP ratio), with adverse effects on cell viability.
The present discussion about the structural background of IF2 activation by GTP and fMet-tRNAi for rapid subunit docking is qualitative and tentative. Yet, one would rather like to have structure-based, quantitative explanations for the 300- or 8-fold activation of IF2 on the 30S subunit upon GTP or GDP binding to IF2, respectively. One would, furthermore, like to have structural explanations for the 60-fold activation of IF2 by the fMet group in tRNAi, and its partitioning in about 9- and 7-fold contributions from the formyl and Met groups, respectively. Moreover, we have ascribed the transition between 50S-docking active and inactive states of the 30S PIC to conformational changes in IF2 assuming the structure of the 30S subunit unaltered. However, the 30S subunit is flexible (Ramakrishnan, 2008; Zhang et al, 2009) and translation-factor promoted conformational changes of this subunit are well documented (Ogle et al, 2003; Ramakrishnan, 2008), so that the quantitative structure-based explanation of the 30S PIC activation should include the structural alteration both in IF2 and in the 30S subunit. The recent advances in ribosome crystallography at near-atomic resolution (Selmer et al, 2006; Laurberg et al, 2008; Weixlbaumer et al, 2008; Gao et al, 2009; Schmeing et al, 2009; Schuette et al, 2009; Voorhees et al, 2009) in combination with powerful molecular simulation techniques (Carlsson et al, 2008; Trobro and Aqvist, 2008; Wallin and Aqvist, 2010) may make such a quantitative structural analysis feasible in the near future. In fact, the power of such a combination has recently been demonstrated by the explanation (Trobro and Aqvist, 2009; Sund et al, 2010) of the accuracy of codon reading by class-1 release factors (Freistroffer et al, 2000).
In summary, our results demonstrate a stepwise activation of IF2 by its natural GTP and fMet-tRNAi ligands. We have also shown that mutations in IF2 may compensate for the absence of one of these ligands. Such a stepwise IF2 activation provides a striking example of conditional activation of a GTP-binding protein by GTP and other ligands (Hauryliuk et al, 2008a).
Materials and methods
Chemicals and buffers
Phosphoenolpyruvate (PEP), myokinase (MK), pyruvate kinase (PK), inorganic pyrophosphotase (PPi), putrescine and spermidine were purchased from Sigma. Experiments were conducted in a polymix-like buffer, LS4, containing 95 mM KCl, 5 mM NH4Cl, 0.5 mM CaCl2, 8 mM putrescine, 1 mM spermidine, 30 mM HEPES pH 7.5, 1 mM DTE, 2 mM PEP, 1 mM GTP, 1 mM ATP and 6 mM Mg(OAc)2, supplemented with 1 μg ml–1 PK and 0.1 μg ml–1 MK (Pavlov et al, 2008). Since each ATP or GTP molecule chelate one Mg2+ cation, the actual free Mg2+ concentration in the LS4 buffer was 4 mM.
Components of the in vitro translation system
70S ribosomes, 50S and 30S subunits, [3H]fMet-tRNAi, initiation factors as well as Met and Phe animacyl-tRNA synthetases (MetRS and PheRS) were prepared from E. coli as described (Freistroffer et al, 1997; Antoun et al, 2004, 2006b). Initiation tRNAi, tRNAPhe were purchased from Sigma. mMFTI mRNA with a strong SD sequence was prepared as described in Pavlov et al (2008). Overproduced N-terminus-His-tagged wild-type and mutant S. typhimurium IF2s were isolated from Salmonella enterica Var. Typhimurium LT2 essentially as described in Antoun et al (2004). The following IF2 mutants were prepared: A1 (S755Y), A2 (S755F), A3 (E732K), B1 (A740V), B2 (A783V) and B3 (A393V) (Zorzet et al, 2010). The positions of the mutation in the IF2 structure are depicted in Supplementary Figure S2.
Comparison of the amino-acid sequences of wild-type IF2 from S. typhimurium and E. coli showed that they were >96% identical. The identity level was even higher, >98%, when the functionally dispensable N-terminal domain of IF2 (Caserta et al, 2010) was excluded. Accordingly, wild-type IF2s from S. typhimurium and E. coli behaved practically identically in all in vitro initiation experiments, which justifies the use of the well-characterized E. coli components in the biochemical experiments conducted in this study.
In vitro kinetic experiments
Two mixtures, 1 and 2, were prepared in LS4 buffer. Mixture 1 contained 0.32 μM 30S subunits, 0.8 μM mMFTI mRNA with a strong SD sequence (Pavlov et al, 2008), 1 μM IF1 and 0.6 μM IF2 unless specified otherwise. IF2 always refers to IF2 from S. typhimurium unless specified otherwise. Mixture 1 contained also 0.9 μM fMet-tRNAi, or 1.6 μM Met-tRNAi or 1.6 μM of deacylated tRNAi or no tRNA as specified for each experiment. Mixture 2 contained 0.36 μM 50S subunits. Both mixtures (1 and 2) were pre-incubated for 20 min at 37°C. When the effects of GDP were studied, the LS4 buffer contained 1 mM of GTP+GDP instead of 1 mM GTP and MK/PK enzymes were excluded. Met-tRNAi was methionylated in situ as follows. First, 200 μM initiator tRNA, 1 mM [3H]Met amino acid and 800 unit per ml MetRS in LS4 buffer supplemented with 1 μg ml–1 PK, 0.1 μg ml–1 PPi and 0.1 μg ml–1 MK (Jelenc and Kurland, 1979) were combined and pre-incubated for 20 min at 37°C and then put on ice. Just before loading into a stopped flow instrument (see below), a portion of this mixture was added to mixture 1 containing 30S PICs to obtain the final Met-tRNAi concentration of 1.6 μM. Pre-incubated mixtures 1 and 2 (0.6–0.8 ml volume of each) were loaded into the syringes of a stopped flow instrument (SX-20, Applied Photophysics, Leatherhead, UK). The kinetics of subunit joining was monitored at 37°C with light scattering after rapidly mixing equal volumes (usually 0.06 ml) of mixtures 1 and 2 as described (Antoun et al, 2006b). For each particular subunit association experiment, 6–8 high-quality light-scattering traces per 0.6–0.8 ml of mixes 1 and 2 were usually obtained. All concentrations in mixes 1 and 2 specified above are the final concentrations after the mixing.
Treatment of light-scattering data
Each particular subunit-joining experiment provided 6–8 light-scattering traces. These traces were used to obtain an average scattering trace and to estimate the average and standard deviation of the time, t0.5, at which the amplitude of light scattering change reached 50% of its maximal value. The time t0.5 obtained for the average scattering trace was always very close to the average t0.5 time. The effective rate, kc, of the initiation reaction was defined as the inverse of t0.5 for the average light-scattering trace. The above definition of kc is motivated by the relation:
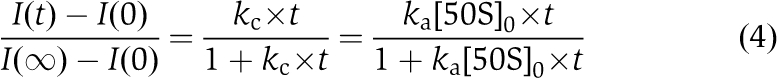 |
between scattering intensity and time, valid for the irreversible mono-phasic formation of a binary complex, A:B, from particles A and B mixed at equal concentrations (Antoun et al, 2006b). The effective rate kc of the A:B complex formation is equal to the product of the second-order rate constant ka of the binding reaction by the initial concentration of B particles (50S subunits in our case). Numerical simulations show that the relation ka=kc/[50S] holds also when B particles are added in a small excess over A particles.
Light-scattering traces describing the docking of 50S subunits to 30S PICs containing non-formylated Met-tRNAi, deacylated tRNAi or no tRNA and different IF2s were mainly bi-phasic and could not be fitted using relation (4) above. However, all light-scattering traces obtained in this study could be numerically fitted to a simple three-parameter kinetic model in Equation (1). This model describes the transitions between an active and an inactive states of the 30S PICs (with first-order rate constants k1 and q1) and the docking of 50S subunits to the active 30S PICs with the second-order rate constant ka. The obtained values of the three parameters k1, q1 and ka are compiled in Supplementary Tables S1 and S2 alone with the derived parameters K=k1/q1 and fA=K/(1+K). The numerical fitting procedure takes into account that the equilibrium between the active and inactive states of the 30S PICs defined by k1 and q1 has already established before the addition of 50S subunits (see also ‘Remarks on the fitting procedure' in the Supplementary data). This pre-existing equilibrium leads to a strong co-variation of the k1 and q1 parameters effectively reducing errors in K (see Supplementary Tables S1 and S2). For clarity of presentation, we used a digital filter to reduce the noise and the number of data points in the scattering traces shown in the figures. We have also attempted to fit our data using more complicated models involving additional intermediate states of the 30S PIC (between the fully active and inactive in the 50S binding) with reduced rate constants for the 50S binding. These more complicated models resulted only in a marginally better fit of the experimental data, which justifies the use of the simple kinetic model in Equation (1).
Conditional switching of IF2 from inactive to active form on the 30S subunit
The present analysis of how 30S-bound IF2 is partitioned between its inactive, 30SI, and its docking-active, 30SA, states under the influence of mutations, guanine nucleotides and P-site tRNA variants is adapted from previous work (Hauryliuk et al, 2008a).
The equilibrium partitioning of the inactive and active apo-forms of 30S-bound IF2, that is IF2 in the absence of guanine nucleotide and tRNA, have concentrations (or probabilities) related through an equilibrium constant K0lX:
The parameter lX, where X=wt, A or B, accounts for the effect of A-type and B-type mutations on the equilibrium constant, that is lwt=1. In the presence of various forms of initiator tRNA and guanine nucleotides under saturating conditions, the equilibrium relation (5) extends to (see Supplementary data for details):
In the absence of guanine nucleotide, the parameter mG=m0=1. In the presence of GDP or GTP, mG=mGDP or mG=mGTP, respectively, and
where KIG and KAG are the (equilibrium) dissociation constants for the binding of the guanine nucleotide variant G to the inactive or active forms of IF2, respectively. In the case of non-saturating concentrations of either GTP or GDP, the relation for K in (6) becomes (Supplementary data):
 |
In the absence of P-site tRNA, the parameter nT=n0=1. In the presence of fMet-tRNAi, Met-tRNAi or tRNAi, nT=nfMet-tRNAi, nT=nMet-tRNAi or nT=nMet-tRNAi, respectively, and
where KIT and KAT are the (equilibrium) dissociation constants for the binding of the tRNA variant T to the inactive or active forms of IF2, respectively.
When there is a mixture of GTP and GDP in the solution, defined by the ratio α=[GDP]/[GTP], the fraction, fA, of IF2 in the active form is given by (see Supplementary data for details):
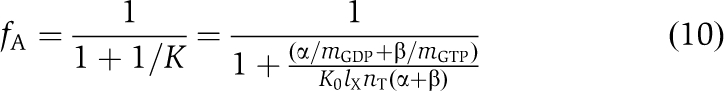 |
Here, β is the ratio between the dissociation (equilibrium) constants for GDP (KAGDP) and GTP (KAGTP) binding to the A-form of IF2:
By setting α=0 or letting α → ∞ in Equation (10), we retrieve Equation (6) with G=GTP or GDP, respectively. The value of parameter β for wild-type IF2 was determined from Equation (10) by non-linear fitting of the data on the fA dependence on GTP/(GTP+GDP) fraction (Supplementary Figure S1D) re-plotted as the α-dependence of fA.
Supplementary Material
Acknowledgments
We thank Dr Vasili Hauryliuk for valuable comments on the manuscript. This work was supported by the Swedish Research Council (to ME and DIA), the Swedish Research Council Linné-support (to ME) and the European Union 6th and 7th Framework Programmes (to DIA).
Footnotes
The authors declare that they have no conflict of interest.
References
- AEvarsson A, Brazhnikov E, Garber M, Zheltonosova J, Chirgadze Y, al-Karadaghi S, Svensson LA, Liljas A (1994) Three-dimensional structure of the ribosomal translocase: elongation factor G from Thermus thermophilus. EMBO J 13: 3669–3677 [DOI] [PMC free article] [PubMed] [Google Scholar]
- al-Karadaghi S, Aevarsson A, Garber M, Zheltonosova J, Liljas A (1996) The structure of elongation factor G in complex with GDP: conformational flexibility and nucleotide exchange. Structure 4: 555–565 [DOI] [PubMed] [Google Scholar]
- Allen GS, Zavialov A, Gursky R, Ehrenberg M, Frank J (2005) The cryo-EM structure of a translation initiation complex from Escherichia coli. Cell 121: 703–712 [DOI] [PubMed] [Google Scholar]
- Antoun A, Pavlov MY, Andersson K, Tenson T, Ehrenberg M (2003) The roles of initiation factor 2 and guanosine triphosphate in initiation of protein synthesis. EMBO J 22: 5593–5601 [DOI] [PMC free article] [PubMed] [Google Scholar]
- Antoun A, Pavlov MY, Lovmar M, Ehrenberg M (2006a) How initiation factors maximize the accuracy of tRNA selection in initiation of bacterial protein synthesis. Mol Cell 23: 183–193 [DOI] [PubMed] [Google Scholar]
- Antoun A, Pavlov MY, Lovmar M, Ehrenberg M (2006b) How initiation factors tune the rate of initiation of protein synthesis in bacteria. EMBO J 25: 2539–2550 [DOI] [PMC free article] [PubMed] [Google Scholar]
- Antoun A, Pavlov MY, Tenson T, Ehrenberg MM (2004) Ribosome formation from subunits studied by stopped-flow and Rayleigh light scattering. Biol Proced Online 6: 35–54 [DOI] [PMC free article] [PubMed] [Google Scholar]
- Benne R, Ebes F, Voorma HO (1973a) Sequence of events in initiation of protein synthesis. Eur J Biochem 38: 265–273 [DOI] [PubMed] [Google Scholar]
- Benne R, Naaktgeboren N, Gubbens J, Voorma HO (1973b) Recycling of initiation factors IF-1, IF-2 and IF-3. Eur J Biochem 32: 372–380 [DOI] [PubMed] [Google Scholar]
- Berchtold H, Reshetnikova L, Reiser CO, Schirmer NK, Sprinzl M, Hilgenfeld R (1993) Crystal structure of active elongation factor Tu reveals major domain rearrangements. Nature 365: 126–132 [DOI] [PubMed] [Google Scholar]
- Bourne HR (1995) GTPases: a family of molecular switches and clocks. Philos Trans R Soc Lond B Biol Sci 349: 283–289 [DOI] [PubMed] [Google Scholar]
- Carlsson J, Boukharta L, Aqvist J (2008) Combining docking, molecular dynamics and the linear interaction energy method to predict binding modes and affinities for non-nucleoside inhibitors to HIV-1 reverse transcriptase. J Med Chem 51: 2648–2656 [DOI] [PubMed] [Google Scholar]
- Caserta E, Ferrara C, Milon P, Fabretti A, Rocchetti A, Tomsic J, Pon CL, Gualerzi CO, La Teana A (2010) Ribosomal interaction of Bacillus stearothermophilus translation initiation factor IF2: characterization of the active sites. J Mol Biol 396: 118–129 [DOI] [PubMed] [Google Scholar]
- Dever TE, Roll-Mecak A, Choi SK, Lee JH, Cao C, Shin BS, Burley SK (2001) Universal translation initiation factor IF2/eIF5B. Cold Spring Harb Symp Quant Biol 66: 417–424 [DOI] [PubMed] [Google Scholar]
- Fakunding JL, Hershey JW (1973) The interaction of radioactive initiation factor IF-2 with ribosomes during initiation of protein synthesis. J Biol Chem 248: 4206–4212 [PubMed] [Google Scholar]
- Frank J, Gao H, Sengupta J, Gao N, Taylor DJ (2007) The process of mRNA-tRNA translocation. Proc Natl Acad Sci USA 104: 19671–19678 [DOI] [PMC free article] [PubMed] [Google Scholar]
- Freistroffer DV, Kwiatkowski M, Buckingham RH, Ehrenberg M (2000) The accuracy of codon recognition by polypeptide release factors. Proc Natl Acad Sci USA 97: 2046–2051 [DOI] [PMC free article] [PubMed] [Google Scholar]
- Freistroffer DV, Pavlov MY, MacDougall J, Buckingham RH, Ehrenberg M (1997) Release factor RF3 in E. coli accelerates the dissociation of release factors RF1 and RF2 from the ribosome in a GTP-dependent manner. EMBO J 16: 4126–4133 [DOI] [PMC free article] [PubMed] [Google Scholar]
- Gao H, Zhou Z, Rawat U, Huang C, Bouakaz L, Wang C, Cheng Z, Liu Y, Zavialov A, Gursky R, Sanyal S, Ehrenberg M, Frank J, Song H (2007) RF3 induces ribosomal conformational changes responsible for dissociation of class I release factors. Cell 129: 929–941 [DOI] [PubMed] [Google Scholar]
- Gao YG, Selmer M, Dunham CM, Weixlbaumer A, Kelley AC, Ramakrishnan V (2009) The structure of the ribosome with elongation factor G trapped in the posttranslocational state. Science 326: 694–699 [DOI] [PMC free article] [PubMed] [Google Scholar]
- Gualerzi CO, Brandi L, Caserta E, Garofalo C, Lammi M, La Teana A, Petrelli D, Spurio R, Tomsic J, Pon CL (2001) Initiation factors in the early events of mRNA translation in bacteria. Cold Spring Harb Symp Quant Biol 66: 363–376 [DOI] [PubMed] [Google Scholar]
- Guillon JM, Heiss S, Soutourina J, Mechulam Y, Laalami S, Grunberg-Manago M, Blanquet S (1996) Interplay of methionine tRNAs with translation elongation factor Tu and translation initiation factor 2 in Escherichia coli. J Biol Chem 271: 22321–22325 [DOI] [PubMed] [Google Scholar]
- Guillon JM, Mechulam Y, Schmitter JM, Blanquet S, Fayat G (1992) Disruption of the gene for Met-tRNA(fMet) formyltransferase severely impairs growth of Escherichia coli. J Bacteriol 174: 4294–4301 [DOI] [PMC free article] [PubMed] [Google Scholar]
- Hansson S, Singh R, Gudkov AT, Liljas A, Logan DT (2005) Crystal structure of a mutant elongation factor G trapped with a GTP analogue. FEBS Lett 579: 4492–4497 [DOI] [PubMed] [Google Scholar]
- Hartz D, McPheeters DS, Gold L (1989) Selection of the initiator tRNA by Escherichia coli initiation factors. Genes Dev 3: 1899–1912 [DOI] [PubMed] [Google Scholar]
- Hauryliuk V, Hansson S, Ehrenberg M (2008a) Cofactor dependent conformational switching of GTPases. Biophys J 95: 1704–1715 [DOI] [PMC free article] [PubMed] [Google Scholar]
- Hauryliuk V, Mitkevich VA, Draycheva A, Tankov S, Shyp V, Ermakov A, Kulikova AA, Makarov AA, Ehrenberg M (2009) Thermodynamics of GTP and GDP binding to bacterial initiation factor 2 suggests two types of structural transitions. J Mol Biol 394: 621–626 [DOI] [PubMed] [Google Scholar]
- Hauryliuk V, Mitkevich VA, Eliseeva NA, Petrushanko IY, Ehrenberg M, Makarov AA (2008b) The pretranslocation ribosome is targeted by GTP-bound EF-G in partially activated form. Proc Natl Acad Sci USA 105: 15678–15683 [DOI] [PMC free article] [PubMed] [Google Scholar]
- Hershey JW (1987) Protein synthesis. In Escherichia coli and Salmonella Typhimurium: Cellular and Molecular Biology, Neidhardt FC, Ingraham J, Low K, Magasanik B, Schaechter M, Umbarger H (eds). Washington, DC: American Society for Microbiology [Google Scholar]
- Janosi L, Hara H, Zhang S, Kaji A (1996) Ribosome recycling by ribosome recycling factor (RRF)--an important but overlooked step of protein biosynthesis. Adv Biophys 32: 121–201 [DOI] [PubMed] [Google Scholar]
- Jelenc PC, Kurland CG (1979) Nucleoside triphosphate regeneration decreases the frequency of translation errors. Proc Natl Acad Sci USA 76: 3174–3178 [DOI] [PMC free article] [PubMed] [Google Scholar]
- Karimi R, Pavlov MY, Buckingham RH, Ehrenberg M (1999) Novel roles for classical factors at the interface between translation termination and initiation. Mol Cell 3: 601–609 [DOI] [PubMed] [Google Scholar]
- Kjeldgaard M, Nissen P, Thirup S, Nyborg J (1993) The crystal structure of elongation factor EF-Tu from Thermus aquaticus in the GTP conformation. Structure 1: 35–50 [DOI] [PubMed] [Google Scholar]
- Kong C, Ito K, Walsh MA, Wada M, Liu Y, Kumar S, Barford D, Nakamura Y, Song H (2004) Crystal structure and functional analysis of the eukaryotic class II release factor eRF3 from S. pombe. Mol Cell 14: 233–245 [DOI] [PubMed] [Google Scholar]
- Laurberg M, Asahara H, Korostelev A, Zhu J, Trakhanov S, Noller HF (2008) Structural basis for translation termination on the 70S ribosome. Nature 454: 852–857 [DOI] [PubMed] [Google Scholar]
- Luchin S, Putzer H, Hershey JW, Cenatiempo Y, Grunberg-Manago M, Laalami S (1999) In vitro study of two dominant inhibitory GTPase mutants of Escherichia coli translation initiation factor IF2. Direct evidence that GTP hydrolysis is necessary for factor recycling. J Biol Chem 274: 6074–6079 [DOI] [PubMed] [Google Scholar]
- Milon P, Konevega AL, Gualerzi CO, Rodnina MV (2008) Kinetic checkpoint at a late step in translation initiation. Mol Cell 30: 712–720 [DOI] [PubMed] [Google Scholar]
- Milon P, Tischenko E, Tomsic J, Caserta E, Folkers G, La Teana A, Rodnina MV, Pon CL, Boelens R, Gualerzi CO (2006) The nucleotide-binding site of bacterial translation initiation factor 2 (IF2) as a metabolic sensor. Proc Natl Acad Sci USA 103: 13962–13967 [DOI] [PMC free article] [PubMed] [Google Scholar]
- Myasnikov AG, Marzi S, Simonetti A, Giuliodori AM, Gualerzi CO, Yusupova G, Yusupov M, Klaholz BP (2005) Conformational transition of initiation factor 2 from the GTP- to GDP-bound state visualized on the ribosome. Nat Struct Mol Biol 12: 1145–1149 [DOI] [PubMed] [Google Scholar]
- Nissen P, Kjeldgaard M, Thirup S, Polekhina G, Reshetnikova L, Clark BF, Nyborg J (1995) Crystal structure of the ternary complex of Phe-tRNAPhe, EF-Tu, and a GTP analog. Science 270: 1464–1472 [DOI] [PubMed] [Google Scholar]
- Nissen P, Thirup S, Kjeldgaard M, Nyborg J (1999) The crystal structure of Cys-tRNACys-EF-Tu-GDPNP reveals general and specific features in the ternary complex and in tRNA. Structure 7: 143–156 [DOI] [PubMed] [Google Scholar]
- Ogle JM, Carter AP, Ramakrishnan V (2003) Insights into the decoding mechanism from recent ribosome structures. Trends Biochem Sci 28: 259–266 [DOI] [PubMed] [Google Scholar]
- Pavlov MY, Antoun A, Lovmar M, Ehrenberg M (2008) Complementary roles of initiation factor 1 and ribosome recycling factor in 70S ribosome splitting. EMBO J 27: 1706–1717 [DOI] [PMC free article] [PubMed] [Google Scholar]
- Pavlov MY, Freistroffer DV, MacDougall J, Buckingham RH, Ehrenberg M (1997) Fast recycling of Escherichia coli ribosomes requires both ribosome recycling factor (RRF) and release factor RF3. EMBO J 16: 4134–4141 [DOI] [PMC free article] [PubMed] [Google Scholar]
- Pon CL, Paci M, Pawlik RT, Gualerzi CO (1985) Structure-function relationship in Escherichia coli initiation factors. Biochemical and biophysical characterization of the interaction between IF-2 and guanosine nucleotides. J Biol Chem 260: 8918–8924 [PubMed] [Google Scholar]
- Ramakrishnan V (2002) Ribosome structure and the mechanism of translation. Cell 108: 557–572 [DOI] [PubMed] [Google Scholar]
- Ramakrishnan V (2008) What we have learned from ribosome structures. Biochem Soc Trans 36: 567–574 [DOI] [PubMed] [Google Scholar]
- Rodnina MV, Savelsbergh A, Katunin VI, Wintermeyer W (1997) Hydrolysis of GTP by elongation factor G drives tRNA movement on the ribosome. Nature 385: 37–41 [DOI] [PubMed] [Google Scholar]
- Roll-Mecak A, Cao C, Dever TE, Burley SK (2000) X-Ray structures of the universal translation initiation factor IF2/eIF5B: conformational changes on GDP and GTP binding. Cell 103: 781–792 [DOI] [PubMed] [Google Scholar]
- Schmeing TM, Voorhees RM, Kelley AC, Gao YG, Murphy FV IV, Weir JR, Ramakrishnan V (2009) The crystal structure of the ribosome bound to EF-Tu and aminoacyl-tRNA. Science 326: 688–694 [DOI] [PMC free article] [PubMed] [Google Scholar]
- Schuette JC, Murphy FV IV, Kelley AC, Weir JR, Giesebrecht J, Connell SR, Loerke J, Mielke T, Zhang W, Penczek PA, Ramakrishnan V, Spahn CM (2009) GTPase activation of elongation factor EF-Tu by the ribosome during decoding. EMBO J 28: 755–765 [DOI] [PMC free article] [PubMed] [Google Scholar]
- Selmer M, Dunham CM, Murphy FV IV, Weixlbaumer A, Petry S, Kelley AC, Weir JR, Ramakrishnan V (2006) Structure of the 70S ribosome complexed with mRNA and tRNA. Science 313: 1935–1942 [DOI] [PubMed] [Google Scholar]
- Simonetti A, Marzi S, Myasnikov AG, Fabbretti A, Yusupov M, Gualerzi CO, Klaholz BP (2008) Structure of the 30S translation initiation complex. Nature 455: 416–420 [DOI] [PubMed] [Google Scholar]
- Sprang SR (1997) G protein mechanisms: insights from structural analysis. Annu Rev Biochem 66: 639–678 [DOI] [PubMed] [Google Scholar]
- Steiner-Mosonyi M, Creuzenet C, Keates RA, Strub BR, Mangroo D (2004) The Pseudomonas aeruginosa initiation factor IF-2 is responsible for formylation-independent protein initiation in P. aeruginosa. J Biol Chem 279: 52262–52269 [DOI] [PubMed] [Google Scholar]
- Sund J, Ander M, Aqvist J (2010) Principles of stop-codon reading on the ribosome. Nature 465: 947–950 [DOI] [PubMed] [Google Scholar]
- Sundari RM, Stringer EA, Schulman LH, Maitra U (1976) Interaction of bacterial initiation factor 2 with initiator tRNA. J Biol Chem 251: 3338–3345 [PubMed] [Google Scholar]
- Trobro S, Aqvist J (2008) Role of ribosomal protein L27 in peptidyl transfer. Biochemistry 47: 4898–4906 [DOI] [PubMed] [Google Scholar]
- Trobro S, Aqvist J (2009) Mechanism of the translation termination reaction on the ribosome. Biochemistry 48: 11296–11303 [DOI] [PubMed] [Google Scholar]
- Voorhees RM, Weixlbaumer A, Loakes D, Kelley AC, Ramakrishnan V (2009) Insights into substrate stabilization from snapshots of the peptidyl transferase center of the intact 70S ribosome. Nat Struct Mol Biol 16: 528–533 [DOI] [PMC free article] [PubMed] [Google Scholar]
- Wallin G, Aqvist J (2010) The transition state for peptide bond formation reveals the ribosome as a water trap. Proc Natl Acad Sci USA 107: 1888–1893 [DOI] [PMC free article] [PubMed] [Google Scholar]
- Weixlbaumer A, Jin H, Neubauer C, Voorhees RM, Petry S, Kelley AC, Ramakrishnan V (2008) Insights into translational termination from the structure of RF2 bound to the ribosome. Science 322: 953–956 [DOI] [PMC free article] [PubMed] [Google Scholar]
- Wintermeyer W, Gualerzi C (1983) Effect of Escherichia coli initiation factors on the kinetics of N-Acphe-tRNAPhe binding to 30S ribosomal subunits. A fluorescence stopped-flow study. Biochemistry 22: 690–694 [DOI] [PubMed] [Google Scholar]
- Zavialov AV, Buckingham RH, Ehrenberg M (2001) A posttermination ribosomal complex is the guanine nucleotide exchange factor for peptide release factor RF3. Cell 107: 115–124 [DOI] [PubMed] [Google Scholar]
- Zhang W, Dunkle JA, Cate JH (2009) Structures of the ribosome in intermediate states of ratcheting. Science 325: 1014–1017 [DOI] [PMC free article] [PubMed] [Google Scholar]
- Zorzet A, Pavlov MY, Nilsson AI, Ehrenberg M, Andersson DI (2010) Error-prone initiation factor 2 mutations reduce the fitness cost of antibiotic resistance. Mol Microbiol 75: 1299–1313 [DOI] [PMC free article] [PubMed] [Google Scholar]
Associated Data
This section collects any data citations, data availability statements, or supplementary materials included in this article.