Abstract
Both CIEF and MALDI-MS are frequently used in protein analysis, but hyphenation of the two is not investigated proportionally. One of the major reasons is that the additives (such as carrier ampholytes and detergent) in CIEF severely suppress the MALDI-MS signal, which hampers the hyphenation of the two. In this paper, we develop a simple means to alleviate the above signal-suppressing effect. We first deposit 1 µL of water onto a MALDI-MS target, deliver a fraction of CIEF-separated protein (~0.1 µL) to the water droplet, evaporate the solvent, add 0.5 µL of MALDI matrix to the sample spot, dry the matrix, and move the target plate to a MALDI-TOF-MS for mass spectrum measurement. We optimize the droplet volume and the laser-ablation region. Under the optimized conditions, we improve the signal to noise ratio by 2–10 fold. We also apply this method for two-dimensional separations of standard proteins and Apolipoprotein A-I, a membrane protein expressed in E. Coli cells.
1 Introduction
Isoelectric focusing (IEF) is one of the most popularly used techniques for protein separations. In IEF, proteins are self-focused into narrow zones at positions corresponding to their pI values and the widths of these zones are inversely proportional to the square root of the focusing electric field strength. Theoretically, any protein zone can be compressed into a line-like band as long as the electric field strength is sufficiently high. In practice, however, the magnitude of the electric field strength is constrained by Joule heating. To overcome this problem, IEF is performed in a narrow-bore capillary (capillary isoelectric focusing or CIEF for short [1, 2]) in which excess Joule heat can be effectively dissipated through the wall of the capillary due to the increase surface-to-volume ratio.
The operation of CIEF consists of two major steps. In the first step, a mixture of carrier ampholytes and proteins is introduced into a capillary, and a DC voltage is applied to form a pH gradient and focus proteins inside the capillary. In the second step, the focused protein zones are mobilized passing through a detector for measurement. The mobilization can be executed hydrodynamically [3], electroosmotically [4], or chemically [5]. Usually, the separated proteins are detected using a fixed-point UV absorbance or fluorescence detector. A whole-column detection approach has also been used recently to detect focused proteins without the mobilization step [6, 7]. While these detectors work well to monitor the separations, they are incapable of identifying the separated proteins. Incorporation of CIEF with a mass spectrometer (MS) can potentially address this issue.
Coupling of CIEF with electrospray (ESI) MS was accomplished in the 1990’s [8–12], and is capable of providing attomole sensitivity due to the concentration effect associated with CIEF [13]. CIEF-ESI-MS has been successfully applied for the analysis of a single protein (e.g., hemoglobin [11], alcohol dehydrogenase isoenzymes [14] and complex cell lysates [15, 16]. Matrix-assisted laser desorption/ionization (MALDI) MS, introduced in 1988 [17, 18], is another MS technique that is widely utilized for protein analysis. MALDI-MS is capable of analyzing large intact proteins with molecular mass in excess of 100 kDa [19]. However, CIEF-MALDI-MS attracted much less attention than CIEF-ESI-MS, presumably due to the challenges of coupling CIEF with MALDI-MS.
In 1995, Foret et al. [20] demonstrated the feasibility of off-line coupling of CIEF with MALDI-MS. In Foret’s apparatus, a fiber-optic UV detector was attached to a CIEF capillary to determine the mobilization speeds and measure the bandwidths of separated proteins. With these parameters, every separated protein band was precisely fractionated. A sheath flow unit was incorporated at the exit of the capillary to facilitate the fractionation and distribution of these bands to a parallel-glass-tube collection interface [9]. An aliquot (2 µL) of each collected sample was then deposited onto a MALDI target. After the solvent was evaporated, 2 µL of a matrix solution was added. Evaporation of the matrix solvent resulted in the formation of protein-matrix crystals on the sample spot. This sample was then analyzed by a MALDI-MS. More recently [21, 22], CIEF-separated proteins, along with the focusing medium, were fractionated via a sheath flow unit and deposited directly onto a MALDI-MS target. Peak resolution of this method increased with the decreasing deposition times. Under optimized conditions, most of the CIEF resolution was retained [21]. However, the additives (ampholytes and surfactants) in the focusing medium reduce the MS signals considerably. In our lab, the similar effect was observed: Pharmalyte™ and 3-[(3-Cholamidopropyl)dimethylammonio]-1-propanesulfonate (CHAPS) severely suppressed the MS sensitivity. Because adequate additives are required to achieve proper CIEF separations, minimizing the signal suppression effect of these additives is therefore important.
In this work, we report a simple means to mitigate the above adverse effect. We first dropped a small volume (~1 µL) of water onto a MALDI-MS target. We then distributed a fraction of the CIEF-separated sample (~0.1 µL) to the center region and close to the bottom of the droplet. Likely because small additive molecules (carrier ampholytes, detergent and other salts) diffused faster than proteins, more protein molecules remained in the center region of the sample spot after the solvent was evaporated. By directing the laser to this region to ablate the sample, we improved the MS signal to noise ratio (S/N). We optimized the droplet volume and the laser-ablation region to maximize the S/N. We also applied this method for analysis of Apolipoprotein A-I (apoA-I, a membrane protein) expressed in E. Coli cells.
2 Materials and methods
2.1 Materials
Ribonuclease A (13.7 kDa, pI 9.60), horse myoglobin (16.9 kDa, pI 7.35 and 6.85), β-lactoglobulin B (18.3 kDa, pI 5.30), β-lactoglobulin A (18.4 kDa, pI 5.15), soybean trypsin inhibitor (20.1 kDa, pI 4.55), 3-(trimethoxysilyl)propyl methacrylate, α-cyano-4-hydroxycinnamic acid and cellulose acetate (CA) (39.7 wt%, average MW 50 kDa) were purchased from Sigma (St. Louis, MO). Pharmalyte (36% w/v, pH 3–10) was purchased from Amersham Bioscience (Piscataway, NJ). Acrylamide (AA), N,N’-methylene-bisacrylamide (Bis), ammonium persulfate (APS), and N,N,N’,N’-tetramethylethylenediamine (TEMED) were bought from Bio-Rad Laboratories (Hercules, CA). CHAPS was obtained from Acros Organics (Morris Plains, NJ). Ammonia acetate was purchased from Mallinckrodt Chemicals (Phillipsburg, NJ). Phosphoric acid (85%), sodium hydroxide, acetic acid, acetone, trifluoroacetic acid (TFA), methanol, and acetonitrile were bought from Fisher Scientific (Pittsburgh, PA). All solutions were prepared with ultrapure water purified by a NANOpure infinity ultrapure water system (Barnstead, Newton, WA). Fused-silica capillaries were purchased from Polymicro Technologies (Phoenix, AZ).
2.2 Preparation of cross-linked polyacryamide coated capillary
The coating procedure was similar to that reported previously [23], with slight modifications. Briefly, a fused-silica capillary (60 cm long × 150 µm i.d. × 375 µm o.d.) was washed with 1.0 M NaOH for 45 min, rinsed with DI water and acetonitrile each for 15 min, and then dried by flowing helium at 5 psi for 20 min. A solution of 0.40% (v/v) of 3-(trimethoxysilyl) propyl methacrylate and 0.20% (v/v) acetic acid in acetonitrile was flushed into the capillary for 1 hour. The capillary was then rinsed with acetonitrile for 15 min and dried by flowing helium at 5 psi through the capillary for 20 min. After 2.0 mL solution containing 4.0% (w/v) of AA and 0.024% Bis was purged with helium at 5 psi at room temperature for 1 hour, 1.0 µL of 10% APS and 10 µL of TEMED were added to the solution. This solution was immediately pressured into the capillary. After 1.5 min, the solution was pushed out with pressurized helium at 60 psi, and the helium was allowed to continuously blow through the capillary for 1 hour. The capillary was ready to use after it was rinsed with water for ~10 min.
2.3 Apolipoprotein A-I sample
ApoA-I sample was kindly provided by Ms. Shou Lu in Professor Zgurskaya’s group in the Department of Chemistry and Biochemistry at University of Oklahoma. The sample was prepared and quantitated according to a previously published procedure [24].
2.4 Construction of cellulose acetate membrane grounding interface
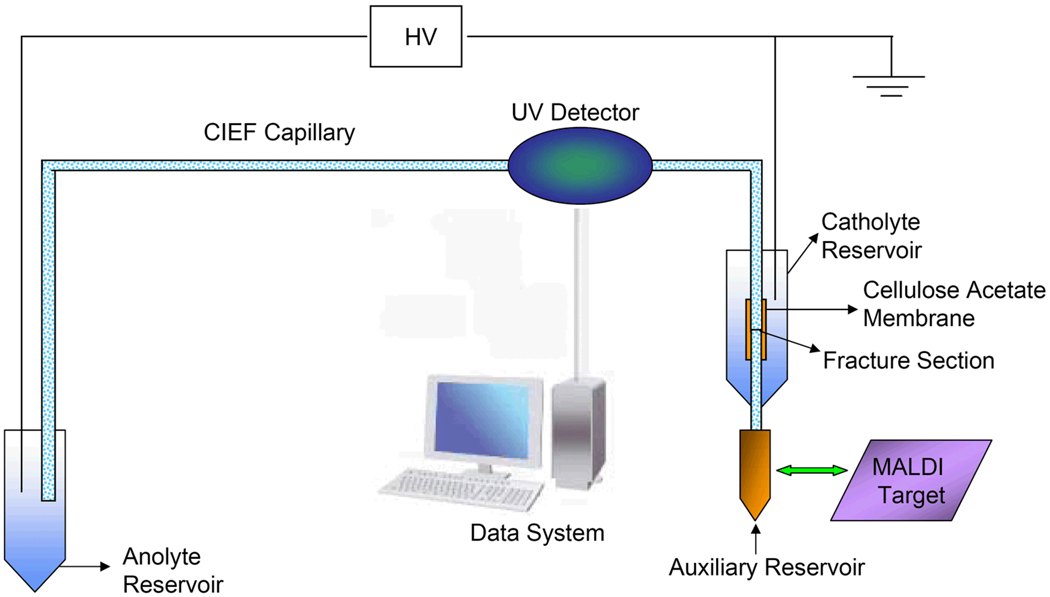
The construction procedure was similar to that described by Whang [25] and Chen and Wang [26], with minor modifications. Briefly, a fracture was first produced at ~1.5 cm from one end of a cross-linked polyacryamide (CPA)-coated capillary, and a tiny drop of 12% (w/v) CA solution in acetone was applied to the fracture to evenly cover it. After the solvent was evaporated, a CA membrane was formed around the fracture. A small hole was then created at the bottom of a 0.65 mL plastic vial (Fisher Scientific, Pittsburgh, PA), and the vial was affixed to the CPA coated capillary with CA-covered fracture inside it (see Figure 1). Epoxy (Devcon, Riviera Beach, FL) was used to secure the vial and the capillary in position and seal the hole.
Figure 1. Schematic diagram of apparatus for CIEF separation and fractionation.
2.5 Apparatus
Figure 1 presents a schematic diagram of the experimental apparatus. The above CPA coated capillary with a CA membrane grounding interface was used to perform CIEF separation, and the focusing voltage was provided by a Glassman high-voltage power supply (High Bridge, NJ). The anode was inserted in the anolyte and the cathode in the catholyte. The exit end of the capillary was immersed in the water in the auxiliary reservoir. As the separated proteins were mobilized from anode to cathode, they were monitored by a Linear-200 UV/visible detector (Linear Instruments Corp., Reno, NV) at 280 nm. The absorbance signal was acquired by an NI multifunctional card DAQCard-6062e (National Instruments, Austin, TX), and processed with an in-house-developed LabView program.
2.6 CIEF
To prepare for CIEF, the separation capillary along with the CA membrane grounding interface were rinsed with DI water, and the vial of the interface was loaded with a catholyte solution (20 mM of sodium hydroxide). After the capillary was filled with a mixture of protein(s) and focusing medium (Pharmalyte, CHAPS, and ammonia acetate), its exit end was inserted into a small container containing DI water (see Figure 1). The other end of the capillary was inserted into a container containing an anolyte solution (10 mM of Phosphoric acid). Isoelectric focusing was initiated by applying a high voltage (20 kV) from the anolyte solution to the catholyte solution, and took ~20 min to complete. For absorbance detection of CIEF separated proteins, the focused bands were hydrodynamically mobilized to a UV/visible detector by lifting the anolyte solution by 2 cm relative to the water in the auxiliary reservoir at the exit end of the capillary while the high voltage was maintained during the entire mobilization process.
2.7 Protein fractionation/deposition and MALDI-MS identification
To prepare for protein fractionation/deposition, 1.0 µL of water was deposited at designated spot on a MALDI-MS target plate in the ambient environment a 3–5 seconds before the completion of CIEF focusing. After the auxiliary reservoir hosting the exit end of the capillary was removed, the MALDI-MS target plate with the water droplet was lifted (in the z-axis via a translation stage) so that the capillary tip was inserted into the water droplet with the capillary tip virtually touching the target plate. By raising the anolyte solution by 2 cm, the solution inside the capillary was delivered to the water droplet. During this delivering process, 1.0 µL of water was deposited at another spot on the target plate. After 30 second delivery, the target plate was dropped by 2–3 mm in the z-axis, shifted 4.5 mm in the x- or y-axis and lifted 2–3 mm in the z-axis for deposition/delivery to the next spot. This operation was repeated until all the focused proteins inside the capillary were delivered to the target plate. During this process, the high voltage was applied across the capillary continuously.
After the above fractionation process was complete, the solvent in the water droplets were allowed to evaporate. It took ~9 min for each 1.0 µL water-droplet to get dried under the ambient conditions. Then, 0.5 µL MALDI matrix [10 mg/mL α-cyano-4-hydroxycinnamic acid in 50% (v/v) water-acetonitrile with 0.1% (v/v) TFA] was added to each spot and allowed to dry again (which took ~5 min). Finally, the target plate was loaded into an Applied Biosystems 4800 Proteomics Analyzer for MALDI-MS identification. The m/z range of the system was set to 11 kDa-22 kDa or 35 kDa with a focus m/z of 16 kDa or 23 kDa in linear mode. MALDI-TOF spectra were analyzed using Data Explorer software Version 3.0 (Applied Biosystems).
3 Results and discussion
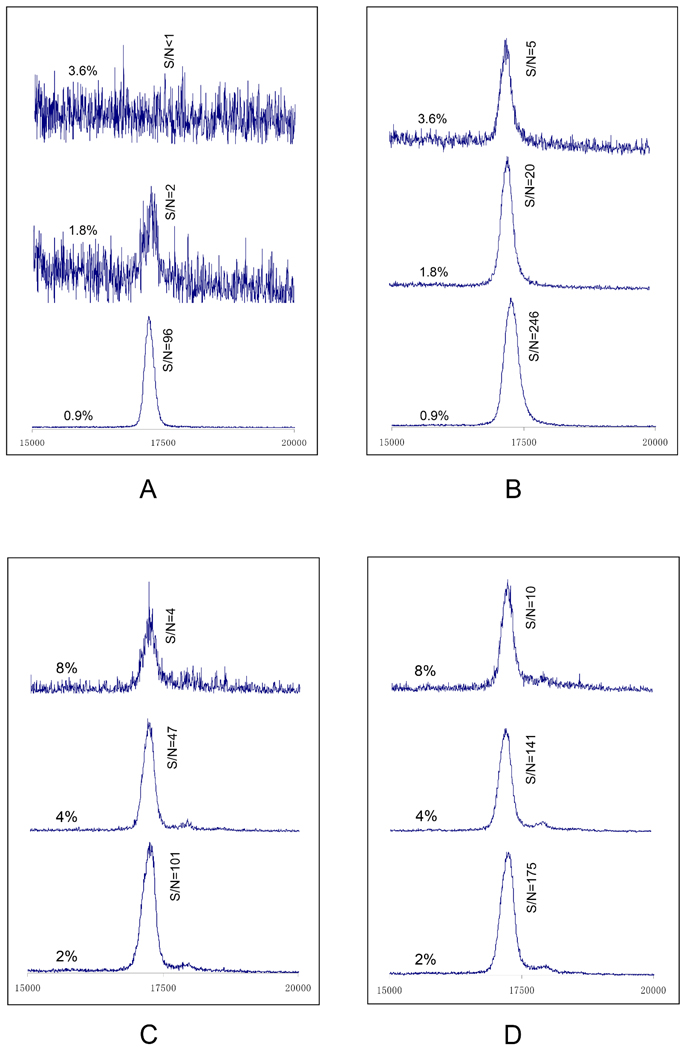
To examine the effect of additives on MS signal to noise (peak-to-peak noise) ratio, we mixed Pharmalyte or CHAPS (not both) at varying concentrations with a protein, and deposit this solution (~0.2 µL per spot) either directly onto a MALDI-MS target plate or into a 1 µL water droplet on the target plate. After the solvent was evaporated, we added 0.5 µL of MALDI-MS matrix (10 mg/mL α-cyano-4-hydroxycinnamic acid) to each sample spot and allowed the sample to dry again. Figure 2 exhibits the effect of Pharmalyte and CHAPS concentration on the MS signal. Apparently (see Figure 2A and 2C), these additives severely suppress the MS signal. At 3.6% Pharmalyte, no MS signal could be detected. Interestingly (see Figure 2B and 2D), this effect can be alleviated considerably by depositing the protein mixture to a 1 µL water droplet pre-loaded on the target plate, with a S/N improvement of 2–10 fold.
Figure 2. Effect of Pharmalyte and CHAPS on MS signal.
In this experiment the sample contained 0.05 µg/µL horse myoglobin and varying concentrations of Pharmalyte or CHAPS (not both). 0.2 µL of this sample was delivered either directly to a MALDI target plate (for Figures 2A and 2C) or to 1 µL of water pre-deposited on the target plate (for Figure 2B and 2D). The sample was allowed to dry, and 0.5 µL of a matrix solution containing 10 mg/mL of α-cyano-4-hydroxycinnamic acid and 0.1% TFA in 1:1 acetonitrile-water was added to the sample spot. After the matrix solvent was evaporated, the target plate was transferred to an Applied Biosystems 4800 Proteomics Analyzer. The MS spectra were measured at an m/z range of 11 kDa-22 kDa or 35 kDa with a focus m/z of 16 kDa or 23 kDa in a linear mode. Spectra in Figures 2A and 2B were obtained from the protein-Pharmalyte mixtures, while spectra in Figures 2C and 2D were obtained from the protein-CHAPS mixtures.
In the above tests, we simply added Pharmalyte or CHAPS to the protein for MS measurements. To make the test more representative to the experimental protocol for CIEF-MALDI-MS, we performed CIEF with different concentrations of Pharmalyte and CHAPS, fractionated the CIEF-separated proteins and deposited them (along with the focusing medium) into 1-µL-water droplets pre-loaded on the target plate. The remaining steps of the operations were identical to those in Figure 2B. Similar results (data not shown) were obtained, which confirmed the severe suppression of the MS signal by the additives.
We also tried to deposit the CIEF-separated proteins directly to the target plate. This experiment failed because we could not deposit the solution to the target plate owing to the solvent evaporation when the solution moved out of at the capillary tip.
Since a MALDI matrix solution was utilized to facilitate the protein ionization, the question arose if it was possible to use this solution to replace the water on the target plate. According to the experimental results (data not shown) the matrix solution exacerbated the signal suppression effect.
The detailed mechanism of how the water droplet reduces the signal-suppression effect has not been systematically investigated. Presumably, the water droplet might have facilitated a “separation” of the additives from the proteins. According to the literature [27, 28] the diffusion coefficient of a molecular is proportionally to the square root [27] or the cubic root of its weight [28]. Since the molecular weights of Pharmalytes and CHAPS are close to or less than 600 Da while those of the proteins used in this experiment are from 14 to 20 kDa, the diffusion coefficient of a protein is 2~6-fold smaller than that of an additive. As the mixture of additives and proteins was introduced to the middle of the water droplet, small additives diffused rapidly outwards while large proteins stayed where they were (diffused slowly). As the solvent was evaporated, the additives and proteins were somehow “separated”.
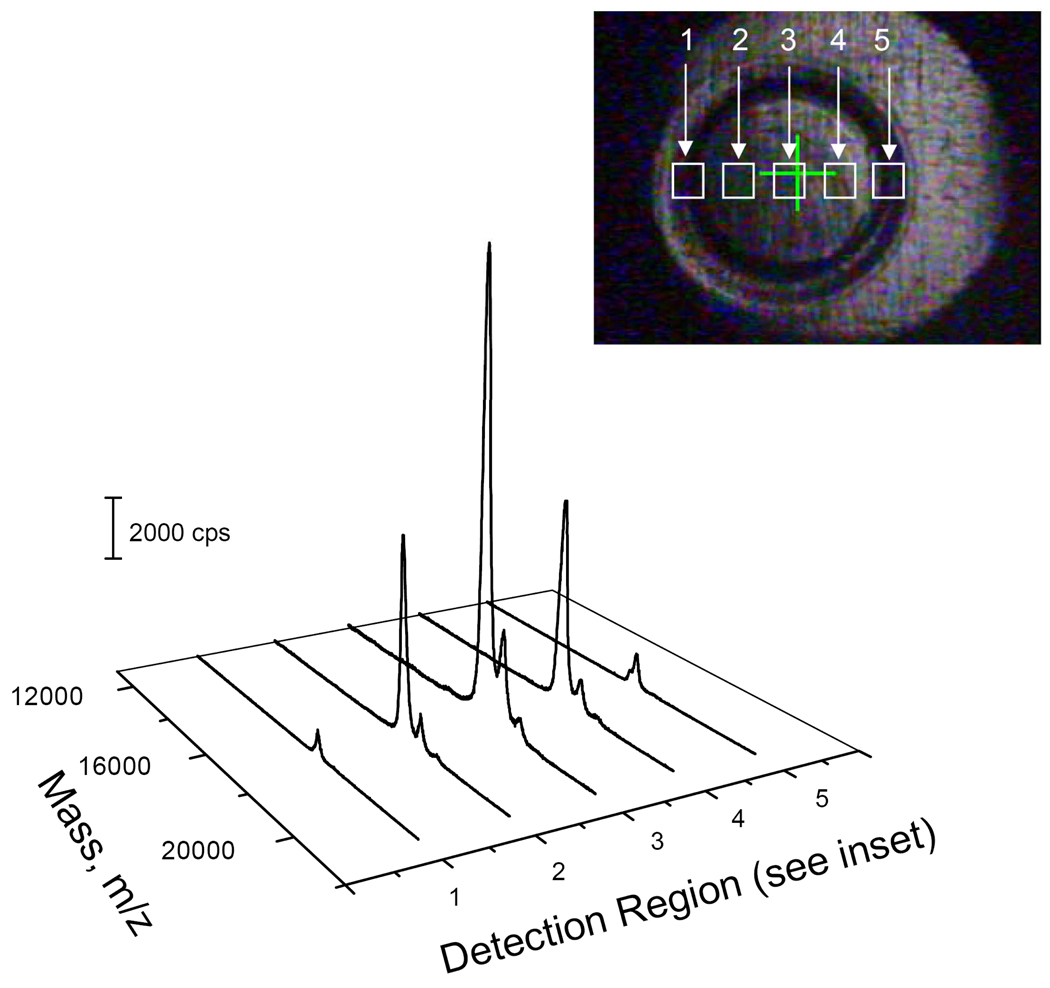
After a dry sample spot was produced on the target plate, we focused the laser in different regions of the sample spot (see the inset in Figure 3) and measured the MS spectra. Figure 3 presents the results as the laser was moved from one side the sample spot to the other. The highest S/N was obtained from the center region, which supported our hypothesis that most of the proteins remained in this region while the additives diffused to the edge.
Figure 3. Effect of detection region on MS signal.
The MS spectra were obtained by moving the detection region from the left side to the right side of the sample spot (see inset). The sample contained 0.05 µg/µL horse myoglobin, 0.9% Pharmalyte, 2% CHAPS and 0.5 mM ammonia acetate. The sample was loaded into a cross-linked polyacryamide coated capillary (60 cm long × 150 µm i.d. × 375 µm o.d.) with a CA membrane grounding interface. A high voltage (20 kV) was applied across the capillary for 20 minutes to focus the protein. The focused protein was hydraudynamically mobilized by raising the anolyte reservoir by 2 cm. The sample exiting the capillary was delivered to 1 µL of water pre-deposited on the MALDI target plate. After 30 seconds (~0.1 µL sample collection), the sample was delivered to another water droplet. This operation was repeated until all the sample was mobilized out of the capillary. The sample was dried, and 0.5 µL of the matrix solution was added to the sample spot. After the matrix solvent was evaporated, the target plate was transferred to Applied Biosystems 4800 Proteomics Analyzer for mass spectra measurements.
In the above test, the MS signal was likely affected by two parameters – the degree of the Pharmalyte and CHAPS being separated from the protein and the dilution of the protein. For example, if a large water droplet was used, it should facilitate the protein-additive separation (to enhance the MS signal), but it should also dilute/spread the proteins (to reduce the MS signal). How will the water droplet size affect the MS signal? Figure 4 presents the MS signal as a function of water droplet size. The signal increased with the droplet size as it changed from 0.5 µL to 1.2 µL, and then decreased from 1.2 µL to 2.0 µL. Overfilling was also observed when the droplet size was larger than 1.2 µL. In this experiment, we selected 1.0 µL droplet size throughout this work.
Figure 4. Optimization of water droplet size.
The volume of the water droplet pre-deposited on the MALDI target plate changed from 0.5 µL to 2.0 µL. The sample contained 0.05 µg/µL horse myoglobin, 0.9% Pharmalyte, 2% CHAPS and 0.5 mM ammonia acetate. ~0.1 µL of the sample was delivered to the water droplet. All other conditions were the same as in Figures 2A and 2C. The error bars were obtained by repeating the same tests for three times, from CIEF separation to MS measurement.
To invalidate the above mechanism hypothesis, we deliberately mixed the droplet solutions after aliquots of a CIEF-separated protein sample were delivered to them. The MS signal-suppression data were comparable to those in Figure 2B. Although these results cannot validate our hypothesis, they suggest that the differential diffusion could be one of the mechanisms which had contributed to the de-suppression of the MS signal. A systematic investigation of the mechanism is in progress in our lab, and the results will be reported elsewhere.
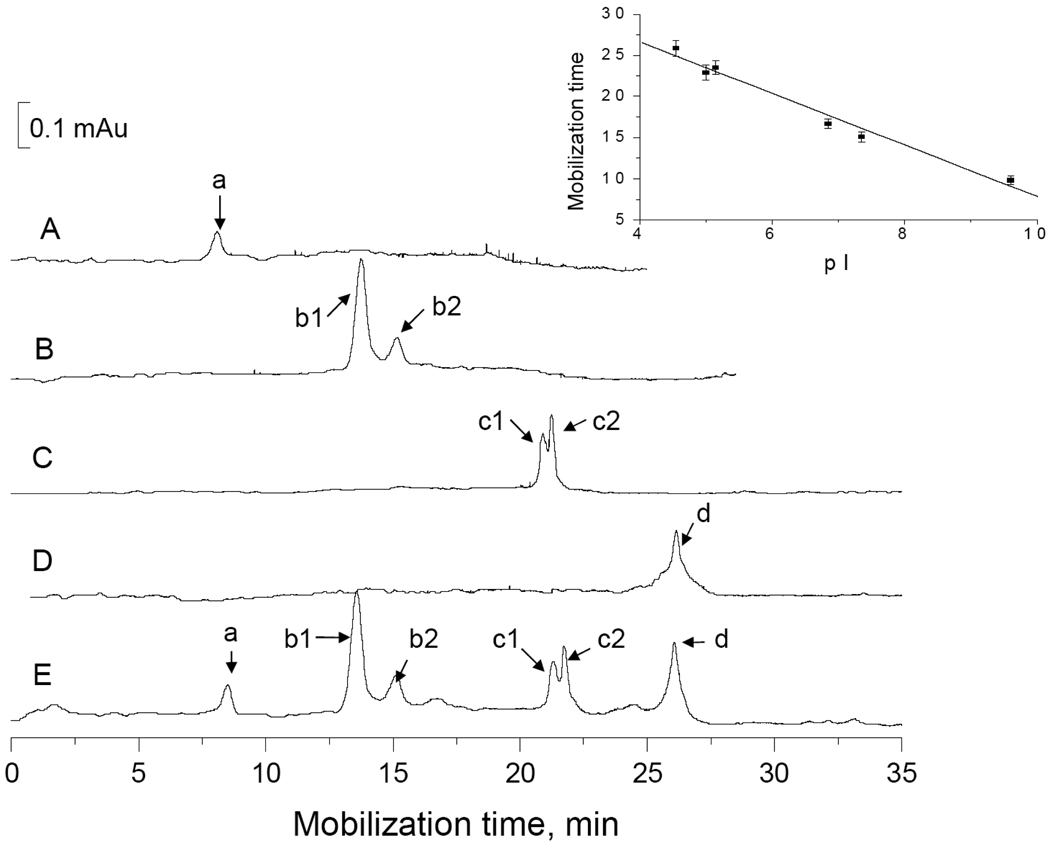
In this work, we employed a 60 cm long and 150 µm i.d. (versus commonly 50 µm i.d.) capillary to perform the CIEF separation, because we could load more proteins inside the capillary to facilitate the following MALDI-MS detection. We also selected a group of standard proteins (ribonuclease A, pI 9.60; myoglobin, pI 7.35 and 6.85; β-lactoglobulin A and B, pI 5.15 and 5.30; and soybean trypsin inhibitor, pI 4.55) as our pI marker to cover a broad pI range. Figure 5 presents the traces of CIEF separations of these proteins. The protein positions correlate well with their pI values, evidenced by a good linear relationship (R2 = 0.975, see the inset) between mobilization time and protein pI.
Figure 5. CIEF and mobilization of standard proteins.
The CIEF separations were performed in a cross-linked polyacrylamide coated capillary (60 cm long × 150 µm i.d. × 375 µm o.d.) with a focusing medium containing 0.9% Pharmalyte, 2% CHAPS and 0.5 mM ammonia acetate. The mobilized proteins were monitored using an absorbance detector at 280 nm. Traces A–D were obtained from individual proteins, and trace E was obtained from a mixture of all these proteins. The inset shows the linear relationship between mobilization time and pI value.
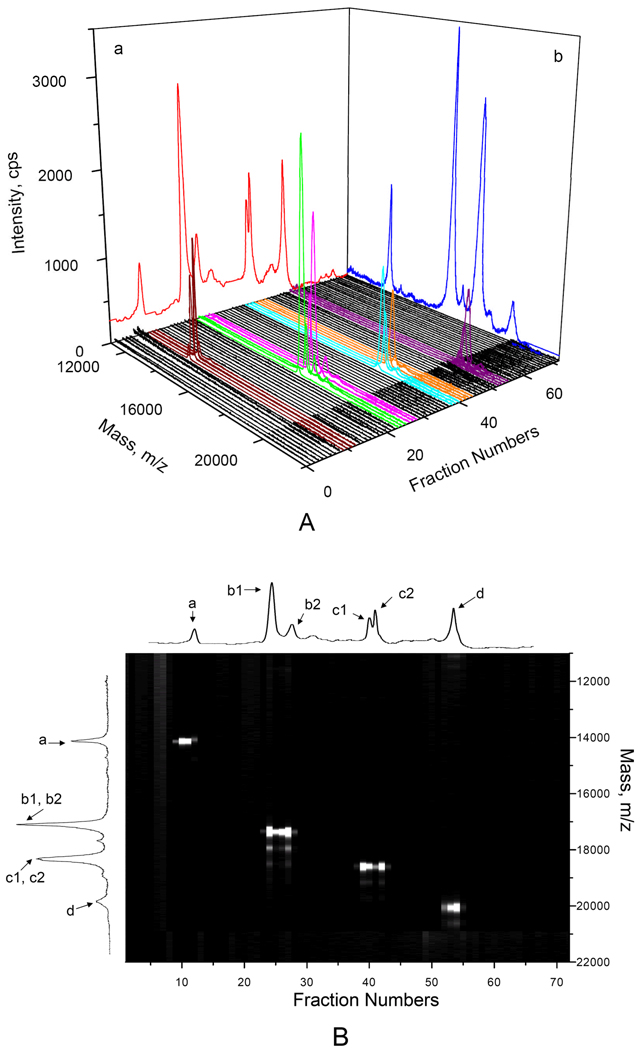
To demonstrate the fractionation of CIEF-separated proteins for MALDI-MS detection, we used the same four proteins as a model sample. After CIEF, the separated proteins were fractionated and deposited onto a MALDI target plate and MS spectrum of each fraction was measured, following the procedure as described in the experimental section. All spectra were reconstructed into Figure 6A, representing a 2-dimensional (2-D, CIEF and MALDI-MS) separation in a 3-dimension format. In addition, we added the CIEF trace (with UV detection) on plane a and MALDI-TOF-MS spectrum of the same mixture on plane b in Figure 6A to assist the identification of all peaks from the 2-D separation. Figure 6B is another representation of the same set of data, from which we can see the 2-D separation peaks more clearly.
Figure 6. Two-dimensional (CIEF-MALDI-MS) separation of standard proteins.
The sample contained 0.05 µg/µL ribonuclease A (peak a), 0.0065 µg/µL horse myoglobin (peaks b1 and b2), 0.003 µg/µL β-lactoglobulin B & A (peaks c1 and c2) and 0.05 µg/µL soybean trypsin inhibitor (peak d). The CIEF separation results with UV absorbance detection (the trace in plane a of Figure 6A and the trace at the very top of Figure 6B) was obtained following the procedure as described in Figure 5. The MS spectrum of the standard protein mixture (the trace in plane b of Figure 6A and the trace on the left side of Figure 6B) was obtained using proteins without additives. All other spectra were obtained following the procedure as described in Figure 3, with detection at the central region. Figure 6A presents the CIEF-MALDI-MS data in a 3-dimensional format, while Figure 6B represents the identical set of data as a 2-dimensional image.
In this experiment, we used a collection time of 30 seconds for each fraction. Based on the results shown in Figure 6B, 90% of the CIEF resolutions were retained. Obviously, when the CIEF resolution is high and the proteins have very close pI values, one should reduce the collection time to retain the CIEF resolution. In doing so, one should always keep in mind that adequate protein(s) are deposited in the sample spot for MALDI-MS detection.
To test the limit of detection (LOD) of this method, we performed the same tests using more dilute standards, and obtained these LODs (S/N=3): ribonuclease A – 7.7 pmol, myoglobin horse – 0.82 pmol, and β-lactoglobulin A & B – 0.35 pmol. These numbers are several times higher than those of MALDI-MS analysis of pure proteins.
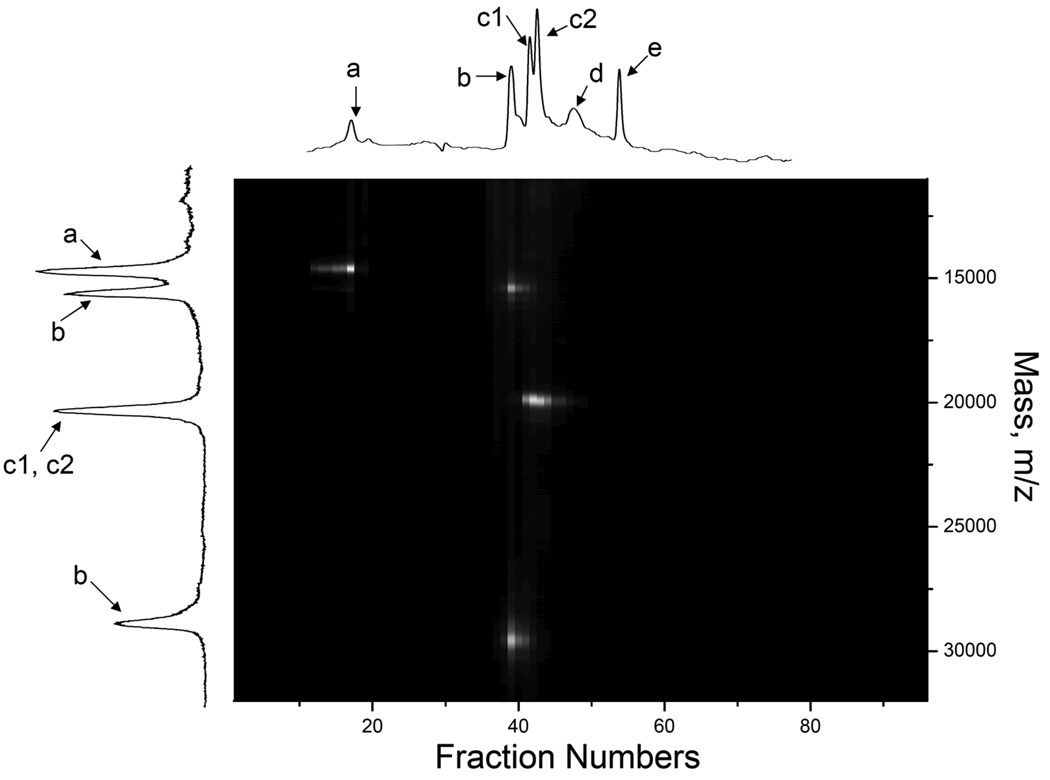
The practical application potential of this 2-D separation approach was demonstrated by analysis of apoA-I, a multifunctional exchangeable apolipoprotein whose plasma concentration is inversely correlated with the incidence of cardiovascular disease [24]. ApoA-I consists of 243-amino acids and has a molecular weight of 28.0 kDa. Figure 7 shows the 2-D separation of apoA-I mixed with ribonuclease A and β-lactoglobulin A & B. From fractions 40–41, we observed two mass peaks, one at ~28.0 kDa and the other at ~14.0 kDa. The latter was from the double charged apoA-I. Although apoA-I and β-lactoglobulin B were not well separated in the CIEF, and the double charged apoA-1 and ribonuclease A were not well separated in the MALDI-MS, these proteins were well separated in the 2-D separations.
Figure 7. Two-dimensional (CIEF-MALDI-MS) separation of apoA-I.
The sample consisted of 0.05 µg/µL ribonuclease A (peak a), 0.124 µg/µL apoA-I (peak b), and 0.025 µg/µL β-lactoglobulin B & A (peak c1 and c2). Peaks d and e were from small molecule impurities. All other conditions were the same as described in Figure 6B.
4 Concluding remarks
In this paper, we have combined CIEF and MALDI-TOF-MS for 2-dimensional separations of proteins. We have reconfirmed that Pharmalyte and CHAPS from CIEF severely suppress the MALDI-TOF-MS signal, and developed a simple but effective means to alleviate this effect. We have also demonstrated the potential of this method for practical protein analysis.
Acknowledgments
We like to acknowledge the financial support from the National Institutes of Health through grant number RO1 GM078592.
References
- 1.Hjerten S, Zhu MD. J. Chromatogr. 1985;346:265–270. [Google Scholar]
- 2.Yao XW, Regnier FE. J. Chromatogr. A. 1993;632:185–193. doi: 10.1016/0021-9673(93)80043-8. [DOI] [PubMed] [Google Scholar]
- 3.Chen SM, Wiktorowicz JE. Anal. Biochem. 1992;206:84–90. doi: 10.1016/s0003-2697(05)80014-4. [DOI] [PubMed] [Google Scholar]
- 4.Mazzeo JR, Krull IS. J. Chromatogr. A. 1992;606:291–296. [Google Scholar]
- 5.Zhu MD, Rodriguez R, Wehr T. J. Chromatogr. A. 1991;559:479–488. [Google Scholar]
- 6.Wu JQ, Tragas C, Watson A, Pawliszyn J. Anal. Chim. Acta. 1999;383:67–78. [Google Scholar]
- 7.Wu XZ, Huang T, Liu Z, Pawliszyn J. TrAC, Trends Anal. Chem. 2005;24:369–382. [Google Scholar]
- 8.Liu CL, Wu QY, Harms AC, Smith RD. Anal. Chem. 1996;68:3295–3299. doi: 10.1021/ac960286j. [DOI] [PubMed] [Google Scholar]
- 9.Muller O, Foret F, Karger BL. Anal. Chem. 1995;67:2974–2980. doi: 10.1021/ac00113a036. [DOI] [PubMed] [Google Scholar]
- 10.Shen YF, Xiang F, Veenstra TD, Fung EN, Smith RD. Anal. Chem. 1999;71:5348–5353. doi: 10.1021/ac9909305. [DOI] [PubMed] [Google Scholar]
- 11.Tang Q, Harrata AK, Lee CS. Anal. Chem. 1996;68:2482–2487. doi: 10.1021/ac960169o. [DOI] [PubMed] [Google Scholar]
- 12.Tang Q, Harrata AK, Lee CS. Anal. Chem. 1995;67:3515–3519. [Google Scholar]
- 13.Paša-Tolić L, Jensen PK, Anderson GA, Lipton MS, et al. J. Am. Chem. Soc. 1999;121:7949–7950. [Google Scholar]
- 14.Martinovic S, Pasa-Tolic L, Masselon C, Jensen PK, et al. Electrophoresis. 2000;21:2368–2375. doi: 10.1002/1522-2683(20000701)21:12<2368::AID-ELPS2368>3.0.CO;2-F. [DOI] [PubMed] [Google Scholar]
- 15.Tang Q, Harrata AK, Lee CS. Anal. Chem. 1997;69:3177–3182. doi: 10.1021/ac970015o. [DOI] [PubMed] [Google Scholar]
- 16.Jensen PK, Pasa-Tolic L, Peden KK, Martinovic S, et al. Electrophoresis. 2000;21:1372–1380. doi: 10.1002/(SICI)1522-2683(20000401)21:7<1372::AID-ELPS1372>3.0.CO;2-Y. [DOI] [PubMed] [Google Scholar]
- 17.Tanaka K, Waki H, Ido Y, Akita S, et al. Rapid Commun. Mass Spectrom. 1988;2:151–153. [Google Scholar]
- 18.Karas M, Hillenkamp F. Anal. Chem. 1988;60:2299–2301. doi: 10.1021/ac00171a028. [DOI] [PubMed] [Google Scholar]
- 19.de Hoffmann E, Stroobant V. Mass spectrometry : principles and applications. Chichester, West Sussex, England ; Hoboken, NJ: J. Wiley; 2007. [Google Scholar]
- 20.Foret F, Müller O, Thorne J, Götzinger W, Karger BL. J. Chromatogr. A. 1995;716:157–166. doi: 10.1016/0021-9673(95)00621-s. [DOI] [PubMed] [Google Scholar]
- 21.Silvertand LHH, Torano JS, de Jong GJ, van Bennekom WP. Electrophoresis. 2009;30:1828–1835. doi: 10.1002/elps.200800740. [DOI] [PubMed] [Google Scholar]
- 22.Yu WJ, Li Y, Deng CH, Zhang XM. Electrophoresis. 2006;27:2100–2110. doi: 10.1002/elps.200500820. [DOI] [PubMed] [Google Scholar]
- 23.Gao L, Liu SL. Anal. Chem. 2004;76:7179–7186. doi: 10.1021/ac049353x. [DOI] [PubMed] [Google Scholar]
- 24.Ryan RO, Forte TM, Oda MN. Protein Expression Purif. 2003;27:98–103. doi: 10.1016/s1046-5928(02)00568-5. [DOI] [PubMed] [Google Scholar]
- 25.Whang CW, Chen IC. Anal. Chem. 1992;64:2461–2464. doi: 10.1021/ac00044a029. [DOI] [PubMed] [Google Scholar]
- 26.Wang J, Ma M, Chen R, Li L. Anal. Chem. 2008;80:6168–6177. doi: 10.1021/ac800382t. [DOI] [PMC free article] [PubMed] [Google Scholar]
- 27.Vrentas JS, Chu C-H. J. Polym. Sci., Part B: Polym. Phys. 1989;27:465–468. [Google Scholar]
- 28.He L, Niemeyer B. Biotechnol. Progr. 2003;19:544–548. doi: 10.1021/bp0256059. [DOI] [PubMed] [Google Scholar]


