


Abstract
Uracil (U) can be found in DNA as a mismatch paired either to adenine (A) or to guanine (G). Removal of U from DNA is performed by a class of enzymes known as uracil–DNA–glycosylases (UDG). Recent studies suggest that recognition of U–A and U–G mismatches by UDG takes place via an extra-helical mechanism. In this work, we use molecular dynamics simulations to analyze the structure, dynamics and open base pair kinetics of U–A base pairs relative to their natural T–A counterpart in 12 dodecamers. Our results show that the presence of U does not alter the local conformation of B-DNA. Breathing dynamics and base pair closing kinetics are only weakly dependent on the presence of U versus T, with open T–A and U–A pairs lifetimes in the nanosecond timescale. Additionally, we observed spontaneous base flipping in U–A pairs. We analyze the structure and dynamics for this event and compare the results to available crystallographic data of open base pair conformations. Our results are in agreement with both structural and kinetic data derived from NMR imino proton exchange measurements, providing the first detailed description at the molecular level of elusive events such as spontaneous base pair opening and flipping in mismatched U–A sequences in DNA. Based on these results, we propose that base pair flipping can occur spontaneously at room temperature via a 3-step mechanism with an open base pair intermediate. Implications for the molecular basis of U recognition by UDG are discussed.
INTRODUCTION
Uracil (U) is not contained in DNA as a natural base, but it can be found as one of its most common lesions (1), paired either to guanine (G) or to adenine (A) (2,3). While U–G mismatches are generated by enzymatic and non-enzymatic deamination of cytosine (C), U–A mismatches derive from misincorporation of deoxyuridine-monophosphate (dUMP) during replication (4). U–A pairs represent the vast majority of U lesions in the mammalian genome (5). Contrary to U–G mismatches, U–A pairs are non-mutagenic. Indeed, replication of U–A results in a T–A pair and in another U–A pair. The cytotoxicity of U–A pairs stems directly from the repair process. It has been shown that increased levels of dUMP are linked to DNA fragmentation due to repeated repair cycles (6–8).
Removal of U from DNA is carried out by a class of enzymes known as uracil–DNA–glycosylases (UDG) (3,9). UDGs excise the glycosylic bond between the pyrimidine and the deoxyribose of U, leaving an abasic (apyrimidinic, AP) site (9,10). The elucidation of the many steps involved in DNA lesions recognition and repair remains a challenge. Nonetheless, over the last few years significant progress has been made towards the clarification of UDG catalysis. Particularly important is the discovery that UDGs are able to scan DNA for lesions by hopping on and sliding along short stretches of the double helix in search for uracil (11–13). After lesion recognition, the first step in the UDG-repair process involves the extraction of the damaged base from the double helix into the enzyme-active site, where the glycosylic bond is cleaved (9,10,12,14–18). Crystal structures of DNA/UDG complexes suggest that the base extraction process is facilitated by intercalating residues [e.g. Leu 272 in human UDG (UNG) (3)], which protrude into the DNA-minor groove, pushing the base into the enzyme-active site stabilizing the rest of the bases via stacking interactions (3,16,19,20). While complete base extraction from the DNA double helix (i.e. base flipping) seems to require the action of repair enzymes, partial base opening or base pair breathing, is known to be a natural occurrence in DNA dynamics and is probably triggered by thermal fluctuations (21–23). Recent studies have shown that UDG slides along short stretches of DNA, locating U while it is in an extra-helical position (12,18,24). It has been estimated that during the 1D-DNA sliding, UDG is able to sample about four opening events per base pair (12). NMR data showed that the lifetime of extra-helical T is enhanced by the presence of UDG, whereas UDG does not affect the T–A base pair opening rate relative to free DNA (24,25). If, as it seems, UDG interrogates base pairs while in an open, non-Watson–Crick conformation, then the characterization of the structure and dynamics of naturally occurring base pair opening events is a fundamental step towards understanding the DNA-damage recognition mechanism.
Structural details of DNA-breathing events are rather difficult to obtain experimentally due to their transient nature. Nevertheless, base pair opening kinetics has been studied extensively by means of NMR imino proton exchange experiments (22,23,26–31). These studies have shed some light on the base pair opening timescales as a function of sequence and strand length. An interesting set of data suggests that methylation of C5 of pyrimidine bases (e.g. as found in T but not in U or C) dampens base pair opening kinetics (22,23). For example, base pair opening kinetics in A-tracts is shown to be much slower than in G-tracts (23), which implies that Watson–Crick base pairing has a longer lifetime in T–A relative to G–C. Watson–Crick base pair lifetimes are in the order of milliseconds (ms), while open base pair lifetimes are in the order of nanoseconds (ns) (28,31). These data indicate that while base pair opening kinetics is accessible to experimental timescales, closing kinetics can be estimated either indirectly by extrapolation from experimental data, or directly by molecular simulation techniques.
Computational techniques have proven to be a valuable tool in the elucidation of elusive processes in DNA recognition and repair (28,32–42). In this work, our goal is to uncover structural and/or dynamical characteristics that might differentiate T–A from U–A base pairs as the molecular basis of U recognition in DNA. To this end, we used molecular dynamics (MD) simulations to study how the presence of U relative to T in the DNA double helix affects the local structure, dynamics, and open base pair kinetics in 12 DNA dodecamers. While six of those dodecamers have only natural bases and contain four central T–A (A–T) base pairs in different combinations, the other six have corresponding sequences but with one of the T replaced by a U (Table 1). We focused our attention on the four central base pairs of each dodecamer, which contain only A, T or U. The first and last four base pairs (CGCG) are identical for all 12 sequences.
Table 1.
The DNA sequences studied in this work are shown below in 5′→3′ direction
 |
|---|
Our results show that the replacement of T with U in T–A pairs does not affect the base pair structure significantly, making U virtually indistinguishable from T when in a Watson–Crick conformation. This suggests that mismatches are not likely to be recognized while in a closed conformation within the helical stacking. The analysis of the open U–A and T–A pairs kinetics shows that both pairs close in the low nanosecond timescale. This timescale is in agreement with values derived from NMR imino exchange data (28,31). Finally, we describe in detail spontaneous base pair opening and flipping events in U–A pairs. We also compare the structure of our DNA with an extra-helical U to the structure of a DNA fragment with an extrahelical thymine-analog that was co-crystallized with human UDG (UNG2) (18). Based on these results, we propose a 3-step opening mechanism where extra-helical bases are produced spontaneously at room temperature via an open base pair intermediate.
This work provides for the first time a detailed description of the structural and kinetic features of elusive events such as base pair opening and flipping and supports that U recognition by UDG occurs via an extra-helical mechanism.
MATERIALS AND METHODS
The 12 dodecamers studied in this work are shown in Table 1. Initial structures were built using the ‘make_na server’ web tool (http://structure.usc.edu/make-na/server.html). The six sequences containing U were derived from the corresponding natural sequences by manually substituting the methyl group on the thymine (T) with hydrogen. MD simulations were performed with AMBER param99 force field (43,44) for nucleic acids, in TIP3P water (45). Parameters for the U base were taken from the parameters for U in RNA, while the deoxyribose parameters were taken from the T deoxyribose. Charges for the U nucleotide were adjusted to reach neutrality (Supplementary Table S1). Each sequence was centered in a cubic TIP3P water box of 65 Å side. A total of 36 Na+ and 14 Cl− ions were added to neutralize the system and reach an ion concentration of ∼0.3 M (46). The ionic atmosphere was created with the program ‘genion’ included in the GROMACS software package (47,48). Such a high-ionic concentration was chosen to increase the chance of observing binding events of Na+ in the grooves and examine the possibility of preferential binding of native versus damaged sequences. MD simulations were run in the NPT ensemble. Temperature control was achieved via a Langevin thermostat with 300 K as reference temperature and 0.1 ps as inverse friction constant. Pressure was held constant at 1 bar via exponential pressure coupling with a time-constant of 1 ps. Long-range electrostatics were treated with the Particle Mesh Ewald (PME) algorithm (49). Maximum grid spacing for the fast Fourier transform (FFT) was set to 1Å and the Coulomb cutoff was set to 10Å. The Lennard–Jones (LJ) potential cutoff was set at a distance of 9Å. Water box and ions were equilibrated for 1 ns while restraining the DNA internal degrees of freedom. The whole system was then equilibrated without restraints for 10 ns and data were collected along 100 ns trajectories for a total simulation time of 110 ns for each one of the 12 sequences. In a separate set of simulations, base pair opening was induced by imposing a distance harmonic restraint with force constant k = 5000 kJ·mol−1·nm−2 and r0 = 2.90Å between O2 of thymine (or uracil) and NH2 of adenine (Figure 1a and b). A similar reaction pathway was chosen in an earlier work to generate base pair opening events consistent with NMR imino proton exchange data (50). All sequences were equilibrated with restrained open U–A and corresponding T–A base pairs for 5 ns. The strength of the restraint was then lowered from k = 5000 kJ·mol−1·nm−2 to 1000 kJ·mol−1·nm−2 for 10 ns. During this trajectory 50 snapshots were collected every 200 ps. Unrestrained MD simulations were run for each one of the 50 snapshots until base pair closing, for a total simulation time of ∼5.5 µs. We defined base pairs as closed when the distance between O2 of thymine (or uracil) and NH2 of adenine (Figure 1a) was >4.5Å. In each case, closed structures were visually inspected to ensure that the correct base pairing took place. Decay curves were calculated based on the closing times collected. MD simulations were run with versions 3.3.3 up to 4.0.4 of the GROMACS software package (47,48).
Figure 1.

A T–A base pair in Watson–Crick conformation is shown with green C atoms in panel (a), and a U–A base pair in an open conformation is shown with orange C atoms in panel (b). The open conformation is held together by one hydrogen bond between the O2 of U and the the NH2 of A. Schematic of the proposed 3-steps spontaneous base flipping mechanism is shown in panel (c).
Structural parameters were determined with the 3DNA software package (51,52). The pymol (www.pymol.org) software package was used to generate figures.
RESULTS AND DISCUSSION
Groove widths and Na+ binding
Minor and major grooves widths, defined according to (51–53), were monitored during 100 ns trajectories. Average values calculated >100 ns are shown in Table 2, while averages collected at 20 ns intervals are shown in Supplementary Table S2. All data refer to the central four nucleotides, unless specified otherwise. X-ray crystallographic data have shown that the minor groove in AT-rich sequences is narrower than in GC-rich ones (54–56), indicating that sequence plays a major role in the helix structure. Previous studies have also highlighted a characteristic narrow minor groove in AT-rich tracts (40,57). The results shown in Table 2 indicate that the minor groove width is not greatly affected by the presence of U relative to T. AATT and AAUT, for which the minor grooves differ by only 0.1Å, are the narrowest amongst the 12 sequences. The largest difference in minor groove width, 0.7Å, is found between TAAT and TAAU (Tables 2, 3 and Supplementary Table S2). This difference is not actually due to intrinsic structural or dynamic behavior, but to Na+ binding. It has been shown that monovalent cations reside mostly in the minor groove floor (58) in sequence-dependent patterns (57,59,60). We observed that a single Na+ ion binds the centre of the TAAU minor groove, between the last two base pairs in ApU (Figure 2). The average Na+ occupancy in this particular site is above 90% during the first 60 ns of the simulation (Table 3), with residence times ranging from 100 ps up to 20 ns. Indeed, one specific ion remained continuously bound in this location for over 20 ns. Long-residence times between 10 ns and 100 µs for Na+ in A-tracts have also been determined experimentally (61). Previous computational studies highlighted the occurrence of anomalous KCl aggregates in the vicinity of biomolecular systems during MD simulations with the AMBER parameter set (62) at ion concentrations >0.25 M (63). We ran all our simulations in 0.3 M NaCl with the same AMBER parameter set. No salt clustering or anomalous aggregates were found.
Table 2.
Average values of minor and major grooves widths calculated for each dodecamer over 100 ns MD trajectories
| Sequence | Minor groove |
Major Groove |
||||
|---|---|---|---|---|---|---|
| Average (Å) | SD | Abs. Dev. | Average (Å) | SD | Abs. Dev. | |
| AATT | 5.9 | 1.2 | 0.1 | 13.3 | 1.7 | 0.2 |
| AAUT | 6.0 | 1.5 | 13.1 | 1.9 | ||
| ATAT | 7.0 | 1.9 | 0.2 | 13.8 | 1.8 | 0.4 |
| AUAT | 6.8 | 1.5 | 13.4 | 1.6 | ||
| ATTA | 6.9 | 1.5 | 0.5 | 13.2 | 2.0 | 0.6 |
| ATUA | 6.4 | 1.7 | 13.8 | 1.9 | ||
| TAAT | 6.9 | 1.4 | 0.7 | 13.4 | 2.0 | 0.7 |
| TAAU | 6.2 | 1.4 | 14.1 | 1.8 | ||
| TATA | 7.2 | 1.4 | 0.1 | 13.4 | 2.0 | 0.1 |
| TAUA | 7.1 | 2.4 | 13.5 | 1.8 | ||
| TTAA | 7.4 | 1.3 | 0.4 | 13.1 | 1.6 | 0.4 |
| UTAA | 7.0 | 1.6 | 13.5 | 2.2 | ||
Standard deviations (SD) are also indicated together with the absolute deviations (Abs. Dev.) between values corresponding to natural and lesioned sequences. For each sequence, only the central four bases in the 5′→3′ direction have been shown for clarity. All values are in Angstrom.
Table 3.
Minor groove widths and relative Na+ occupancy (percentage of Na+) at the level of the uracil (thymine) base
 |
|---|
TAUA groove widths values for TAAU are highlighted to show dependence on Na+ binding. All widths are in Angstrom and the Na+ occupancy is normalized to the number of MD snapshots selected for the calculation (i.e. 2000).
Figure 2.

Na+ bound in the TAAU minor groove. Only the two base pairs involved in the ion binding are shown. Adenine (A) 7 and thymine (T) 18 are shown with green C atoms, while uracil (U) 8 and A17 are shown with blue C atoms. Na+ is coordinated to the O of U8 and T18.
Na+-binding stability in the TAAU minor groove might come from its coordination between stacked base pairs. In TAAU, Na+ interacts directly with O of U8 and T18 (Figure 2). In agreement with previous work (64,65), this study supports that ion binding, and thus the electrostatic environment, influences the dimensions of the minor groove. In TAAU, the width of the minor groove at the ApU level varies between 4.4 and 4.9Å, during the time when Na+ occupancy in the groove floor is ∼90%, but rises to 5.7Å following Na+ unbinding (Table 3). Although sequence-dependent, counter-ion binding patterns do not appear to be particularly affected by the presence of U relative to T. In all other sequences, Na+ binding is a frequent but transitory event, with average residence times in the order of 100 ps to a few ns. Despite the high-salt concentration used in the simulations, in all these cases occupancy rates are generally <30%. The average local width of the minor groove in ApU sites (other than in TAAU) is between 5.3 and 7.3Å (Table 3). The narrowing of the TAAU minor groove is reflected in the corresponding widening of the major groove. Results in Table 2 show that like the minor groove, the major groove width is unaffected by the replacement of T with U.
Base pair structure and dynamics
In order to compare the structure and dynamics of U–A and T–A base pairs, selected helical and step base pair parameters were monitored throughout the 100 ns trajectories. Twelve different helical parameters can be used to describe different structural motifs in nucleic acids (51,52). Based on these parameters’ values, the B form of DNA, the most stable conformation in the cell environment, can be differentiated from other DNA conformers, such as A-DNA and Z-DNA (66). We chose to focus our attention on parameters that highlight the weakening of base pairing, and therefore the propensity for spontaneous opening of U–A versus T–A. These parameters are: shear, stretch and opening (Figure 3). Additionally, in order to compare the local inclination of the helical axis at the lesion level, we also monitored tilt values (Figure 3). Shear and stretch are defined as the relative offset of the two base origins in the mean base pair plane, while the opening angle is defined as the angle between the two x-axes with respect to the average normal to the base pair plane (51). Positive opening values indicate opening towards the major groove, while negative values indicate opening towards the minor groove.
Figure 3.

Graphical representation of the four helical parameters monitored throughout the MD simulations. Each rectangle represents a base. The representation is adapted from (51,52). Shear and stretch parameters are measured in Angstrom (Å), while opening and tilt in degrees.
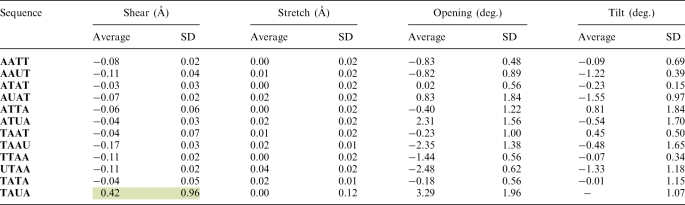
Average values of shear and stretch are within the standard values observed for B-DNA (51,67) for both T and U containing sequences. Average values of shear and stretch calculated >100 ns are shown in Table 4, while values calculated at 20 ns intervals are shown in Supplementary Tables S3 and S4. Average shear values for T–A and U–A pairs (excluding TAUA) are −0.06 and −0.10Å, respectively (Table 4). These values indicate a very small local displacement of the base pairs and no significant structural difference between T–A and U–A base pairing. However, significant differences in shear values can be seen during the first 20 ns of the MD simulation of TAUA (Supplementary Table S3). During this time, the U–A base pair underwent spontaneous opening, where the U–A base pair was held together by a single H-bond between NH2 of A and the O2 of U (Figure 1b). The corresponding shear value for U–A is 2.14 Å. Shear values ∼2 Å are characteristic of non-Watson–Crick pairing such as U–G wobble pairs found in RNA (51). As the U–A returned to the Watson–Crick conformation, the average shear value went back to standard B-DNA values, e.g. −0.01 Å.
Table 4.
Average values of base pair and helical parameters (shear, stretch, opening and tilt) calculated over 100 ns MD trajectories
 |
|---|
Highlighted values indicate deviations from the standard B-DNA conformation due to base pair opening. For each sequence, only the central four bases in the 5′→3′ direction have been shown for clarity. SDs are based on the average values.
The average stretch does not present any significant difference in the separation between T–A and U–A base pairs while in Watson–Crick conformation (Table 4). Stretch values increased as a function of base pair opening. During the first 20 ns of the TAUA simulation, the U–A stretch was 0.22 Å as compared to an average of 0.05 Å for the remainder of the simulation (Supplementary Table S4).
Although the opening parameter might seem an ideal indicator of base pair opening events, it appears to be less sensitive than the shear. Opening values for TAUA during the first 20 ns were indeed large and positive, i.e. 3.18 Å (Table 4 and Supplementary Table S5). However, large positive opening values are also seen for other sequences and for TAUA at times where no complete base pair opening was observed. Large positive opening values can also result from the transient elongation of one or two of the H-bonds between the A and T (or U). These events are part of DNA dynamics and do not necessarily develop into breaking of the Watson–Crick conformation. In addition, we observed large negative opening values for TAAU and UTAA (i.e. opening >−2.50Å, see Supplementary Table S5). These values indicate opening towards the minor groove and, in the case of TAAU and UTAA, correspond to Na+ binding events in the minor groove.
Finally, results listed in Table 4 show that sequences containing T–A have a consistently larger negative tilt compared to their U–A counterpart. However, these differences are rather small, i.e. in the range between 1° and 1.4°, and in most cases within 1 SD. The U–A base pair opening during the first 20 ns of the TAUA simulation does not induce significant changes from the average tilt value (Supplementary Table S6).
The helicoidal parameters analysis shows that replacement of T with U in T–A pairs does not affect significantly the base pair structure, making U virtually indistinguishable from T when in a Watson–Crick conformation. Based on these considerations, it is likely that mismatch recognition does not occur while base pairs are in a closed conformation. During the DNA-helix scan, repair enzymes may in principle either actively pull all bases out of the stacking to inspect them or capture bases while in an extra-helical position.
Together with the shear, the sugar–phosphate backbone torsions are indicative of base pair opening. Backbone dynamics is discussed in detail in the next section.
Structure of the U–A open conformation in the TAUA dodecamer
During the first 20 ns of MD simulation the U–A base pair in the TAUA dodecamer broke out of the Watson–Crick conformation and adopted an open conformation which persisted for 13.6 ns. The opening process involved the rapid breaking of both Watson–Crick hydrogen bonds (H-bonds) between U and A (Figure 1a) and the formation of a single H-bond between NH2 of A and O2 of U (Figure 1b). We describe base pair opening by monitoring the variation of a particular angle, defined by the atoms N9 of A, and N1 and O4 of U (Figure 4). This angle has an average value of 53.2° when U–A is in the Watson–Crick configuration and increases to an average of 85.2° in the open state. The opening event does not cause disruption of the DNA double helix either above or below the open base pair. The most significant conformational changes are at the base pair level and involve both the backbone and the bases of U and A. As shown in the previous section, certain base pair parameters, such as shear, are good indicators of deviations from the Watson–Crick pairing. From the analysis of the U–A dynamics it appears that the breaking of the H-bonds between bases is accompanied by a specific conformational change of two of the sugar–phosphate torsions. These two torsions, ε and ζ, are defined by the atoms C4′C3′O3′P and C3′O3′PO5′, respectively (Supplementary Figure S1). Figure 5 shows the variation of ε and ζ during opening. When the U–A pair is in the closed conformation, the ε/ζ torsions are in a trans/gauche− (t/g−) conformation, where t refers to angles between 140° and 220°, and g− to angles between 260° and 340°. The t/g− conformation of ε/ζ torsions defines what is known as the BI sub-state of canonical B-DNA (68–70). When U opens, the ε/ζ torsions undergo inversion from t/g− to g−/t, which corresponds to the BII sub-state, a higher energy conformer of canonical B-DNA (68–70). As seen in Figure 5, the ε/ζ torsions return to the t/g− conformation only briefly during the lifetime of the open state. This transition does not cause closing of the base. BI/BII transitions have been previously associated to de-stacking between adjacent base pairs (69,71). The inversion of the ε/ζ torsions from t/g− to a g−/t conformation happens when the base opening was purposely induced (e.g. by applying a distance restraint) and persisted for virtually the whole time that U–A remains in the open conformation (data not shown). Consistently with this finding, transitions in the ε and ζ dihedral angles were previously identified by principal component analysis (PCA) as one of the crucial modes involved in base pair opening (72).
Figure 4.

Variation of the opening angle for the U7A18 base pair during the first 20 ns of MD simulation of the TAUA dodecamer. The opening angle is defined by the atoms N9-N1-O4, as shown in the panel on the top-right corner. Arrows indicate the timeframe during which the base pair is, respectively, ‘closed’ or in the Watson–Crick configuration or ‘open’. Average opening angle in the ‘closed’ conformation is 53.2°, while in the ‘open’ conformation is 85.2°.
Figure 5.

Phosphate backbone torsions ε (a) and ζ (b) at the U of the TAUA sequence during the 20-ns MD simulation when the opening takes place. The change in configuration seems to happen as an immediate response to the base opening, which occurs at 3.62 ns. The U–A base pair returns to the Watson–Crick configuration after 13.62 ns. The time interval during which the U–A base pair is in the open conformation is highlighted in pink.
The conformation of α/γ torsions was also monitored. During the whole 100-ns trajectory, the U–A α/γ remain in the B-DNA standard g−/g+ conformation (39), where g+ refers to angle values between 20° and 100°. The average values of α and γ >100 ns are, respectively, −65° (±11°) and 54° (±11°), while the standard values for B-DNA are, respectively, −41° and 38°. Based on the 10 000 snapshots used to compute the α/γ values over 100 ns, no transitions for α/γ conformations (73) were observed.
U–A versus T–A open base pair kinetics
In agreement with previous studies (74–77), we have shown in the previous sections that the replacement of thymine (T) with uracil (U) does not significantly affect the overall structure of the B-DNA dodecamers.
The sequence dependence of base pair opening kinetics has been investigated extensively by means of NMR imino proton exchange (22,23,28,29). Some of these studies showed that C5-methylation alters base pair kinetics by dampening base pair opening dynamics (22,23). This effect has been interpreted as due to an increased stability of base pair stacking when a pyrimidine base is methylated in C5 (22,30). This rationale was used to explain why base pair opening kinetics is much faster in G-tracts than in A-tracts (22,23). The same effect was observed when replacing T by U in AT-rich sequences (22). The kinetic analysis of base pair opening is a difficult task to undertake computationally due to the fact that opening events occur in the millisecond timescale (22,23,30). The opening of the U-A base pair that we observed in TAUA is significant as a mechanistic example of how an opening event may occur, but it is hardly representative of the propensity of U–A pairs to open relative to T–A. Inversely, the kinetics of open base pairs is difficult to study experimentally because base pair closing takes place in the nano second timescale (28,31). However, this timescale is directly accessible to computational techniques.
We studied the kinetic decay of open base pairs, i.e. the closing kinetics or open base pairs kinetics, in our 12 sequences with the aim of identifying possible differences in the lifetime of U–A open base pairs relative to T–A pairs. NMR imino proton-exchange data show that both DNA sequence and strand length contribute to determine base pair opening kinetics (22). All our systems have the same strand length and are pair-wise identical except for one mismatch per strand (see Table 1), therefore our results reflect exclusively the effects of the replacement of T by U.
Base pair kinetics is usually interpreted in terms of imino proton-exchange theory (78). The latter is based on the assumption that proton exchange between the H-bond donor in the DNA base, e.g. N3 in U or T, and the proton acceptor in solution occurs only when the base pair is in an open configuration (Figure 1b). In order to ensure that the limiting step of the exchange process is indeed base pair opening and not proton transfer to the solution, ammonia is usually used as a catalyst instead of water.
Closing kinetics is well described by the equation:
| (1) |
where γ is the decay rate and XOpen is the mole fraction of open base pairs relative to Watson–Crick base pairs. Integration of Equation (1) gives:
| (2) |
base pair lifetime, τ0, is defined as the inverse of the decay rate (i.e. 1/γ)· In the logarithmic form of Equation (2), γ is given by the slope of the decay line.
Based on the structure and on the opening reaction pathway observed for the spontaneous opening of the U–A base pair in TAUA, we generated open T–A and corresponding U–A base pairs in all 12 dodecamers. Decay curves were obtained from data derived from 50 separate unconstrained MD trajectories for each dodecamer. Each MD simulation was extended until base pair closing, for a total simulation time of >5.5 µs. Results are shown in Table 5 and the open states decay lines are shown in Figure 6. We find that open base pair lifetimes at 300 K are in the low nanosecond timescale for both U–A and T–A pairs. This is in agreement with NMR studies of the kinetics of C–G pairs (28,31) and A–T pairs (28). Indeed, closing rates derived from NMR imino proton-exchange data at 35°C show that the apparent lifetime of an open C–G pair is 9 ± 3 ns (31). The agreement of our data measured at 300 K (or 27°C) with the open base pair lifetime values derived from NMR experiments at 35°C suggests that there is no significant temperature dependence of base pair closing rates at physiologically relevant temperatures.
Table 5.
Open states lifetimes τ0 (ns) calculated for natural DNA sequences relative to their damaged counterparts
 |
|---|
Shaded cells indicate the sequence with the highest lifetime. Errors, indicated in parenthesis, are based on the R2-values, shown in Figure 6.
Figure 6.

Decay kinetics of the open base pair states for all 12 dodecamers. The legend on the right indicates the symbols assigned to each sequence. Trend lines are shown as solid lines for all natural sequences and as dotted lines for sequences containing U. The relative R2-values are shown within brackets for each dodecamer.
Our results show only moderate sequence specificity of the closing rates. For natural DNA dodecamers, we find that the open T–A pair in the ATTA dodecamer has the shortest lifetime, while TATA has the longest, i.e. 5.7 and 11.7 ns, respectively (Table 5). For the six dodecamers-containing U the shortest lifetime (5.8 ns) is found for the AAUT sequence, while the longest open base pair lifetime (18.2 ns) is seen in the AUAT sequence (Table 5).
For four out of six sequences containing U–A, the lifetime of the open base pair-containing U is only slightly longer than in its natural counterpart. The largest difference in open states lifetimes (Δτ0) is observed between ATAT and AUAT, with Δτ0 = 8.5 ns longer for U–A than for T–A. AATT and AAUT have the smallest difference in open state lifetimes, where Δτ0 = 1.7 ns in favor of the T–A base pair. Such moderate differences in open-state lifetimes are within the timescale of local molecular motions and are unlikely to affect the recognition mechanism of repair enzymes, which operate in the millisecond timescale.
Base pair flipping from open U–A pair
This study is based on an opening-reaction coordinate which results in an open state held together by one single H-bond (shown in Figure 1b). Different reaction coordinates, such as opening angles (41), dihedral angles (28,32,42,79) and linear collective coordinates (72), have been used in the past to study the free energy of base pair opening and flipping in DNA and RNA, but not base pair opening or closing kinetics. Our kinetic study requires only the equilibration of open base pairs consistent with the structural features of the spontaneously opened U–A in the TAUA dodecamer. We chose the NH2-O2 distance because it is the structural parameter that captured this event most directly. The same coordinate was used in an early study of natural DNA sequences to generate open base pairs consistent with NMR data (50). Non-Watson–Crick open conformations such as the one we have been studying here were found to be local minima, with energy barriers dependent on the sequence (50,72). Base flipping beyond such open state has been difficult to characterize both computationally and experimentally. This is because the rupture of the single H-bond holding together the open state can in principle produce a multitude of different conformations with a flipped-out base (72). One interesting example of a DNA fragment with a flipped-out base is found in the structure of an UDG (UNG2) co-crystallized with a DNA fragment which carries an extra-helical base (18). The capture of a short-lived extra-helical state was facilitated by replacing the A paired to the extra-helical T by a 4-methyl-indole (18).
During the 5.5 µs of unconstrained MD performed collectively on the 12 dodecamers, we did observe that the breaking of the H-bond holding the open conformation can develop into a complete extra-helical (or flipped-out) base. Specifically, a complete base flipping event occurred in the AUAT dodecamer. From a flipped-out state, the U–A base pair eventually returned directly into the Watson–Crick conformation. Partial base flipping triggered by the breaking of the single H bond holding the open state was also observed in the TAUA and TAAU dodecamers. In the latter systems, the flipped-out state held only for a few hundred ps before returning to the open state. In contrast, no spontaneous base flipping was observed for T–A base pairs.
Due to the highly dynamic nature of extra-helical bases, base pair parameters are not very descriptive in characterizing flipping events. We found that base pair opening and flipping is best captured by dON, the distance between the O2 of U and NH2 of A (Figure 7) and by the variation of the ε/ζ torsions at the base pair level. Snapshots from the MD simulation are shown on the top panel for clarity. Base flipping started from the open U–A conformation, shown in the top-left panel of Figure 7. This conformation persisted unaltered for ∼1 ns. During this interval, the average dON = 3.0 ± 0.2Å, where the error is calculated as standard deviation. As the single H-bond-holding U–A in the open conformation breaks, U evolved into a complete extra-helical state, instead of going back to a closed pair. Based on the dON values, we can identify four stages in the flipping process. The first stage begins at 1 ns and persists until 5.2 ns. During this time, the average dON = 8.4 ± 1.4Å and the base plane rotated to become almost parallel to the helical axis. This orientation lasted until base closing. During the second phase, i.e. from 5.2 to 9.3 ns, U reached the maximum extra-helical extension, with an average dON = 12.0 ± 1.5Å. During the third phase, between 9.3 and 12.1 ns, U returned closer to A with an average dON = 9.8 ± 1.3Å. Finally, the base gradually rotated back into a conformation where the base plane is perpendicular to the helical axis as it returned to a closed conformation. The latter is characterized by an average dON = 6.8 ± 0.5Å. The large standard deviation values calculated dON in extra-helical U demonstrate the high mobility and complex dynamics of a flipped-out base. On the top-right panel of Figure 7, we also show for comparison the modified DNA fragment taken from the structure of the DNA with an extra-helical T from the DNA/UNG2 complex (18). The DNA helical structure and especially the phosphate backbone in the DNA/UNG2 complex appear to be affected by direct contacts with the protein surface. Nonetheless, the distances between U–A in AUAT when U is flipped-out and between equivalent atoms in the DNA fragment from the DNA/UNG2 crystal structure are comparable. In the DNA/UNG2 complex, the distance between O2 of the extra-helical T and C4M of the methyl group replacing NH2 in the modified A is 13.7Å. For direct comparison, the DNA fragment from the DNA/UNG2 crystal structure was aligned to a snapshot from the MD simulation (Supplementary Figure S5).
Figure 7.

The distance (dON) between O2 of U6 and NH2 of A19 (see Figure 1 for nomenclature) in one of the AUAT dodecamers used to measure the kinetic decay of open states is monitored along 20 ns trajectory. In the open state, once the H-bond between O2-NH2 breaks, U6 flips out of the stacking. The flipped-out state endures for ∼11 ns before the U6 pairs back with A19, re-establishing the natural Watson–Crick conformation. Snapshots of selected structures are shown above the graph. An image of 2OXM (top-right corner) is also shown for comparison.
Base flipping also alters the conformation of the ε/ζ torsions at the base pair level. Time-series of the ε/ζ torsions for U6 and A19 are shown in Figures 8 and 9, respectively. The MD simulation starts with U6–A19 in an open conformation. For U6 ε/ζ interconvert between t/g−, which corresponds to the BI sub-state of canonical B-DNA, and g−/t, which, as we discussed in the section dedicated to the structural analysis of the U–A open conformation, is typical of open base pairs and BII sub-states. At ∼1 ns, U6 flipped out and the ε/ζ torsions change into a g−/g+ configuration. The latter held until 12 ns, when U6 closed. Here we notice a peak in the ζ values which corresponds to a t conformation. At ∼21.5 ns the ε/ζ torsions of U6 regained a conformation which interconverted between the BI BDNA t/g− and the BII BDNA g−/t. From 21.5 up to 40 ns, the ε/ζ torsions were in a t/g− conformation for 80% of the time. Figure 9 shows the values of ε/ζ torsions for the A19 base. From a B-DNA conformation during the first nano second of simulation, ε/ζ of A19 also interconvert to a g−/g+state. Contrary to U6, this conformation persists long after base pair closing returning into a canonical B-DNA t/g− conformation only after ∼30 ns of simulation.
Figure 8.

Values of the ε/ζ torsions for U6 in the AUAT dodecamer >40 ns of MD simulation. The ε is shown in purple, while ζ is shown in green. Ranges defining g+, t and g− conformations are highlighted in light green, pink and light blue, respectively, for clarity. The simulation starts with U6-A19 in an open conformation. At 1-ns U6 breaks out of the H bond with A1 and flips-out in an extra-helical position, which holds for 11 ns. During this time interval ε/ζ torsions of the U6 base are in a g−/g+ conformation. Closing into a Watson–Crick pairing at 12 ns causes a slight change in conformation. Finally, ε/ζ return in a B-DNA conformation, i.e. t/g−, at 22.5 ns.
Figure 9.

Values of the ε/ζ torsions for for A19, paired to U6, in the AUAT dodecamer >20 ns of MD simulation. The ε is shown in purple, while ζ is shown in green. Ranges defining g+, t and g− conformations are highlighted in light green, pink and light blue, respectively, for clarity. Initially ε/ζ of A19 are in a B-DNA t/g− conformation. As U6 goes in the flipped-out conformation, ∼1 ns, as for U6 ε/ζ inverts into a g−/g+. The latter holds long after U6 closes. The ε/ζ go back into a B-DNA conformation at 30 ns.
The α/γ torsions of U6 remained in the B-DNA g−/g+ conformation for the entire 40 ns simulation (Supplementary Figure S2). Time series showing the α/γ torsions of the A5 and A7 nucleotides adjacent to U6 are also shown in Supplementary Figures S3 and S4, respectively. While the A5 α/γ remained in the g−/g+ conformation throughout the 40 ns trajectory, in A7 α/γ underwent a conformational change from g−/g+ to g+/t at ∼5 ns. Upon closing of U6, the α/γ torsions returned briefly to the g−/g+ conformation and then back to g+/t. After 20 ns, they finally returned to the stable B-DNA g−/g+ conformation. This conformational change seems to be directly triggered by the U6 base flipping and does not resemble the force field-related artifacts previously reported (73), inasmuch as no disruption of adjacent base pairs or unfolding of the double helix was observed during the base-flipping event.
The observation of occasional spontaneous flipping from open states shows that such events are energetically feasible at room temperature. As proposed earlier by Parker et al. (18), we find that the transition from open base pairs into pairs with an extra-helical base can indeed take place without the active participation of a repair enzyme. This finding supports the conclusion that U recognition by UDG may occur while the base is an extra-helical position. Earlier work showed that base flipping from an open state for G–C base pairs is energetically less demanding than breaking the Watson–Crick pairing (72). Indeed, while a closed G–C base pair is held together by three H-bonds, G–C open states (like T(U)-A open states) are held by a single H-bond. Free-energy simulations by Bouvier and Grubmüller (72) showed that breaking the closed C–G base pair with base rotation towards the major groove to form an open state requires 6–10 kcal/mol. This value is in agreement with the ∼8 kcal/mol estimate derived from the ratio between base pair millisecond-opening rates obtained from NMR imino proton exchange, and nanosecond closing rates obtained from our simulations. In contrast, further extensions of the flipping angle require only an additional 2 kcal/mol (72). Similarly, it can be expected that breaking the open state in T(U)–A base pairs is less energetically demanding that breaking the T(U)–A in Watson–Crick pairing. Additionally, spontaneous base flipping of an adenosine through the major groove was previously observed in a free-energy study of base pair opening in RNA (79).
As shown in Figure 1c, we propose a 3-step reaction pathway for U–A spontaneous flipping with an open state as intermediate. The finding that extra-helical U can develop spontaneously from an intermediate open U–A base pairs combined to the U–A versus T–A sequence dependence of base pair opening kinetics derived from NMR experiments, has important implications in the repair efficiency shown by UDGs. UDGs locate and excise U with a mechanism based on a combination of hopping and 1D sliding along the DNA double helix. More specifically, UDGs hop on different sites of the same DNA chain and at those points they perform an 1D-scan for a stretch of about one helical turn or ∼10 bp, before detaching again (12). This mechanism is more effective than a continuous and redundant 1D-scan along the whole length of the double helix, whose efficiency is determined by the probability of sliding away from or towards the damage site. In a kinetic study of the mechanism used by UNG from Echerichia coli to identify and repair U, Porecha and Stivers estimated that during the 1D-slide, UNG samples each base pair for ∼0.5 ms (12,17). The rate-limiting step in our spontaneous flipping pathway (shown in Figure 1c) is most likely base pair opening, which is known to be kinetically competent in terms of UNG scanning (12). There is also mounting evidence that UDGs recognize and capture U in the extra-helical position (18), without actively breaking the Watson–Crick pairing and our results support this conclusion. NMR imino exchange data (22) suggest that U–A pairs open more frequently than T–A pairs. If indeed extra-helical bases develop from open states, during the 1D-scan of the DNA helix a repair enzyme would encounter extra-helical U more often than extrahelical T. This rationale explains the high efficiency shown by UDG in finding and excising U, without having to recur to the active participation of the enzyme in base extraction, or in the recognition of subtle, and as yet unidentified structural or dynamical features specific to U-containing DNA sequences.
CONCLUSIONS
This work examines the effects of the presence of a mismatched U–A base pair relative to the natural base pair T–A on the structure and dynamics of 12 B-DNA dodecamers. Selected base pair and helical parameters were monitored throughout extensive MD simulations with the aim to assess the impact of the lesion on the helical structure when base pairs are in the Watson–Crick conformation. We found that at the base pair level U–A mismatches are virtually unrecognizable from the natural T–A pairs.
During the MD simulation, we observed a spontaneous opening of the U–A base pair in the d5′(CGCGTAUACGCG)3′, or more simply TAUA, dodecamer. This opening event involved the replacement of the two H-bonds holding together the Watson–Crick base pair by a single H-bond. The structure of the open base pair is characterized by specific values of the shear and stretch parameters and by an inversion of the configuration of the ε/ζ backbone torsions from t/g− to g−/t. We used the reaction coordinate observed for the spontaneous opening of U–A in TAUA to generate open base pairs in all 12 dodecamers. These structures were used to study the kinetic decay of open U–A relative to open T–A pairs. Our results show that open base pair kinetics is only weakly dependent on the local sequence. In agreement with NMR imino proton exchange studies on C–G and T–A base pairs (28,31), we found that closing rates for both T–A and U–A base pairs are in the nanosecond time scale. We conclude that closing dynamics might be relevant only in terms of local molecular motions but has no impact on enzymatic recognition of damage, which takes place in the millisecond time scale.
The extensive sampling of the open state allowed us to observe spontaneous base-flipping events starting from open U–A base pairs in the AUAT, TAUA and TAAU dodecamers. In contrast, no spontaneous base flipping was observed for natural T–A base pairs. We analyzed the structure and dynamics of base flipping in the AUAT dodecamer, for which U remained in an extra-helical position for ∼11 ns and then returned directly to a Watson–Crick conformation. The U–A flipped-out state that we described in this work is similar to a DNA structure co-crystallyzed with UNG2 showing an extra-helical base (18). Based on these results, we propose that U–A base flipping can develop spontaneously at room temperature from open base pairs (Figure 1c). The formation of extra-helical bases through this pathway does not require direct action of repair enzymes. As also shown by previous MD studies (72), extra-helical bases exhibit complex dynamics. Our observations suggest that the flipped base state corresponds to rapidly interconverting multiple conformations in equilibrium with both open and closed states. The occurrence of extra-helical base pairs developing spontaneously from an open state is indicative of the low-energetic demand of such an event. In order to further characterize this mechanism, a systematic energetic analysis of U–A base pair opening and flipping is currently under way.
SUPPLEMENTARY DATA
Supplementary Data are available at NAR Online.
FUNDING
National University of Ireland, Galway (NUIG), and Canadian Institute for Health Research (CIHR) (MOP43949). Canada Research Chair (to R.P.). Funding for open access charge: NUIG and CIHR.
Conflict of interest statement. None declared.
ACKNOWLEDGEMENTS
Calculations were run on computational resources from the sharcnet network (https://www.sharcnet.ca), and from the Center for Computational Biology at the Hospital for Sick Children (CCB, http://www.ccb.sickkids.ca).
REFERENCES
- 1.Sousa MML, Krokan HE, Sluppaugh G. DNA-uracil and human pathology. Mol. Asp. Med. 2007;28:276–306. doi: 10.1016/j.mam.2007.04.006. [DOI] [PubMed] [Google Scholar]
- 2.Krokan HE, Standal R, Sluppaugh G. DNA glycosylases in the base excision repair of DNA. Biochem. J. 1997;325:1–16. doi: 10.1042/bj3250001. [DOI] [PMC free article] [PubMed] [Google Scholar]
- 3.Krokan HE, Drabløs F, Sluppaugh G. Uracil in DNA — occurrence, consequences and repair. Oncogene. 2002;21:8935–8948. doi: 10.1038/sj.onc.1205996. [DOI] [PubMed] [Google Scholar]
- 4.Friedberg EC, Walker GC, Siede W, Wood RD, Schultz RA, Ellenberger T. DNA Repair and Mutagenesis. Washington DC: ASM Press; 2006. [Google Scholar]
- 5.Andersen S, Heine T, Sneve R, Konig I, Krokan HE, Epe B, Nilsen H. Incorporation of dUMP into DNA is a major source of spontaneous DNA damage, while excision of uracil is not required for cytotoxicity of fluoropyrimidines in mouse embryonic fibroblasts. Carcinogenesis. 2005;26:547–555. doi: 10.1093/carcin/bgh347. [DOI] [PubMed] [Google Scholar]
- 6.Ames BN. Micronutrient deficiencies A major cause of DNA damage. Ann. NY Acad. Sci. 1999;889:87–106. doi: 10.1111/j.1749-6632.1999.tb08727.x. [DOI] [PubMed] [Google Scholar]
- 7.Gadsden MH, McIntosh EM, Game JC, Wilson PJ, Haynes RH. dUTP phosphosphatase is an essential enzyme in Saccharomyces cervisiae. EMBO J. 1993;12:4425–4431. doi: 10.1002/j.1460-2075.1993.tb06127.x. [DOI] [PMC free article] [PubMed] [Google Scholar]
- 8.Ingraham HA, Dickey L, Goulian M. DNA fragmentation and cytotoxicity from increased cellular deoxyuridylate. Biochemistry. 1986;25:3225–3230. doi: 10.1021/bi00359a022. [DOI] [PubMed] [Google Scholar]
- 9.Stivers JT, Jiang YL. A mechanistic perspective on the chemistry of DNA repair glycosylases. Chem. Rev. 2003;103:2729–2759. doi: 10.1021/cr010219b. [DOI] [PubMed] [Google Scholar]
- 10.Jiang YL, Stivers JT. Mutational analysis of the base flipping mechanism of uracil DNA glycosylase. Biochemistry. 2002;41:11236–11247. doi: 10.1021/bi026226r. [DOI] [PubMed] [Google Scholar]
- 11.Blainey PC, van Oijen AM, Banerjee A, Verdine GL, Xie XS. A base-excision DNA-repair protein finds intrahelical lesion bases by fast sliding in contact with DNA. Proc. Natl Acad. Sci. USA. 2006;103:5752–5757. doi: 10.1073/pnas.0509723103. [DOI] [PMC free article] [PubMed] [Google Scholar]
- 12.Porecha RH, Stivers JT. Uracil DNA glycosylase uses DNA hopping and short-range sliding to trap extrahelical uracils. Proc. Natl Acad. Sci. USA. 2008;105:10791–10796. doi: 10.1073/pnas.0801612105. [DOI] [PMC free article] [PubMed] [Google Scholar]
- 13.Daniels DS, Woo TT, Luu KX, Noll DM, Clarke ND, Pegg AE, Tainer JA. DNA binding and nucleotide flipping by the human DNA repair protein AGT. Nat. Struct. Mol. Biol. 2004;11:714–720. doi: 10.1038/nsmb791. [DOI] [PubMed] [Google Scholar]
- 14.Parikh SS, Walcher G, Jones GD, Slupphaug G, Krokan HE, Blackburn GM, Tainer JA. Uracil-DNA glycosylase-DNA substrate and product structures: conformational strain promotes catalytic efficiency by coupled stereoelectronic effects. Proc. Natl Acad. Sci. USA. 2000;97:5083–5088. doi: 10.1073/pnas.97.10.5083. [DOI] [PMC free article] [PubMed] [Google Scholar]
- 15.Stivers JT. Site-specific DNA damage recognition by enzyme induced base flipping. Prog. Nucleic Acid. Res. Mol. Biol. 2004;77:37–65. doi: 10.1016/S0079-6603(04)77002-6. [DOI] [PubMed] [Google Scholar]
- 16.Sluppaugh G, Mol CD, Kavli B, Arvai AS, Krokan HE, Tainer JA. A nucleotide-flipping mechanism from the structure of human uracil–DNA glycosylase bound to DNA. Nature. 1996;384:87–92. doi: 10.1038/384087a0. [DOI] [PubMed] [Google Scholar]
- 17.Stivers JT. Extrahelical damaged base recognition by DNA glycosylase enzymes. Chemistry. 2008;14:786–793. doi: 10.1002/chem.200701501. [DOI] [PMC free article] [PubMed] [Google Scholar]
- 18.Parker JB, Bianchet MA, Krosky DJ, Friedman JI, Amzel LM, Stivers JT. Enzymatic capture of an extrahelical thymine in the search for uracil in DNA. Nature. 2007;449:433–437. doi: 10.1038/nature06131. [DOI] [PMC free article] [PubMed] [Google Scholar]
- 19.Mol CD, Arvai AS, Sanderson RJ, Sluppaugh G, Kavli B, Krokan HE, Mosbaugh DW, Tainer JA. Crystal structure of human uracil-DNA glycosylase in complex with a protein inhibitor: protein mimicry of DNA. Cell. 2004;82:701–708. doi: 10.1016/0092-8674(95)90467-0. [DOI] [PubMed] [Google Scholar]
- 20.Mol CD, Arvai AS, Sluppaugh G, Kavli B, Alseth I, Krokan HE, Tainer JA. Crystal structure and mutational analysis of human uracil-DNA glycosylase: structural basis for specificity and catalysis. Cell. 1995;80:869–878. doi: 10.1016/0092-8674(95)90290-2. [DOI] [PubMed] [Google Scholar]
- 21.Mura C, McCammon AJ. Molecular dynamics of kB DNA element: base flipping via cross-strand intercalative stacking in a microsecond scale simulation. Nucleic Acid Res. 2008;36:4941–4955. doi: 10.1093/nar/gkn473. [DOI] [PMC free article] [PubMed] [Google Scholar]
- 22.Wärmländer S, Sponer JE, Sponer J, Leijon M. Influence of the thymine C5 methyl group on spontaneous breathing in DNA. J. Biol. Chem. 2002;277:28491–28497. doi: 10.1074/jbc.M202989200. [DOI] [PubMed] [Google Scholar]
- 23.Dornberger U, Leijon M, Fritzshe H. High base pair opening rates in tracts of GC base pairs. J. Biol. Chem. 1999;274:6957–6962. doi: 10.1074/jbc.274.11.6957. [DOI] [PubMed] [Google Scholar]
- 24.Cao C, Jiang YL, Stivers JT, Song F. Dynamic opening of DNA during the enzymatic search for a damaged base. Nature Struct. Mol. Biol. 2004;11:1230–1236. doi: 10.1038/nsmb864. [DOI] [PubMed] [Google Scholar]
- 25.Cao C, Jiang YL, Krosky DJ, Stivers JT. The catalytic power of uracil DNA glycosylases in the opening of thymine base pairs. J. Am. Chem. Soc. 2006;128:13034–13035. doi: 10.1021/ja062978n. [DOI] [PMC free article] [PubMed] [Google Scholar]
- 26.Leijon M, Gräslund A. Effects of sequence and length on imino proton exchange and base pair opening kinetics in DNA oligonucleotides duplexes. Nucleic Acid Res. 1992;20:5339–5343. doi: 10.1093/nar/20.20.5339. [DOI] [PMC free article] [PubMed] [Google Scholar]
- 27.Bhattacharya PK, Barton JK. 1H NMR determination of base-pair lifetimes in oligonucleotides containing single base mismatches. Nucleic Acid Res. 2002;30:4740–4750. doi: 10.1093/nar/gkf601. [DOI] [PMC free article] [PubMed] [Google Scholar]
- 28.Priyakumar UD, MacKerell ADJ. NMR imino proton exchange esperiments on duplex DNA primarily monitor of the opening of purine bases. J. Am. Chem. Soc. 2006;128:678–679. doi: 10.1021/ja056445a. [DOI] [PMC free article] [PubMed] [Google Scholar]
- 29.Guéron M, Kochoyan M, Leroy JL. A single mode of DNA base-pair opening drives imino proton exchange. Nature. 1987;328:89–92. doi: 10.1038/328089a0. [DOI] [PubMed] [Google Scholar]
- 30.Mirau PA, Kearns DR. Sequence and conformational effects of imino proton exchange in A.T and A.U-containing DNA and RNA duplexes. Biopolymers. 2004;24:711–724. doi: 10.1002/bip.360240410. [DOI] [PubMed] [Google Scholar]
- 31.Lee J-H, Pardi A. Thermodynamics and kinetics for base-pair opening in the P1 duplex of the Tetrahymena group I ribozyme. Nucleic Acid Res. 2007;35:2965–2974. doi: 10.1093/nar/gkm184. [DOI] [PMC free article] [PubMed] [Google Scholar]
- 32.Banavali NK, MacKerell JAD. Free energy and structural pathways of base flipping in a DNA GCGC containing sequence. J. Mol. Biol. 2002;319:141–160. doi: 10.1016/S0022-2836(02)00194-8. [DOI] [PubMed] [Google Scholar]
- 33.MacKerell ADJ, Nilsson L. Molecular dynamics simulations of nucleic acid-protein complexes. Curr. Opin. Struct. Biol. 2008;18:194–199. doi: 10.1016/j.sbi.2007.12.012. [DOI] [PMC free article] [PubMed] [Google Scholar]
- 34.Zhao T, Dinner AR. Apparent directional scanning for DNA repair. Biophys. J. 2008;94:47–52. doi: 10.1529/biophysj.107.110619. [DOI] [PMC free article] [PubMed] [Google Scholar]
- 35.Banerjee A, Yang W, Karplus M, Verdine GL. Structure of repair enzyme interrogating undamaged DNA elucidates recognition of damaged DNA. Nature. 2005;434:612–618. doi: 10.1038/nature03458. [DOI] [PubMed] [Google Scholar]
- 36.Salsbury FRJ, Clodfelter JE, Gentry MB, Hollis T, Drotschmann Scarpinato K. The molecular mechanism of DNA damage recognition by MutS homologs and its consequences for cell death response. Nucleic Acid Res. 2006;34:2173–2185. doi: 10.1093/nar/gkl238. [DOI] [PMC free article] [PubMed] [Google Scholar]
- 37.Markwick PR, Doltsinis NL, Schlitter J. Probing irradiation induced DNA damage mechanism using excited state Car-Parrinello molecular dynamics. J. Chem. Phys. 2007;126:045104. doi: 10.1063/1.2431177. [DOI] [PubMed] [Google Scholar]
- 38.Wang P, Nicklaus MC, Marquez VE, Brank AS, Christman J, Banavali NK, MacKerell JAD. Use of oligodeoxyribonucleotides with conformationally constrained abasic sugar targets to probe the mechanism of base flipping by HhaI DNA (Cytosine C5)-methyltransferase. J. Am. Chem. Soc. 2000;122:12422–12434. [Google Scholar]
- 39.Vàrnai P, Djuranovic D, Lavery R, Hartmann B. α/γTransitions in the B-DNA backbone. Nucleic Acid Res. 2002;30:5398–5406. doi: 10.1093/nar/gkf680. [DOI] [PMC free article] [PubMed] [Google Scholar]
- 40.Marathe A, Bansal M. The 5-methyl group in thymine dynamically influences the structure of A-tracts in DNA at the local and global level. J. Phys. Chem. B. 2010;114:5534–5546. doi: 10.1021/jp911055x. [DOI] [PubMed] [Google Scholar]
- 41.Giudice E, Varnai P, Lavery R. Energetic and conformational aspects of A: T base-pair opening within the DNA double helix. Chemphyschem. 2001;2:673–677. doi: 10.1002/1439-7641(20011119)2:11<673::AID-CPHC673>3.0.CO;2-S. [DOI] [PubMed] [Google Scholar]
- 42.Huang N, Banavali NK, MacKerell AD. Protein-facilitated base flipping in DNA by cytosine-5-methyltransferase. Proc. Natl Acad. Sci. USA. 2003;100:68–73. doi: 10.1073/pnas.0135427100. [DOI] [PMC free article] [PubMed] [Google Scholar]
- 43.Cheatham TE, Cieplak P, Kollmann PA. A modified version of the Cornell et al. force field with improved sugar pucker phases and helical repeat. J. Biomol. Struct. Dyn. 1999;16:845–862. doi: 10.1080/07391102.1999.10508297. [DOI] [PubMed] [Google Scholar]
- 44.Cornell WD, Cieplak P, Baily C, Gould IR, Merz KM, Ferguson DC, Fox T, Caldwell JW, Kollmann PA. A second generation force field for the simulation of proteins, nucleic acids, and organic molecules. J. Am. Chem. Soc. 1995;117:5179–5197. [Google Scholar]
- 45.Jorgensen WL, Chandrasekhar J, Madura JD, Impey RW, Klein ML. Comparison of simple potential functions for simulating liquid water. J. Chem. Phys. 1983;79:926. [Google Scholar]
- 46.Rueda M, Cubero E, Laughton CA, Orozco M. Exploring the counterion atmosphere around DNA: what can be learned from molecular dynamics simulations? Biophys. J. 2004;87:800–811. doi: 10.1529/biophysj.104.040451. [DOI] [PMC free article] [PubMed] [Google Scholar]
- 47.Lindhal E, Hess B, van der Spoel D. GROMACS: a package for molecular simulation and trajectory analysis. J. Mol. Mod. 2001;7:306–317. [Google Scholar]
- 48.van der Spoel D, Lindhal E, Hess B, van Buuren AR, Apol E, Maeulenhoff PJ, Tieleman DP, Sijbers ALTM, Feenstra KA, van Drunen R, et al. Gromacs User Manual Version 4.0. 2005. Available online at: www.gromacs.org. [Google Scholar]
- 49.Darden T, York D, Pedersen L. Particle mesh ewald: an Nlog(N) method for Ewald sums in large systems. J. Chem. Phys. 1993;98:10089. [Google Scholar]
- 50.Keepers JW, Kollmann PA, Weiner PK, James TL. Molecular mechanics studies of DNA flexibility: coupled backbone torsion angles and base-pair openings. Proc. Natl Acad. Sci. USA. 1982;79:5537–5541. doi: 10.1073/pnas.79.18.5537. [DOI] [PMC free article] [PubMed] [Google Scholar]
- 51.Lu XJ, Olson WK. 3DNA: a software package for the analysis, rebuilding and visualization of three-dimensional nucleic acid structures. Nucleic Acid Res. 2003;31:5108–5121. doi: 10.1093/nar/gkg680. [DOI] [PMC free article] [PubMed] [Google Scholar]
- 52.Lu XJ, Olson WK. 3DNA: a versatile, integrated software system for the analysis, rebuilding and visualization of three-dimensional nucleic-acid structures. Nat. Protoc. 2008;3:1213–1227. doi: 10.1038/nprot.2008.104. [DOI] [PMC free article] [PubMed] [Google Scholar]
- 53.El Hassan MA, Calladine CR. Two distinct modes of protein-induced bending in DNA. J. Mol. Biol. 1998;282:331–343. doi: 10.1006/jmbi.1998.1994. [DOI] [PubMed] [Google Scholar]
- 54.Drew HR, Dickerson RE. Structure of a B-DNA dodecamer III. Geometry of hydration. J. Mol. Biol. 1981;151:535–556. doi: 10.1016/0022-2836(81)90009-7. [DOI] [PubMed] [Google Scholar]
- 55.Dickerson RE, Drew HR. Structure of a B-DNA dodecamer II Influence of base sequence on helix structure. J. Mol. Biol. 1981;149:761–786. doi: 10.1016/0022-2836(81)90357-0. [DOI] [PubMed] [Google Scholar]
- 56.Alexeev DG, Lipanov AA, Skuratovskii IY. Poly(dA)-poly(dT) is a B-type double helix with a distinctively narrow minor groove. Nature. 1987;325:821–823. doi: 10.1038/325821a0. [DOI] [PubMed] [Google Scholar]
- 57.Egli M, Flavell A, Pyle AM, Wilson WD, Haq SI, Luisi B, Blackburn GM, Gait MJ, Loakes D, Williams DM. Nucleic Acids in Chemistry and Biology. Cambridge: RCS Publishing; 2006. [Google Scholar]
- 58.Young MA, Jayaram B, Beveridge DL. Intrusion of counterions into the spine of hydration in the minor groove of B-DNA: fractional occupancy of electronegative pockets. J. Am. Chem. Soc. 1997;119:59–69. [Google Scholar]
- 59.McFail-Isom L, Sines CC, Williams LD. DNA structure: cations in charge? Curr. Opin. Struct. Biol. 1999;9:298–304. doi: 10.1016/S0959-440X(99)80040-2. [DOI] [PubMed] [Google Scholar]
- 60.Koudelka GB, Mauro SA, Ciubotaru M. Indirect readout of DNA sequence by proteins: the roles of DNA sequence-dependent intrinsic and extrinsic forces. Progr. Nucleic Acid Res. Mol. Biol. 2006;81:143–177. doi: 10.1016/S0079-6603(06)81004-4. [DOI] [PubMed] [Google Scholar]
- 61.Marincola Cesare F, Denisov VP, Halle B. Competitive Na+ and Rb+ binding in the minor groove of DNA. J. Am. Chem. Soc. 2004;126:6739–6750. doi: 10.1021/ja049930z. [DOI] [PubMed] [Google Scholar]
- 62.Aqvist J. Ion water interaction potentials derived from free-energy perturbation simulations. J. Phys. Chem. 1990;94:8021–8024. [Google Scholar]
- 63.Auffinger P, Cheatham TE, Vaiana AC. Spontaneous formation of KCl aggregates in biomolecular simulations: a force field issue? J. Chem. Theory Comput. 2007;3:1851–1859. doi: 10.1021/ct700143s. [DOI] [PubMed] [Google Scholar]
- 64.Hamelberg D, Williams LD, Wilson WD. Influence of the dynamic position of cations on the structure if the DNA minor groove: sequence-dependent effects. J. Am. Chem. Soc. 2001;123:7745–7755. doi: 10.1021/ja010341s. [DOI] [PubMed] [Google Scholar]
- 65.Hamelberg D, Williams LD, Wilson WD. Effect of a neutralized phosphate backbone on the minor groove of B-DNA: molecular dynamics simulation studies. Nucleic Acid Res. 2002;30:3615–3623. doi: 10.1093/nar/gkf472. [DOI] [PMC free article] [PubMed] [Google Scholar]
- 66.Dickerson RE. DNA Structure from A to Z. Method Enzymol. 1992;211:67–111. doi: 10.1016/0076-6879(92)11007-6. [DOI] [PubMed] [Google Scholar]
- 67.Young MA, Ravishanker G, Beveridge DL. A 5-nanosecond molecular dynamics trajectory for B-DNA: analysis od Structure, Motions, and Solvation. Biophys. J. 1997;73:2313–2336. doi: 10.1016/S0006-3495(97)78263-8. [DOI] [PMC free article] [PubMed] [Google Scholar]
- 68.Fratini AV, Kopka ML, Drew HR, Dickerson RE. Reversible bending and helix geometry in B-DNA dodecamer: CGCGAATTBrCGCG. J. Biol. Chem. 1982;257:14686–14707. [PubMed] [Google Scholar]
- 69.Grzeskowiak K, Yanagi K, Prive GG, Dickerson RE. The structure of B-helical C-G-A-T-C-G-A-T-C-G and comparison with C-C-A-A-C-G-T-T-G-G. The effect of base pair reversals. J. Biol. Chem. 1991;266:8861–8883. doi: 10.2210/pdb1d23/pdb. [DOI] [PubMed] [Google Scholar]
- 70.Hartmann B, Piazzola D, Lavery R. BI-BII transitions in B-DNA. Nucleic Acid Res. 1993;21:561–568. doi: 10.1093/nar/21.3.561. [DOI] [PMC free article] [PubMed] [Google Scholar]
- 71.Winger RH, Liedl KR, Rüdisser S, Pichler A, Hallbrucker A, Mayer E. B-DNA's BI → BII conformer substate dynamics is coupled with water migration. J. Phys. Chem. B. 1998;102:8934–8940. [Google Scholar]
- 72.Bouvier B, Grubmüller H. A molecular dynamics study of slow base flipping in DNA using conformational flooding. Biophys. J. 2007;93:770–786. doi: 10.1529/biophysj.106.091751. [DOI] [PMC free article] [PubMed] [Google Scholar]
- 73.Pérez A, Marchán I, Svozil J, Sponer J, Cheatham TE, Laughton CA, Orozco M. Refinement of the AMBER force field for nucleic acids: improving the description of alpha/gamma conformers. Biophys. J. 2007;92:3817–3829. doi: 10.1529/biophysj.106.097782. [DOI] [PMC free article] [PubMed] [Google Scholar]
- 74.Heinemann U, Hahn M. C-C-A-G-G-C-M5C-T-G-G — helical fine-structure, hydration, and comparison with C-C-A-G-G-C-C-T-G-G. J. Biol. Chem. 1992;267:7332–7341. [PubMed] [Google Scholar]
- 75.Umemoto K, Sarma MH, Gupta G, Sarma RH. Effect of the methyl-group on DNA bending and curvature—Structure of d(GA4U4C)2 in solution. Biochemistry. 1990;29:4714–4722. doi: 10.1021/bi00471a028. [DOI] [PubMed] [Google Scholar]
- 76.Delort A-M, Neumann JM, Molko D, Hervé M, Téoule R, Tran Dinh S. Influence of uracil defect on DNA structure: 1H NMR invastigation 500 MHz. Nucleic Acid Res. 1985;13:3343–3355. doi: 10.1093/nar/13.9.3343. [DOI] [PMC free article] [PubMed] [Google Scholar]
- 77.Hodges-Garcia Y, Hagerman PJ. Investigation of the influence of cytosine methylation on DNA flexibility. J. Biol. Chem. 1995;270:197–201. doi: 10.1074/jbc.270.1.197. [DOI] [PubMed] [Google Scholar]
- 78.Englander SW, Kallenbach NR. Hydrogen exchange and structural dynamics of protein and nucleic-acids. Q. Rev. Biophys. 1983;16:521–655. doi: 10.1017/s0033583500005217. [DOI] [PubMed] [Google Scholar]
- 79.Hart K, Nystrom B, Ohman M, Nilsson L. Molecular dynamics simulations and free energy calculations of base flipping in dsRNA. RNA Publication RNA Soc. 2005;11:609–618. doi: 10.1261/rna.7147805. [DOI] [PMC free article] [PubMed] [Google Scholar]
Associated Data
This section collects any data citations, data availability statements, or supplementary materials included in this article.