Abstract
An experimentally simple photon counting method is demonstrated providing seven orders of magnitude in linear dynamic range (LDR) for a single photomultiplier tube (PMT) detector. In conventional photon/electron counting methods, the linear range is dictated by the agreement between the binomially distributed measurement of counted events and the underlying Poisson distribution of photons/electrons. By explicitly considering the lognormal probability distribution in voltage transients as a function of the number of photons present and the Poisson distribution of photons, observed counts for a given threshold can be related to the mean number of photons well beyond the conventional limit. Analytical expressions are derived relating counts and photons that extend the linear range to an average of ~11 photons arriving simultaneously with a single threshold. These expressions can be evaluated numerically for multiple thresholds extending the linear range to the saturation point of the PMT. The peak voltage distributions are experimentally shown to follow a Poisson weighted sum of lognormal distributions that can all be derived from the single photoelectron voltage peak-height distribution. The LDR that results from this method is compared to conventional single photon counting (SPC) and to signal averaging by analog to digital conversion (ADC).
Introduction
Photon counting is a well-established method providing low detection limits in sensitive optical measurements. However, conventional approaches for photon counting suffer from nonlinearities at high count rates.1–6 Several strategies have been adopted for improving the LDR of light detection using photomultiplier tube and avalanche photodiode detectors. In the simplest cases, neutral density filters attenuate high light levels to remain within the linear range of counting systems. However, this approach is too slow to provide large continuous dynamic ranges in rapid sampling applications and requires careful calibration of optical density for the filters.7 Dovichi and coworkers used a series of photodetectors and fiber-optic beamsplitters to sample different fractions of the beam, equivalent to performing simultaneous photon counting with several neutral density filters. Using this approach, they demonstrated 6 orders of magnitude of linear response. Other methods include combining of photon counting detection for low-light levels with analog to digital conversion to extend the LDR to the high photon flux regime.8 Alternatively, fast ADC of the time-trace followed by Fourier transformation can deconvolve the number of photons present in a time window, but requires long analysis times and the need for fast ADC (~11GHz sampling).9
For relatively high intensities such that the probability of two or more photons arising per measurement window becomes significant (i.e., outside the Poisson limit for photon counting), several methods are available, most of which are based on signal integration. Fast ADC allows signal averaging of the digitally stored data and has the advantage of a minimal dead time between acquisition windows. Box-car integration reverses the order of operations (i.e., integration first, followed by ADC), but is otherwise similar in design.10 Although these approaches allow quantification out to the limit of detector saturation on the high intensity end, signal integration/averaging suffers from significant S/N limitations at low intensities when the probability of observing a count in a given measurement window is much less than 1. Under such conditions, most of the integration time is spent averaging noise only, with the contributions from rare photons integrating to low values. Furthermore, the proportionality constant connecting the integrated output with the mean of the Poisson distribution of photons is generally not known, requiring careful calibration to obtain the absolute count rate.
Despite the successes of these previous methods, each approach involves performance trade-offs. Detectors optimized for photon counting with fast rise/fall times are generally not optimized for ADC and vice versa. Sensitivity mismatch in the instrument responses from single photon counting (SPC) with ADC may impact reliable quantitation and requires simultaneous data acquisition using two fundamentally different electronics approaches.11 Noise from combinations of multiple detectors is additive. In addition, differences in sensitivity and drift can potentially complicate accuracy in stitching together the results from multiple detectors.
Several treatises have covered in detail the relationship between the detected count rate and the selection of the threshold voltage of the counting discriminator(s).1–6 Building on this knowledge, Hänninen and coworkers proposed implementation of multiple thresholds to improve the dynamic range of photon counting systems from a single-channel detector.12 In measurements with pulsed excitation and long times between pulses relative to the detector response time (e.g., multiphoton and nonlinear optical microscopy at < 100 MHz laser pulse repetition rates with detector fall times < 10 ns), the voltage transients from the single-photon events can be reliably treated as temporally coincident. Hänninen and coworkers sought to enable quantitative detection of up to 4 simultaneous photons per laser pulse by careful adjustment of the threshold of each discriminator to fall between the peak voltage distributions of n and n+1 simultaneous photons. Although reasonably successful, this approach suffers in practice from the relatively large deviations in peak height distributions for a single photon in most practical photomultiplier tubes. Since the mean and variance in the peak voltage distribution increase linearly with the number of photons, the distributions for n and n+1 photons quickly overlap as n increases, rapidly increasing the uncertainty in attempts to quantify the number of simultaneous photons with this approach.
In the present study, an analytical expression is derived to extend the linear range of traditional (single threshold) photon counting measurements to ~11 photons per trial, and a multithreshold, numerical method is developed that can extend that range up to that of ADC signal averaging. The intrinsic variance in peak heights for single photon events, limiting Hänninen and coworkers’ method, is put to use as an essential requirement in the latter analysis and critical for extending the LDR. In brief, by inputting the single-photon peak-height distribution, convolved peak-height distributions for multiple photon events are calculated, then summed by a Poisson weighting to generate the collective peak height distribution (CPHD) for an assumed mean of a Poisson distribution. The mean number of counts expected for a given discriminator threshold is calculated from the CPHD and compared with experimentally measured counts exceeding the threshold. Values for the mean of the Poisson distribution are then iteratively adjusted by a singleparameter weighted least squares minimization. This approach has two key outcomes not easily achievable using common alternatives: 1) continuous linear dynamic range from the photon counting lower limit to detector saturation with a single electronics package, and 2) intrinsic internal intensity calibration based on the single-photon peak height distribution.
Theory and Modeling
Measurement using discriminators
The primary objective of quantitative photon counting measurements is almost invariably accurate determination of the mean of the underlying Poisson distribution, fP.
| (1) |
| (2) |
However, the use of discriminators only yields two possible outcomes; either the voltage transient exceeds a threshold or it does not. Therefore, the output of conventional photon-counting instrumentation is described by a binomial pdf. Here, the probability fB of observing a particular number of counts x for a given discriminator threshold in a photon counting experiment follows the binomial distribution.
| (3) |
| (4) |
In eq. 3, p is the probability of a successful outcome (e.g., a voltage rising to exceed a discriminator threshold), and N is the number of measurements. In the limit of low values of p and high values of N binomial distribution converges to the Poisson, allowing μB (i.e. counts) to be used as μP. However, these two distributions depart as μP increases and the number of events in which two or more photons are generated per laser pulse becomes significant. Most conventional photon counting approaches are restricted to this low-flux regime where the two distributions converge. However, the binomial distribution is still valid for describing experimental measurements with higher count rates. A key goal of this study is to deduce the mean of the underlying Poisson distribution of photons from the measured binomially distributed values, and thus extend the range over which Poisson-distributed photons can be recorded by photon counting methods. By bridging the distributions, the signal to noise ratio is maintained close to the theoretical Poisson limit of conventional photon counting for rates over nearly the entire linear range. This initial demonstration is focused on pulsed-mode operation, such as might arise in multi-photon or nonlinear optical microscopy using high-repetition rate ultrafast laser sources. However, the approach is general to any counting measurement that is based on time-coincident electron multiplication. Furthermore, it may potentially be extended to measurements with continuous wave (CW) excitation by additional consideration of the temporal response of the detector, although beyond the scope of the current study.
PMT voltage response
Relating the measured binomially distributed number of counts with the Poisson distributed number of photons is facilitated by an understanding of the relationship between the distribution in detected peak voltages and the number of photons arriving at the detector. This distribution can be deduced from the fundamental nature of the amplification process. The total gain per initial photoelectron (V) is a product of the gain at each dynode. Since the gain at each dynode is an independent, random number, the pdf of V converges to a lognormal distribution by nature of the corollary to the Central Limit Theorem for multiplicative processes.
Therefore, the peak voltage distribution for a single initial electron, fL,1 with parameters ML,1 and SL,1, generated by any electron multiplying device can be generally expressed as:
| (5) |
| (6) |
| (7) |
In the event that two or more photons, n, arrive simultaneously at the detector, the peak voltage generated will be a sum of n random numbers from the single photon voltage distribution. The pdf for an n photon event is given by n-1 convolutions of the single photon response with itself.
| (8) |
Although no analytical form is known for even the first convolution of two lognormal pdfs, the resulting pdfs from the convolutions can often be remarkably well-approximated as lognormal under the conditions common to photon/electron counting.13 Using the expressions for the propagated mean and variance of the sum of n statistically independent random numbers,
| (9) |
and the expressions given in eq. 8 for a lognormal pdf, rearrangement yields the following expressions for the shape parameters ML,n and SL,n for the lognormal pdf after n-1 convolutions.
| (10) |
| (11) |
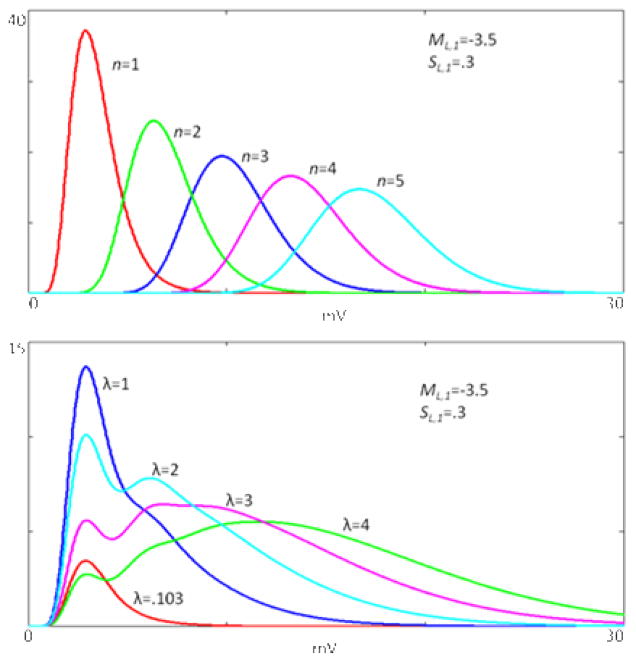
The theoretical pdfs for multiple photon events are shown in figure 1 using representative values for the mean and standard deviation of the single-photon lognormal distribution.
Figure 1.
(Top) Representative calculated lognormal voltage distributions for n photon events based on the same initial parameters, ML,1 and SL,1. ML,n and SL,n are calculated using equations 10 and 11. (Bottom) The CPHD for various mean number of photons per trial. Each curve integrates to p instead of 1 because no voltage is generated for zero photons.
Taking into account both the Poisson distribution of photons and the lognormally distributed peak voltages associated with a given number of photons, the value of p (i.e., the probability of a successful observation of a count) in eq. 3 can be expressed, for any threshold, as:
| (12) |
Analytical expression extending single threshold LDR
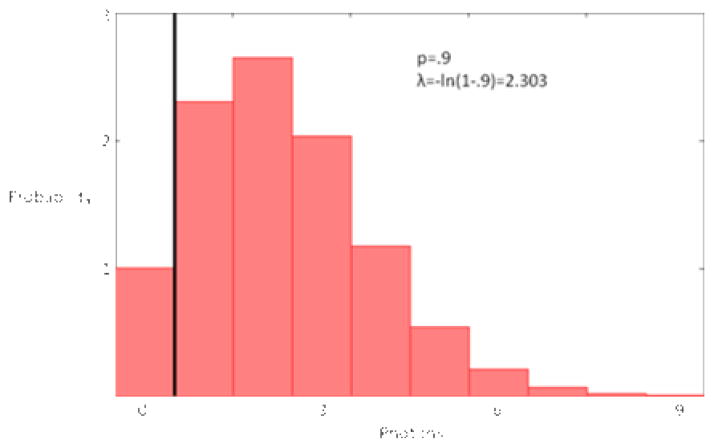
Traditionally, the threshold in the above expression is adjusted as low as possible such that the integral for any n goes to 1 (i.e., approaching the limit in which every time one or more photon initiates an electron cascade, every resulting voltage transient is expected to exceed the threshold). This theoretical limit can be closely approximated experimentally with appropriate detectors and electronics. In this limit, evaluation of the integral is no longer required, leaving only the Poisson probabilities for n photons. Np will increase linearly until the Poisson probability for n>1 becomes significant. When λ≈.103 (p=.098) or higher, the binomial observable, Np, will underestimate the true number of photons by 5%, representing the practical upper limit of the linear range for conventional photon counting. Figure 2 demonstrates why the observed counts are lower than the true number of photons in this limit. The binomial parameter p, which in this plot is 0.9, describes the integrated probability of observing one or more photons. As many as 8 photons routinely arrive at the detector simultaneously under these conditions, clearly placing the number of counts outside linear photon counting range.
Figure 2.
Example relating Poisson distribution of photons and binomial probability, p.
However, an analytical expression can be derived that relates the counts and photons that takes advantage of the Poisson statistics afforded by simultaneous photon arrival.12 If the threshold is low enough, the expression for p converges to the Poisson cumulative distribution function (cdf):
| (13) |
The expression for the most probable value of λ and the variance in the value in terms of observed counts can be derived using this expression for Np as the fitting function in a weighted one parameter nonlinear fit.
| (14) |
Χ2 is minimized when
| (15) |
The variance in this most probable value for λ can be determined from the second derivative of χ2 evaluated at the minimum.
| (16) |
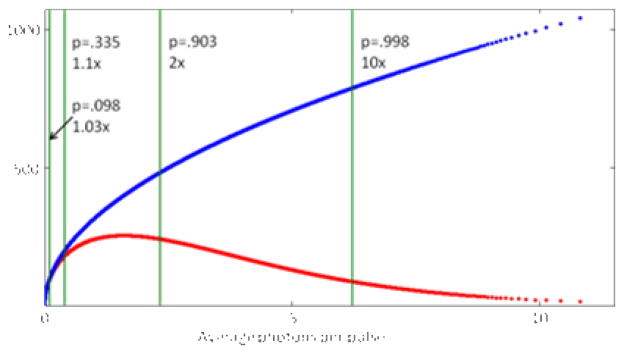
While this method holds for counting measurements of any Poisson distributed process in the limit in which every initial event (e.g., electron (12) cascade) is guaranteed to generate a detected count, there are two practical considerations. First, any realistic detector will have dark counts, (i.e., counts generated by spontaneous initiation of an electron cascade). The dark counts may be subtracted from the calculated value of λ in the lowcount limit where they are significant. Second, even though this expression will properly calculate the true mean number of photons, μP, the variance will be slightly larger than the limiting value of σP2 = μP for values of μP outside the Poisson counting range. Figure 3 illustrates the calculated signal to noise ratio (μ/σ) as a function of the calculated μP and a comparison to the ratio intrinsic in the Poisson distribution (i.e., the theoretical limit). As expected, the curve tracks exactly with the square root of counts for low counts (i.e. within Poisson counting range). Indeed, this ratio is only a factor of 2 lower than the Poisson limit when the probability of observing a count exceeds ~90% of N.
Figure 3.
The signal to noise ratios (μ/σ) calculated by equations 15 and 16 (red dots) and theoretical maximum based on the Poisson distribution (blue dots) are compared for N=100,000 trials. The green vertical bars mark the p values that correspond to given means. The multiplier indicates the increase in noise relative to the theoretical limit.
The highest quantifiable mean number of photons is only limited by N. Depending on the precision required by the experiment, it is conceivable to convert the N-1 counts into photons. The maximum quantifiable number of photons is given by ln(N). For example, this method would extend the linear range to ~11 photons per pulse on average if N=100,000 and negligible dark counts.
Multi-threshold analysis
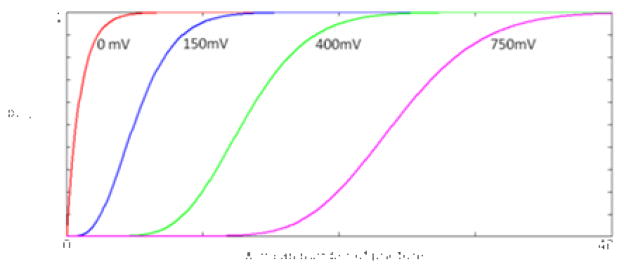
It is not always practical to simply increase N to extend the linear range, since increasing N by a factor of 10 results in a 10-fold increase in the measurement time with only a ln(10)=2.303 increase in range. A more practical method for further extension of the linear range is to set higher thresholds that will only ever be exceeded by many simultaneous photon events. However, interpreting the results from these higher thresholds requires including the lognormal peak voltage distribution in the expression for p in eq. 13. Specifically, p is given by integration over the pdf of the voltage distribution (p = 1 − cdf evaluated at that threshold value). Representative curves that relate p and photons for various thresholds are shown in figure 4, demonstrating the quantitative range for different threshold values. While it may require many thresholds for some detectors, it is possible to set them such that the dynamic range can be extended all the way to (and perhaps beyond) the range available to signal averaging measurements, limited only by roll-off in the PMT linear response from electron depletion of the dynodes. In this analysis, the same one parameter weighted nonlinear fit for the mean of the Poisson distribution is used, except now it must be solved numerically.
Figure 4.
Evaluation of p for different thresholds from equation 12 as a function of the mean number of photons. Different thresholds have sensitivity to different photon ranges. Overlap in these curves ensures continuous quantitation.
Experimental Methods
This experiment required accurately generating visible light intensities over 8 orders of magnitude. Figure 5 depicts the optical setup used to generate these intensities by second harmonic generation (SHG). In brief, a pulsed laser (JDS Nanolaser, 1064nm, 6kHz, 0.5ps pulse duration, 40 mW average power) was directed through two attenuators before reaching a frequency doubling crystal. The intensity of the detected light was controlled by selection of the rotation angles of zero-order half waveplates (calibrated to within 0.1°) used in the attenuators. Each attenuator could reliably produce 4 orders of magnitude in SHG intensity. With the incident light attenuated as much as possible, the angle of the doubling crystal was adjusted until the observed counts were well within Poisson counting range. Two different PMT’s were used in this study. A Burle 8850 was used in the confirmation of the lognormal pdf. Photonis XP2920 was used for the extended linear range. Becker-Hickl counting cards (MSA 1000) were used for counting with 1ns bins, triggered from the laser. For the higher signal intensities, 10dB attenuators were added to the signal channel, to maintain the signal level within the range of thresholds available from the counting cards. The signal averaging was performed using a oscilloscope (Tektronix 3054B) The data analysis (e.g. single multiple parameter weighted nonlinear fitting) was performed on software written in-house in MathCad 14 using built-in functions to evaluate Poisson probabilities and lognormal cdf values.
Figure 5.
Second harmonic generation optical setup 1. Pulsed infrared laser 2. Glan polarizer 3. 1064nm zeroth order halfwave plate 4. visible blocking filter 5. KTP doubling crystal 6. IR blocking filter (KG3) 7. PMT.
Results/Discussion
Confirming the lognormal peak voltage pdf
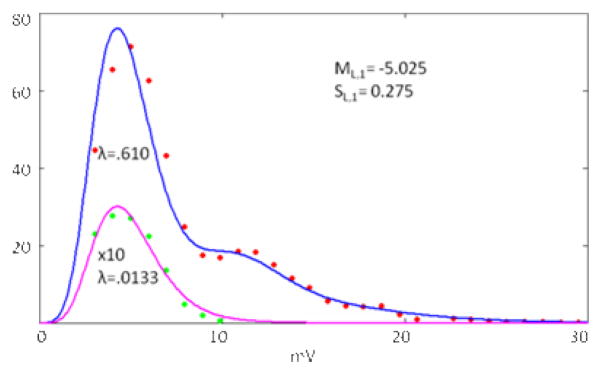
The voltage distributions for various incident photon fluxes were measured and compared with the peak voltage distributions predicted by a weighted sum of related lognormal distributions. Integrals over the voltage distributions were measured by setting successively higher thresholds and measuring the counts. The derivatives with respect to the threshold were calculated to recover the voltage distributions. For the one-photon voltage distribution, a three parameter unweighted nonlinear fit was performed to determine λ, ML,1 and SL,1. The best fit value for ML,1 was −5.025 with a standard deviation of .019 and for SL,1 was .275 with a standard deviation of .021. The green points in figure 6 represent the voltage distribution within the Poisson counting limit, where the probability of observing two or more simultaneous photons per laser pulse was much less than one. Setting ML,1 and SL,1 as constants allowed prediction of the lognormal pdfs for an arbitrary number of photons. Using the mean of the Poisson distribution λ as the only adjustable parameter, a reliable fit was generated for λ=.610 with a standard deviation of .029 for the red points and λ=.01333 with a standard deviation of .00050.
Figure 6.
Peak voltage distributions for two incident photon fluxes. The solid lines are the best fit theoretical Poisson weighted sum of lognormal distributions with parameters determined from single photon voltage distributions. The green points and pink line are rescaled by a factor of ten for visualization.
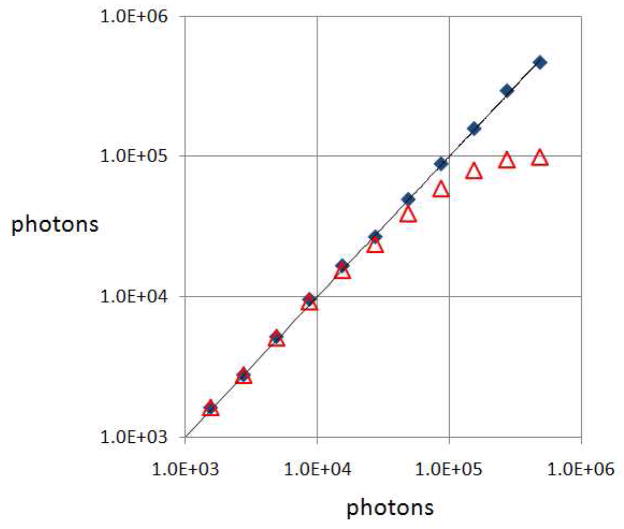
Using only the ML,1 and SL,1 parameters for a given PMT, the mean number of photons were calculated. The observed counts and the calculated photons are compared in Figure 7 as a function of the incident intensity for the range just outside of Poisson counting range. For N=105, the Poisson limit is 1.03×10⁴ counts (λ=0.103). The highest observed average number of photons was 4.71×10⁵ (λ=4.71 with a standard deviation of .033), corresponding to a nearly 50-fold increase in linear range using the analytical single threshold method described by eq. 16. The signal to noise ratio at this extreme value was ~5 times lower than the theoretical maximum afforded by Poisson statistics.
Figure 7.
Comparison of observed counts (red triangles) and calculated photons (blue diamonds) outside of the Poisson counting range (λ>0.103) calculated by the single threshold method in eq. 15.
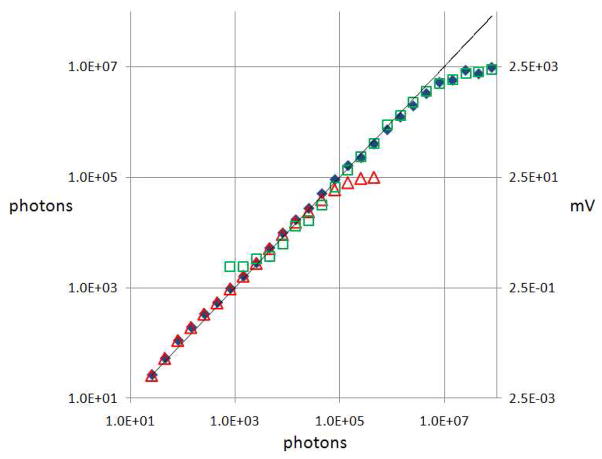
To extend the range further, several higher thresholds were chosen. The counts observed for the higher thresholds were converted to photons by numerically minimizing χ2(λ) for each threshold. Only a single parameter was used in the fits, since ML,1 and SL,1 were determined experimentally under conditions in which the Poisson and binomial distributions converged. In addition, signal-averaging measurements consistent with analog to digital conversion approaches were performed simultaneously with 512 averages. Figure 8 shows these collective results.
Figure 8.
Comparison of conventional SPC (red triangles), signal averaging ADC (green squares) and calculated photons (blue diamonds) using multiple counting threshold settings. The ADC measurements were rescaled to overlay to account for the proportionality between photons and voltage.
The linear range for photon counting is limited on the low end by the dark count rate and on the high end, as discussed above, by the deviation of the binomial distribution of counts and the Poisson distribution of photons (λ=.103 or p=.098). For the PMT used in figures 7 and 8, the dark count rate was 7.8×10⁻⁶ counts per laser pulse (corresponding to 78 counts per second over an acquisition window of 10 ns), yielding a linear range of ~4 orders of magnitude using conventional photon counting approaches. The linear range for signal averaging was limited on the low end by Johnson noise and on the high end by charge depletion of the dynodes. The signal averaging data were rescaled to overlay with the extrapolated linear fit from the SPC method for comparison. In this experiment, the linear range for signal averaging begins at ~1mV (λ=.045) and extends to ~890mV (λ=45) providing ~3 orders of magnitude of linear range.
The proposed analysis method was shown to have a linear range extending from the dark count rate all the way to saturation of the detector, ~7 orders of magnitude, spanning the entire range of both SPC and signal averaging. A total of 6 thresholds were used to cover this range. Analysis of the counts from the first threshold provided ~5.6 orders of magnitude and the other thresholds were used for the next ~1.4 orders of magnitude. The average standard deviation of the calculated number of photons, above Poisson range and below saturation was 1.5 times the theoretical limit.
Potential Complications
Similar to most counting methods, the approach described herein is susceptible to practical artifacts of the measurement devices. Ringing from slight mismatches in impedance can result in multiple counts from a single event (i.e., afterpulsing).14 However, time gating and/or meticulous impedance matching can usually alleviate this issue. Another complication can occur with high repetition rates. If the time between pulses is relatively short, the voltage transient may not recover to baseline before the next transient is generated. In this case, thresholds set to low magnitudes may not count the next pulse, biasing the measured counts. This “deadtime“ issue routinely plagues quantitation of CW signals. Solutions include increasing the time between pulses, reducing the response time of the detector, and/or otherwise correcting the lowthreshold data for this effect.
Gradual drift in the gain (i.e. ML,1 and SL,1) can also adversely affect the analysis. The single threshold method is relatively insensitive to this problem as long as the gain does not drop low enough that the probability of a pulse not exceeding the threshold becomes significant. However, the multi-threshold method explicitly relies on accurate characterization of the gain distribution and could generate different results if there is a significant discrepancy between the assumed and actual gain. The stability of a PMT should be characterized before applying methods for quantitation of voltages. Otherwise frequent calibration may be required. Quantitative measurements by conventional ADC also share this complication.
Conclusion
Two closely related and complementary statistical approaches were demonstrated for extending the linear range in photon counting measurements of coincident photons (e.g., using pulsed laser excitation). A simple expression relating observed counts and mean number of photons was derived to extend the linear counting range up to 2 orders of magnitude past the traditional limit on photon counting. A more general form of this expression can be used to numerically extend the linear range all the way to the limit where the PMT voltage response departs from linearity from electron depletion of the dynodes. This method bridged an existing gap in maintaining quantitation over measurements with high contrast, with potential applications in microscopy and spectroscopy.
In principle, this general method may be extended to include CW excitation, in which the photon arrival times are uniformly distributed locally rather than time-coincident. Achieving this goal will require considerations involving the temporal peak profile of the voltage transients as well. Concise analytical expressions may be nontrivial to derive under these conditions, but simulations may provide a route to numerically model the experimental measurements and recover the mean of the underlying Poisson distribution.
Acknowledgments
The authors gratefully acknowledge financial support from the NIH (P50 and R01) and the NSF (MRI-ID). DJK also acknowledges support from an Eastman Chemical fellowship.
References
- 1.Ingle JD, Crouch SR. CRITICAL COMPARISON OF PHOTON COUNTING AND DIRECT-CURRENT MEASUREMENT TECHNIQUES FOR QUANTITATIVE SPECTROMETRIC METHODS. Analytical Chemistry. 1972;44:785. doi: 10.1021/ac60312a020. [DOI] [PubMed] [Google Scholar]
- 2.Williamson JA, Kendalltobias MW, Buhl M, Seibert M. STATISTICAL EVALUATION OF DEAD TIME EFFECTS AND PULSE PILEUP IN FAST PHOTON-COUNTING - INTRODUCTION OF THE SEQUENTIAL MODEL. Analytical Chemistry. 1988;60:2198–2203. [Google Scholar]
- 3.Darland EJ, Leroi GE, Enke CG. PULSE (PHOTON) COUNTING - DETERMINATION OF OPTIMUM MEASUREMENT SYSTEM PARAMETERS. Analytical Chemistry. 1979;51:240–245. [Google Scholar]
- 4.Darland EJ, Leroi GE, Enke CG. MAXIMUM EFFICIENCY PULSE COUNTING IN COMPUTERIZED INSTRUMENTATION. Analytical Chemistry. 1980;52:714–723. [Google Scholar]
- 5.Hayes JM, Schoeller DA. HIGH PRECISION PULSE COUNTING - LIMITATIONS AND OPTIMAL CONDITIONS. Analytical Chemistry. 1977;49:306–311. [Google Scholar]
- 6.Hayes JM, Matthews DE, Schoeller DA. EFFECTIVE DEADTIME OF PULSE-COUNTING DETECTOR SYSTEMS. Analytical Chemistry. 1978;50:25–32. [Google Scholar]
- 7.Whitmore CD, Essaka D, Dovichi NJ. Six orders of magnitude dynamic range in capillary electrophoresis with ultrasensitive laser-induced fluorescence detection. Talanta. 2009;80:744–748. doi: 10.1016/j.talanta.2009.07.060. [DOI] [PMC free article] [PubMed] [Google Scholar]
- 8.Nau VJ, Nieman TA. PHOTOMETRIC INSTRUMENT WITH AUTOMATIC SWITCHING BETWEEN PHOTON-COUNTING AND ANALOG MODES. Analytical Chemistry. 1981;53:350–354. [Google Scholar]
- 9.Stoyanov DV. Novel technique for photon correlation measurements at high photon rates and resolutions. Optical Engineering. 1997;36:1792–1798. [Google Scholar]
- 10.Strobel HA, Heineman WR. Chemical Instrumentation: A Systematic Approach. 1989. [Google Scholar]
- 11.Staton KL, Dorsel AN, Scheifer A. Large dynamic range light detection. 6,355,921. [accessed Oct, 22, 2010];US Patent. 2002 May 17; http://www.freepatentsonline.com/6355921.html.
- 12.Soukka JM, Virkki A, Hanninen PE, Soini JT. Optimization of multi-photon event discrimination levels using Poisson statistics. Optics Express. 2004;12:84–89. doi: 10.1364/opex.12.000084. [DOI] [PubMed] [Google Scholar]
- 13.Gao X, Xu H, Ye D. International Journal of Mathematics and Mathematical Sciences. 2009;2009 doi: 10.1155/2010/915958. [DOI] [PMC free article] [PubMed] [Google Scholar]
- 14.Bebelaar D. TIME RESPONSE OF VARIOUS TYPES OF PHOTOMULTIPLIERS AND ITS WAVELENGTH DEPENDENCE IN TIME-CORRELATED SINGLE-PHOTON COUNTING WITH AN ULTIMATE RESOLUTION OF 47-PS FWHM. Review of Scientific Instruments. 1986;57:1116–1125. [Google Scholar]


