

Abstract
Objective
To investigate the impact white matter hyperintensities (WMH) detected on MRI have on motor dysfunction and cognitive impairment in non-demented elderly subjects.
Design
Cross-sectional study.
Setting
Population-based study on the incidence and prevalence of cognitive impairment in Olmsted County, MN.
Participants
A total of 148 non-demented elderly (65 males) ranging in age from 73 to 91 years.
Main Outcome Measures
We measured the percentage of the total white matter volume classified as WMH (WMHp) in a priori defined brain regions (i.e. frontal, temporal, parietal, occipital, periventricular or subcortical). Motor impairment was evaluated qualitatively using the Unified Parkinson’s Disease Rating Scale (UPDRS) summary measures of motor skills and quantitatively using a digitized portable walkway system. Four cognitive domains were evaluated using z-scores of memory, language, executive function, and visuospatial reasoning.
Results
A higher WMHp in all regions except occipital was associated with lower executive function z-score (p-value<0.01). A higher WMHp in all regions, but most strongly for parietal lobe, correlated with higher gait/postural-stability/posture UPDRS sum (p-value<0.01). A higher WMHp whether periventricular, subcortical or lobar correlated with reduced velocity (p-value<0.001).
Conclusions
We conclude that executive function is the primary cognitive domain affected by WMH burden. The data suggests that WMH in the parietal lobe are chiefly responsible for reduced balance and postural support compared to the other three lobes and may alter integration of sensory information via parietal lobe dysfunction in the aging brain. It is of interest that parietal WM changes were not the predominant correlate with motor speed, lending evidence to a global involvement of neural networks in gait velocity.
Introduction
White matter hyperintensities (WMH) on T2-weighted magnetic resonance imaging (MRI) and T2-weighted fluid attenuated inversion recovery (FLAIR) MRI have been associated with cognitive dysfunction, particularly memory and executive dysfunction, in the elderly.1–7 In addition to age-associated cognitive deficits, WMH may also contribute to age-associated impairments in gait and balance.7, 8 In one recent study WMH were correlated with both motor and cognitive functions in the same individuals.5
While there has been interest in the relative contribution of periventricular (PV) versus subcortical WMH (SC-WMH) to gait disorders and cognitive impairment,5, 9 there has been less attention focused on the lobar distribution of WMH. The goals of the current study were to determine: (1) the association between WMH and motor and cognitive deficits in a group of non-demented elderly subjects who were derived from a population-based cohort, (2) how the radial location (PV versus SC) of the WMH influenced these associations and (3) how the lobar location of the WMH influenced these associations. We hypothesized that WMH in certain regions (e.g., frontal lobe), would have greater impact than WMH in other regions (e.g., occipital lobe). Moreover, we hypothesized that PV-WMH would correlate with motor dysfunction and SC-WMH would correlate with cognitive dysfunction based on the assumption that PV-WMH may disrupt action potential propagation in long descending fiber tracts, while SC-WMH would disrupt propagation in corticocortical fibers.
Methods
Sample Characteristics
Subjects were participants in the Mayo Clinic Study of Aging (MCSA), a population-based study on the incidence and prevalence of cognitive impairment in Olmsted County, MN. The institutional review boards at Mayo Clinic and Olmsted Medical Center approved all MCSA procedures. The MCSA participants were randomly selected and invited to undergo subsequent in-person evaluations, as well as neurological and neuropsychological testing. MR imaging has been incorporated into the MCSA since its inception in 2005. A detailed report of design and sampling has been previously published.10 From the total population of 1434 MCSA controls, 436 MCSA participants underwent both GAITRite testing and MR imaging as of May 2008. Of these, only subjects who received a consensus committee diagnosis of neurologically normal11, had a sum of boxes Clinical Dementia Rating score (CDR) of zero, and had neuropsychological, neurological and motor examinations performed within 120 days of MRI acquisition were included in the present study. Subjects were excluded if they had potentially confounding diagnoses such as tumor, alcohol, single stroke or Parkinson’s disease. MRIs of subjects were evaluated for artifacts and removed if the quality interfered with image analysis. The final cohort included 148 non-demented elderly (65 males) ranging in age from 73 to 91 years, with a median of 79 years. Their median estimated Mini-Mental Status Examination (MMSE) score was 28 with a range from 24 to 30 (Table 1). All subjects gave written informed consent to participate.
Table 1.
Demographics, health history, cognitive and motor characteristics of the study population
| Variable | Value |
|---|---|
| Number of subjects | 148 |
| Number of diabetics (%)a | 29 (19.6) |
| Number with hypertension (%)a | 103 (69.6) |
| Number with high cholesterol or lipids (%)a | 93 (62.8) |
| Number of women (%) | 83 (56.1) |
| Age, years | 79 (76, 83) [73 to 91] |
| Education, years | 13 (12, 16) [6 to 20] |
| Estimated MMSEb | 28 (28, 29) [24 to 30] |
| Global Z score | 0.7 (0.1, 1.1) [−1.6 to 2.2] |
| Memory measures | |
| Z score | 0.7 (0.2, 1.4) [−1.7 to 2.6] |
| WMS-R logical memory II | 18.0 (14.0, 23.5) [2.0 to 37.0] |
| WMS-R visual reproduction II | 24.0 (18.0, 29.2) [0.0 to 41.0] |
| AVLT delayed recall | 8.0 (6.0, 10.0) [0.0 to 15.0] |
| Language measures | |
| Z score | 0.3 (−0.1, 0.8) [−1.9 to 2.4] |
| Boston naming score | 56.0 (52.2, 58.0) [39.0 to 60.0] |
| Category fluency total | 41.0 (36.0, 47.0) [27.0 to 69.0] |
| Executive function measures | |
| Z score | 0.5 (−0.0, 1.0) [−1.8 to 2.5] |
| WAIS-R digit symbol | 43.0 (35.0, 50.0) [23.0 to 75.0] |
| Trail making test part B | 90.0 (74.0, 121.0) [40.0 to 300.0] |
| UPDRS (% > 0) | |
| Upper sum | 0 (13.5%) [0 to 6] |
| Lower sum | 0 (1.4%) [0 to 2] |
| Gait and postural stability | 0 (25.4%) [0 to 2] |
| Gait, posture, and postural stability | 0 (35.9) [0 to 4] |
| Velocity, cm/s | 108 (92, 119) [40 to 156] |
| Ambulation time, s | 6.7 (6.0, 8.7) [2.6 to 18.5] |
| Stride length, cm | 118 (106, 130) [41 to 162] |
Health history information was identified through self-report and medications.
Converted to MMSE from the Short Test of Mental Status to assist in interpretability. Except where indicated, values shown are median (interquartile range) [range]
Cognitive measures
Neurological and neuropsychological tests performed by the MCSA10 have been described previously. For this study, four cognitive domains were defined using a neuropsychological battery, including Wechsler Adult Intelligence Scale-Revised (WAIS-R) subtests. The composite standardized z-scores were calculated for each subtest, and included the subtest score subtracted by the mean and standard deviation from the overall MCSA cohort for that test. The domains included memory (Logical Memory II and Visual Reproduction II from the Wechsler Memory Scale-Revised, delayed recall from the Auditory Verbal Learning Test); language (Boston Naming Test, Semantic Fluency); visuospatial (Picture completion and block design from the WAIS-R); and executive function (Trail Making Test B (TMT-B)), and Digit Symbol from the WAIS-R). A global z-score was calculated from the average z-score of the 9 tests that form the four cognitive domains. A regression method was used to derive an estimated MMSE score from the 38 item Short Test of Mental Status.
Gait measures
Qualitative gait assessment was determined with the modified Unified Parkinson’s Disease Rating Scale (UPDRS).12 The motor examination portion of the test was broken into four measures: upper sum (speech volume, facial expression, hand tremor at rest, rigidity of neck and arms); lower sum (leg tremor at rest and leg rigidity); gait and postural stability sum with posture; and gait and postural stability sum without posture. A higher postural stability score can be interpreted as impairment in balance, whereas a higher posture score indicates the shoulders are leaning forward in a stooped manner. The possible number of points for the upper sum, lower sum, and gait and postural stability measure with and without posture were 28, 16, 12, and eight points, respectively (Table 1).
Quantitative gait assessment was measured using a 4.88 meter digitized walkway system with embedded pressure sensors (GAITRite; CIR systems, Havertown, PA, USA).13 Gait velocity was measured from the first footfall to the last, in units of centimeters per second. Ambulation time was recorded as the amount of time it took to walk the length of the walkway from initial step to last. The stride length was measured as the average distance between consecutive steps of the left foot while walking the length of the walkway.
MRI procedures
Scan protocol
All scans were performed at 3T (GE Signa) at the Mayo Clinic, Rochester. The standardized MRI protocol included a sagittal T1-weighted 3-dimensional volume magnetization prepared gradient-echo (MPRAGE). Scan parameters include a section thickness of 1.2 mm in the 170 contiguous partitions with a field of view (FOV) of 26.0 cm × 26.0 cm, 256×256 matrix, bandwidth 31.3 kHz, 8° flip angle, TR=6.6 ms and TE=2.8 ms. An axial T2-weighted FLAIR scan was acquired with 48 contiguous slices, each 3.0 mm in thickness, FOV=22 cm × 22 cm, TR=11000 ms, TI=2250 ms, TE=147 ms, bandwidth=31.3 kHz, and matrix=256×192.
WM atlas
A WM parcellation atlas was manually traced onto a custom T1 template using the program Analyze by a trained neuroanatomist. A detailed description of the custom template design can be found in Vemuri et al.14 Radial WM parcellation within the four lobes of the brain (frontal, temporal, parietal and occipital) was based on standardized anatomic criteria (Figure 1). The PV zone was defined as the region within a boundary drawn half-way between the ventricular lining and the depth of the deepest penetrating sulcus at any point along the circumference of the lateral ventricle. The WM outside of this boundary, which included the WM in the cortical gyri, defined the SC zone.
Figure 1.
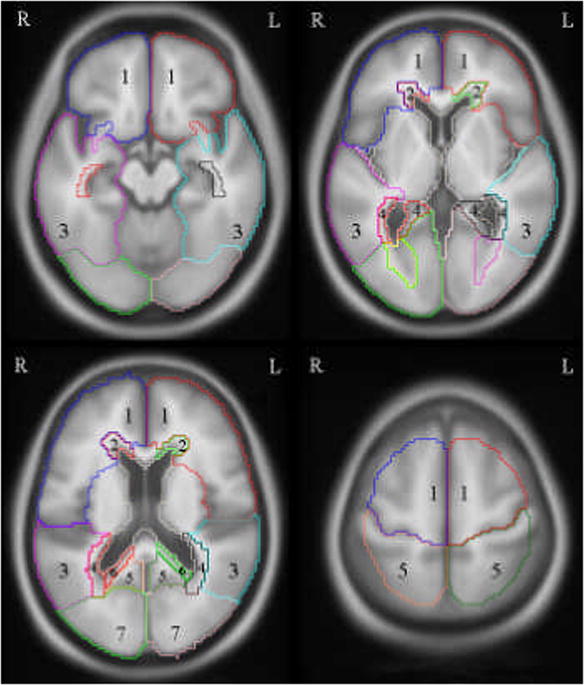
A regional white matter (WM) atlas was created on our standard template and used to parcellate right/left periventricular (PV), subcortical (SC) and lobar WM hyperintensity volumes in subject space to compensate for inter-subject variation. Four representative slices can be found above proceeding from the inferior (top left) to superior (bottom right) direction. (Key: 1-SC frontal, 2-PV frontal, 3-SC temporal, 4-PV temporal, 5-SC parietal, 6-PV parietal, 7-SC occipital, not shown-PV occipital)
ROI- based quantification of WMH in each subject
WMH were segmented from normal brain tissue on FLAIR images using an in-house semi-automated image analysis software tool named Histoseg®, which produces a binary mask.15 Next, we used tools in the Statistical Parametric Mapping 5 (SPM5) suite,16 as well as custom built software to assign the identified WMH to specific lobar and radial regions of interest (ROI). For each subject, we first co-registered the FLAIR and its associated binary WMH mask to the MPRAGE, using a six degrees-of-freedom affine registration. Next, using the unified segmentation17 algorithm in SPM5, we simultaneously segmented the MPRAGE into gray matter (GM), white matter (WM), and cerebrospinal fluid (CSF), and computed the discrete cosine transform (DCT) parameters to spatially normalize the subject images into the space of the custom template. We then applied these inverse DCT parameters, to the WM atlas, thereby obtaining a set of anatomical atlas labels corresponding to the subject’s MPRAGE image. Finally, we used these subject space labels to parcellate the binary WMH masks into the aforementioned. We used a hard classification scheme to binarize the segmentation maps produced by SPM5, whereby each voxel was labeled as GM, WM, or CSF, depending on which of the three tissue classes had a higher probability for that voxel. In order to determine WM volume in each ROI, the resulting binary WM masks were parcellated into the same ROIs as the WMH masks. To adjust for inter-subject differences in the volume of the WM in each lobe, a derived value WMH proportion (WMHp) was also created to represent the percentage of WM in each lobe that was “at risk.” The WMHp was defined for a given region (x) as the volume of the WMH in a given ROI (WMHx) divided by the volume of WM in that ROI (WMx) and multiplied by 100 (i.e. WMHp(x)=(WMHx/WMx)*100). Using WMHp, to evaluate functional impairment, controls for variations in brain size across different subjects, eliminating the need to normalize WMH data by total intracranial volume.
Statistical analysis
Data was analyzed with nonparametric methods when it was not normally distributed. Log transforms were applied for graphic representation of the data. A pairwise multiple comparisons was run to test difference of ranks between regional WMHp with significance set at p<0.05. Associations between non-imaging measures and WMH values were examined with Spearman Rank Order correlations with an a priori significance level set at p<0.01.
Results
A subject’s frontal lobe WM volume (Table 2) tended to be more than double their temporal WM volume (p < 0.001), about 60% greater than their parietal WM volume (p < 0.001) and more than triple their occipital WM volume (p < 0.001). In terms of the percentage of WM tissue at risk, WMHp of the occipital lobe was far greater than that of the other three lobes (p<0.001). Still, on average an average subject’s parietal WMHp was greater than their temporal or frontal WMHp (p <0.01). The WMHp was far greater in the periventricular zone compared to subcortical WMHp (p<0.001).
Table 2.
Volumes used to determine the percentage of white matter at risk
| Region | WMH volume, cm3 | WM volume, cm3 | WMHpa |
|---|---|---|---|
| Total | 8.8 (5.3, 15.5) [1.3 to 62.1] |
333 (301, 370) [228 to 449] |
3 (2, 5) [0 to 14] |
| Periventricular | 5.6 (3.4, 9.2) [1.0 to 25.7] |
44 (40, 48) [30 to 57] |
12 (8, 22) [2 to 48] |
| Subcortical | 3.1 (1.6, 6.3) [0.2 to 36.3] |
290 (258, 321) [196 to 394] |
1 (1, 2) [0 to 10] |
| Frontal | 2.4 (1.3, 5.1) [0.2 to 27.8] |
141 (127, 155) [98 to 202] |
2 (1, 4) [0 to 17] |
| Temporal | 1.4 (0.9, 2.1) [0.1 to 6.5] |
62 (56, 69) [27 to 87] |
2 (2, 4) [0 to 10] |
| Parietal | 1.9 (0.8, 4.4) [0.1 to 20.4] |
86 (76, 96) [55 to 116] |
2 (1, 6) [0 to 20] |
| Occipital | 2.6 (1.6, 3.7) [0.4 to 7.4] |
44 (39, 48) [26 to 65] |
6 (4, 8) [1 to 17] |
Abbreviations: WMH, White matter hyperintensity; WM, White matter; WMHp, percentage of white matter at risk.
Percentages were calculated in the four main lobes and with regard to radial location.
Note: Values show are median (interquartile range) [range]
Relationship between WMHp and cognitive test scores
We analyzed the effect of laterality for PV versus SC and for lobar measures. There were no differences between right and left, therefore we combined the right and left hemisphere data for all subsequent analyses. Where no significant association was found between regional WMHp and cognitive data, the total WMHp correlation and significance value will be reported. There was no significant association between MMSE and percentage of PV, SC or WMHp (R=−0.02, p=0.83).
Greater WMHp correlated with worse performance in the executive function domain, with no independent effect of PV or SC-WMHp (Table 3). Lobar distribution of WMHp showed correlations with the executive function domain z-score for frontal, temporal and parietal lobes, but not for the occipital lobe (Figure 2). There was no correlation between Digit Symbol scores and overall WMHp. In contrast, significant correlations were found with TMT-B and PV, SC and total WMHp. TMT-B correlated best with frontal (Figure 2), temporal and parietal lobe WMHp, but not occipital WMHp. Plots of the Spearman rank-order correlations between z-scores of cognition and regional WMHp (Figure 2) demonstrate a similar pattern of strength. There was no relationship between WMHp and the z-scores for memory (R=−0.05, p=0.52) or language (R=−0.10, p=0.22), but the visuospatial domain showed a trend toward worse performance with greater WMHp (R=-0.16, p=0.06).
Table 3.
Correlative relationship between the percentage of WM at risk and cognitive measures
| Region WMHpa | MMSEb | Visual-spatial | Executive function | Trail Making Test B | WAIS-R Digit Symbol |
|---|---|---|---|---|---|
| Total | −0.02 (0.83) | −0.16 (0.06) | −0.22 (0.007) | 0.29 (<0.001) | −0.15 (0.07) |
| Periventricular | −0.02 (0.81) | −0.15 (0.07) | −0.23 (0.005) | 0.30 (<0.001) | −0.16 (0.05) |
| Subcortical | −0.02 (0.80) | −0.16 (0.06) | −0.22 (0.009) | 0.28 (<0.001) | −0.14 (0.09) |
| Frontal | −0.02 (0.80) | −0.14 (0.09) | −0.20 (0.01) | 0.31 (<0.001) | −0.12 (0.14) |
| Temporal | 0.02 (0.78) | −0.15 (0.08) | −0.25 (0.002) | 0.30 (<0.001) | −0.19 (0.03) |
| Parietal | −0.03 (0.73) | −0.16 (0.06) | −0.22 (0.009) | 0.27 (<0.001) | −0.14 (0.08) |
| Occipital | −0.07 (0.41) | −0.06 (0.45) | −0.17 (0.05) | 0.14 (0.10) | −0.17 (0.05) |
Abbreviations: WMHp, percentage of white matter at risk; MMSE, Mini-Mental State Examination; WAIS, Wechsler Adult Intelligence Scale.
Percentages were calculated in the four main lobes and radial location.
Converted to MMSE from the Short Test of Mental Status to assist in interpretability.
Note: Values shown are Spearman rank-order correlation (P-value)
Figure 2.

The plots along the top row depict the strength of the correlation that total, periventricular and subcortical WMHp have with clinical measures of cognition and motor skills. The bottom four plots are between the WMHp of the four main lobes of the brain and the clinical measures of cognition and motor skills.
Relationship between WMHp and ambulation
Gait and postural stability sum scores were significantly correlated with total WMHp, PV-WMHp and SC-WMHp (Table 4). UPDRS scores of tremor and rigidity split into upper and lower extremity sums, were not associated with any of the WMHp variables (R=0.05, p=0.54). In contrast, the total WMHp, PV-WMHp and SC-WMHp correlated significantly with gait and postural stability sum scores (Table 4). There is a correlation between parietal WMHp and gait/ postural stability that may account for this finding since there were no significant relationships with other lobar WMHp scores. The addition of the posture score strengthened the correlation globally (Figure 2). Reduced gait velocity (Table 4) correlated with PV and SC-WMHp (p<0.001), and velocity was associated with lobar WMHp (p<0.001). Shorter stride length correlated with a greater PV and SC-WMHp (p<0.001), as did frontal, temporal and parietal WMHp. The relationship between velocity and stride length with occipital WMHp was not as strong, but was significant (p<0.005).
Table 4.
Correlative relationship between qualitative and quantitative ambulation measures and the percentage of WM at risk
| Region WMHpa | UPDRS: Gait and Postural Stability | UPDRS: Gait, Posture, and Postural Stability | Velocity | Stride length |
|---|---|---|---|---|
| Total | 0.23 (0.006) | 0.27 (0.001) | −0.42 (<0.001) | −0.42 (<0.001) |
| Periventricular | 0.22 (0.009) | 0.26 (0.002) | −0.42 (<0.001) | −0.40 (<0.001) |
| Subcortical | 0.23 (0.006) | 0.24 (0.004) | −0.38 (<0.001) | −0.39 (<0.001) |
| Frontal | 0.20 (0.02) | 0.23 (0.006) | −0.41 (<0.001) | −0.44 (<0.001) |
| Temporal | 0.18 (0.04) | 0.21 (0.01) | −0.40 (<0.001) | −0.39 (<0.001) |
| Parietal | 0.28 (<0.001) | 0.30 (<0.001) | −0.40 (<0.001) | −0.39 (<0.001) |
| Occipital | 0.14 (0.09) | 0.23 (0.006) | −0.29 (<0.001) | −0.23 (0.005) |
Abbreviations: WMHp, percentage of white matter at risk; UPDRS, Unified Parkinson’s Disease Rating Scale
Percentages were calculated in the four main lobes and radial location.
Note: Values shown are Spearman rank-order correlation (P-value)
Comment
In a cohort of 148 non-demented community dwelling elderly individuals, we investigated whether a relationship exists between white matter hyperintensity load and motor or cognitive impairment. Few studies have investigated the differential impact of lobar, periventricular and subcortical WMH on functional impairment in neurologically normal indiviudals.4, 18 Of those, only one to our knowledge has evaluated the relationships between WMH volume and both motor and cognitive dysfunction in normal elderly.5 We found that decreases in executive function correlated with a greater WMHp, with the effect driven by a global increase in WMHp, though occipital WMHp correlates did not reach significance. In addition to a role in executive function, WMHp also correlated significantly with gait and posture measures. The strongest relationship we found was between quantitative measures of gait velocity and WMHp. We acknowledge that the sensitivity of cognition and gait assessments may differ, however the strength of the correlations were consistently greater with gait than cognition. This observation may suggest that the deleterious effects of WMH could impact motor function to a greater extent than cognition. On a note of caution, our reported correlations were statistically significant, but our imaging observations accounted for a small portion of the observed variance in cognitive and gait abnormalities related to WMH.
Increasing WMH volumes have been hypothesized to have an impact on ambulation in older adults,7, 19, 20 but the mechanism remains to be determined. Our elderly cohort was neurologically normal, and none were diagnosed with Parkinson’s disease. To our knowledge, our study is the first to examine associations of UPDRS items with burden of WMH. The strongest relationship we observed with the UPDRS was between the WMHp in the parietal lobe with gait and postural control with or without posture added. Gait and postural control are important factors for successful aging,21 with balance disturbances and falls being hypothesized to result from the interruption of frontal lobe connections and descending motor fibers.7, 22 A recent study evaluating qualitatively graded WMH and posturographic measures of balance, found that parieto-occipital WMH were more strongly associated with reduced balance compared to fronto-temporal WMH.8 Our study adds new information, suggesting that WMH in the parietal lobe are more directly responsible for reduced balance and postural support compared to the other three lobes. We hypothesize that the WM changes alter integration of sensory information via parietal lobe dysfunction in the aging brain.
The relationship between WMHp and motor disturbances was further strengthened by examining a quantitative measure of speed. Walking speed19 or subjective measures of mobility7, 20, 23 have been used to support the hypothesis that increases in WMH are related to impaired mobility. Regardless of regional involvement, a greater WMHp was strongly associated with reduced gait velocity. Somewhat surprising was the degree to which gait velocity correlated with WMH. It is a widely held view that speed of cognition undergoes the greatest decline with “normal” aging. The relationship between WMHp and gait velocity suggests that age-related abnormalities of WM may have the greatest impact on motor speed. It is of interest that parietal WM changes were not the predominant correlate with motor speed, lending evidence to a global involvement of neural networks in gait velocity. Whereas balance may require less cognitive input and rely more on the somatosensory input into the parietal lobe.
No relationship between the WMHp was observed with z-scores of memory or language, but did note a trend for the visuospatial domain, which might reflect an executive function component to visuospatial reasoning. Other studies have reported a relationship between memory and WMH; often in a cohort that included younger individuals and a wider range of cognitive functioning.2, 3, 6 We attempted to control for these factors, by only selecting a neurologically normal elderly cohort with a narrow age range (73 to 91 years of age). The observed association between executive function and overall WMHp is consistent with the current literature.2, 3, 6 A lack of a correlation between executive function and the percentage of WM at risk in the occipital lobe supports the hypothesis that anterior brain regions may play a key role in the decline of executive function. These collective findings provide evidence that age-related decline in cognitive processing speed is in part related to increased prevalence of WM pathology with age. Correlations between WMH and timed measures of executive function, gait and gait-postural scores, support the conclusion that WMH contribute to functional impairment. The selective nature of the functional deficits associated with WMH, suggest that the primary effect of WMH is to reduce the efficiency of neuronal signaling. This conclusion is strengthened by the fact that vastly different functional domains - cognition and gait - were affected, with the common theme being processing speed.
Acknowledgments
The authors would like to thank Dr. Keith Josephs for his advice concerning UPDRS measures. Ms. Murray has recieved her doctoral degree from the Mayo Graduate School and is funded by the Robert D. and Patricia E. Kern Predoctoral Fellowship. This work is supported by grants from the National Institute on Aging (P50 AG016574, U01 AG006786 and RO1 AG11378), and by the Robert H. and Clarice Smith and Abigail van Buren Alzheimer’s Disease Research Program. The Opus Building Construction Grant (NIH C06 RR018898) funded the neuroimaging facility. Dr. Petersen is the Chair of the Safety Monitoring Committee for Wyeth and Elan. He is also a consultant for Elan and GE Healthcare. Dr. Knopman serves on a Data Safety Monitoring board for Lilly. He is also an investigator in a clinical trial sponsored by Elan Pharmaceuticals, Baxter Pharmaceuticals and Forest Laboratories. He served as a one-time consultant to GlaxoSmithKline. He is an associate editor of Neurology and receives compensation for his editorial activities. Dr. Jack is an investigator in clinical trials sponsored by Baxter and Pfizer; and consults for Elan, Lilly and Pfizer.
Footnotes
financial disclosure
Dr. Murray, Mr. Senjem, Dr. Hollman, Mr. Preboske, Mr. Weigand, Dr. Ferman and Dr. Dickson have nothing to disclose.
References
- 1.DeCarli C, Murphy DG, Tranh M, et al. The effect of white matter hyperintensity volume on brain structure, cognitive performance, and cerebral metabolism of glucose in 51 healthy adults. Neurology. 1995;45(11):2077–2084. doi: 10.1212/wnl.45.11.2077. [DOI] [PubMed] [Google Scholar]
- 2.Burton EJ, Kenny RA, O’Brien J, et al. White matter hyperintensities are associated with impairment of memory, attention, and global cognitive performance in older stroke patients. Stroke. 2004;35(6):1270–1275. doi: 10.1161/01.STR.0000126041.99024.86. [DOI] [PubMed] [Google Scholar]
- 3.Breteler MM, van Amerongen NM, van Swieten JC, et al. Cognitive correlates of ventricular enlargement and cerebral white matter lesions on magnetic resonance imaging. The Rotterdam Study. Stroke. 1994;25(6):1109–1115. doi: 10.1161/01.str.25.6.1109. [DOI] [PubMed] [Google Scholar]
- 4.de Groot JC, de Leeuw FE, Oudkerk M, Hofman A, Jolles J, Breteler MM. Cerebral white matter lesions and subjective cognitive dysfunction: the Rotterdam Scan Study. Neurology. 2001;56(11):1539–1545. doi: 10.1212/wnl.56.11.1539. [DOI] [PubMed] [Google Scholar]
- 5.Silbert LC, Nelson C, Howieson DB, Moore MM, Kaye JA. Impact of white matter hyperintensity volume progression on rate of cognitive and motor decline. Neurology. 2008;71(2):108–113. doi: 10.1212/01.wnl.0000316799.86917.37. [DOI] [PMC free article] [PubMed] [Google Scholar]
- 6.Tullberg M, Fletcher E, DeCarli C, et al. White matter lesions impair frontal lobe function regardless of their location. Neurology. 2004;63(2):246–253. doi: 10.1212/01.wnl.0000130530.55104.b5. [DOI] [PMC free article] [PubMed] [Google Scholar]
- 7.Baloh RW, Ying SH, Jacobson KM. A longitudinal study of gait and balance dysfunction in normal older people. Arch Neurol. 2003;60(6):835–839. doi: 10.1001/archneur.60.6.835. [DOI] [PubMed] [Google Scholar]
- 8.Novak V, Haertle M, Zhao P, et al. White matter hyperintensities and dynamics of postural control. Magn Reson Imaging. 2009;27(6):752–759. doi: 10.1016/j.mri.2009.01.010. [DOI] [PMC free article] [PubMed] [Google Scholar]
- 9.Sachdev P, Wen W, Chen X, Brodaty H. Progression of white matter hyperintensities in elderly individuals over 3 years. Neurology. 2007;68(3):214–222. doi: 10.1212/01.wnl.0000251302.55202.73. [DOI] [PubMed] [Google Scholar]
- 10.Roberts RO, Geda YE, Knopman DS, et al. The Mayo Clinic Study of Aging: design and sampling, participation, baseline measures and sample characteristics. Neuroepidemiology. 2008;30(1):58–69. doi: 10.1159/000115751. [DOI] [PMC free article] [PubMed] [Google Scholar]
- 11.Petersen RC. Mild cognitive impairment as a diagnostic entity. J Intern Med. 2004;256(3):183–194. doi: 10.1111/j.1365-2796.2004.01388.x. [DOI] [PubMed] [Google Scholar]
- 12.van Hilten JJ, van der Zwan AD, Zwinderman AH, Roos RA. Rating impairment and disability in Parkinson’s disease: evaluation of the Unified Parkinson’s Disease Rating Scale. Mov Disord. 1994;9(1):84–88. doi: 10.1002/mds.870090113. [DOI] [PubMed] [Google Scholar]
- 13.Priest AW, Salamon KB, Hollman JH. Age-related differences in dual task walking: a cross sectional study. J Neuroeng Rehabil. 2008;5:29. doi: 10.1186/1743-0003-5-29. [DOI] [PMC free article] [PubMed] [Google Scholar]
- 14.Vemuri P, Gunter JL, Senjem ML, et al. Alzheimer’s disease diagnosis in individual subjects using structural MR images: validation studies. Neuroimage. 2008;39(3):1186–1197. doi: 10.1016/j.neuroimage.2007.09.073. [DOI] [PMC free article] [PubMed] [Google Scholar]
- 15.Jack CR, Jr, O’Brien PC, Rettman DW, et al. FLAIR histogram segmentation for measurement of leukoaraiosis volume. J Magn Reson Imaging. 2001;14(6):668–676. doi: 10.1002/jmri.10011. [DOI] [PMC free article] [PubMed] [Google Scholar]
- 16.Ashburner J, Friston KJ. Voxel-based morphometry--the methods. Neuroimage. 2000;11(6 Pt 1):805–821. doi: 10.1006/nimg.2000.0582. [DOI] [PubMed] [Google Scholar]
- 17.Ashburner J, Friston KJ. Unified segmentation. Neuroimage. 2005;26(3):839–851. doi: 10.1016/j.neuroimage.2005.02.018. [DOI] [PubMed] [Google Scholar]
- 18.Sachdev PS, Wen W, Christensen H, Jorm AF. White matter hyperintensities are related to physical disability and poor motor function. J Neurol Neurosurg Psychiatry. 2005;76(3):362–367. doi: 10.1136/jnnp.2004.042945. [DOI] [PMC free article] [PubMed] [Google Scholar]
- 19.Soumare A, Elbaz A, Zhu Y, et al. White matter lesions volume and motor performances in the elderly. Ann Neurol. 2009;65(6):706–715. doi: 10.1002/ana.21674. [DOI] [PubMed] [Google Scholar]
- 20.Wolfson L, Wei X, Hall CB, et al. Accrual of MRI white matter abnormalities in elderly with normal and impaired mobility. J Neurol Sci. 2005;232(1–2):23–27. doi: 10.1016/j.jns.2004.12.017. [DOI] [PubMed] [Google Scholar]
- 21.Snijders AH, van de Warrenburg BP, Giladi N, Bloem BR. Neurological gait disorders in elderly people: clinical approach and classification. Lancet Neurol. 2007;6(1):63–74. doi: 10.1016/S1474-4422(06)70678-0. [DOI] [PubMed] [Google Scholar]
- 22.Starr JM, Leaper SA, Murray AD, et al. Brain white matter lesions detected by magnetic resonance [correction of resosnance] imaging are associated with balance and gait speed. J Neurol Neurosurg Psychiatry. 2003;74(1):94–98. doi: 10.1136/jnnp.74.1.94. [DOI] [PMC free article] [PubMed] [Google Scholar]
- 23.Whitman GT, Tang Y, Lin A, Baloh RW. A prospective study of cerebral white matter abnormalities in older people with gait dysfunction. Neurology. 2001;57(6):990–994. doi: 10.1212/wnl.57.6.990. [DOI] [PubMed] [Google Scholar]