
Fig. 1.
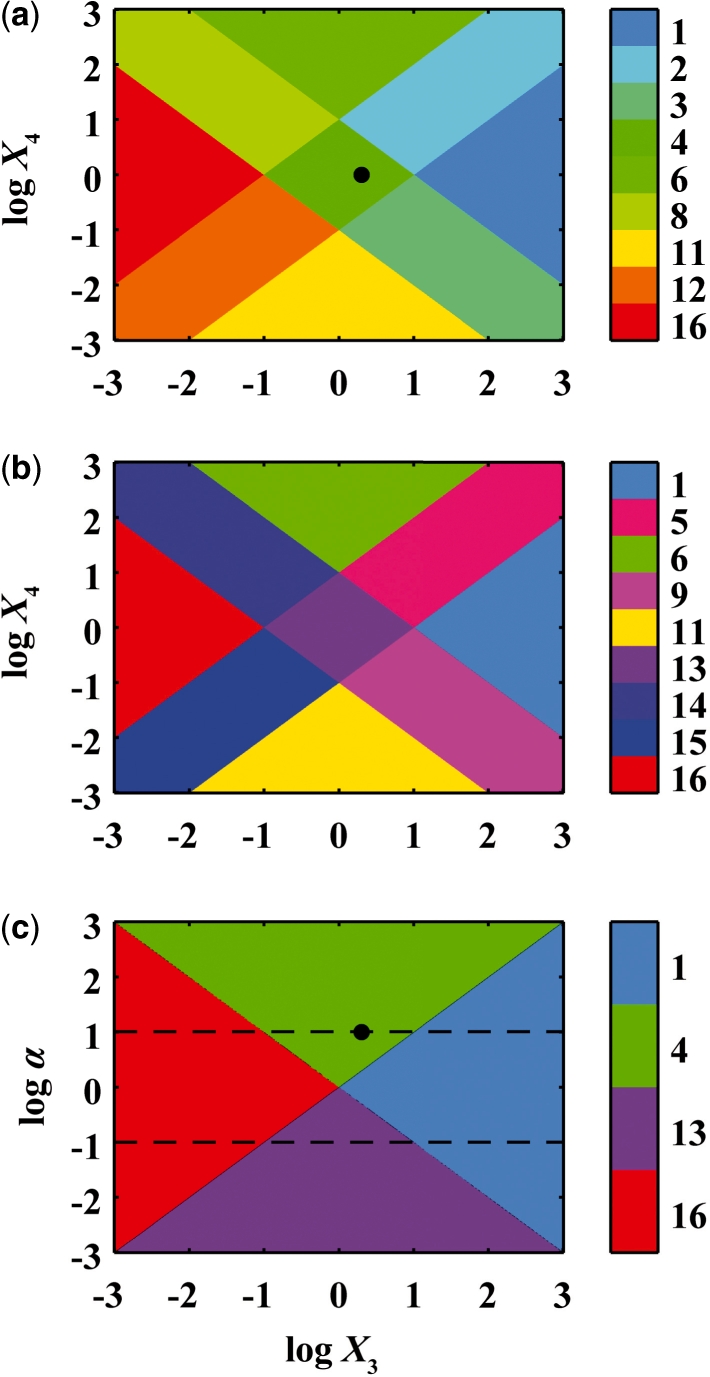
Visualization of the design space for the example system when varying parameters X3, X4 and α, colored by region number; (a) slice at α = 10; (b) slice at α = 0.1; (c) slice at X4 = 1; dashed line, location of a slice; filled circle, normal operating point.